3.2
Impact Factor
ISSN: 1837-9664
J Cancer 2016; 7(13):1791-1797. doi:10.7150/jca.15564 This issue Cite
Short Research Communication
Noninvasive Monitoring of Glioma Growth in the Mouse
1. Department of Experimental Medicine (DiMES), University of Genoa, Leon Battista Alberti 2, 16132, Genoa-Italy.
2. IRCCS-AOU San Martino-IST, Largo Rosanna Benzi 10, 16132, Genoa-Italy.
Received 2016-3-17; Accepted 2016-5-17; Published 2016-8-12
Abstract
Malignant gliomas are the most common and deadly primary malignant brain tumors. In vivo orthotopic models could doubtless represent an appropriate tool to test novel treatment for gliomas. However, methods commonly used to monitor the growth of glioma inside the mouse brain are time consuming and invasive. We tested the reliability of a minimally invasive procedure, based on a secreted luciferase (Gaussia luciferase), to frequently monitor the changes of glioma size.
Gluc activity was evaluated from blood samples collected from the tail tip of mice twice a week, allowing to make a growth curve for the tumors. We validated the correlation between Gluc activity and tumor size by analysing the tumor after brain dissection. We found that this method is reliable for monitoring human glioma transplanted in immunodeficient mice, but it has strong limitation in immunocompetent models, where an immune response against the luciferase is developed during the first weeks after transplant.
Keywords: Live monitoring, secreted luciferase, gliomas.
Introduction
Malignant gliomas are among the hardest challenge of modern oncology. Despite all the efforts of scientific community, only modest improvements have been achieved in the last decades. To break the current deadlock, an important tool is represented by in vivo models of gliomas. To be reliable, these models have to grow orthotopically inside the brain of animals, and this make their development not easy to monitor. The available options to monitor the orthotropic growth of gliomas are NMR [1], microPET [2] and bioluminescence analysis on tumors engineered to express a luciferase [3]. All these methods are generally time consuming, expensive and, most importantly, extremely invasive, requiring risky procedures for anesthesia and substrates administration. This greatly limits the frequency of measurements, preventing a reliable analysis of tumor growth dynamic.
A possible alternative to the aforementioned methods is the employment of reporter proteins secreted in liquid fluids, which can be measured frequently over the time, therefore providing a large amount of data with minimally invasive procedures.
Secreted alkaline phosphatase (SEAP) and Gaussia luciferase (Gluc) are the most used liquid fluid reporters. These enzymes can be exploited for different applications and have been used to monitor several processes, including the growth of tumor masses in inaccessible locations [4-6].
Gluc is one of the smallest luciferase (19.9 kDa), isolated from the copepod Gaussia princeps. Unlike the first generation of luciferases, like Photinus pyralis luciferase (Fluc) and Renilla reniformis luciferase (Rluc), Gluc is naturally secreted by cells. Moreover, Gluc activity does not require ATP and, in vitro, is linear with the number of cells [7]. Gluc has a flashing kinetics and its activity tends to rapidly decrease when reacting with its substrate celenterazine [8]. This disadvantage is, however, largely compensated by its initial activity per mole, that is about 100 times higher than that of Rluc and 1000 times higher than that of Fluc [9-11]. This makes Gluc an excellent choice as body fluid reporter, since its assay is extremely sensitive, about 20,000-fold higher than that of SEAP [12]. Few microliters of blood taken from the mouse tail tip are sufficient to obtain an accurate measurement, making possible to perform daily assays.
A few studies have already reported the use of Gluc as biomarker to monitor neoplastic cell proliferation in various tumour models including intracranial gliomas [7, 13, 14]. However, the extent of the correlation between Gluc levels in blood and tumor burden has not been thoroughly analysed.
The aim of this work is to test the efficiency of Gluc as a blood reporter system to dynamically estimate the tumor size and to monitor the intracranial growth of gliomas in both immunodeficient and immunocompetent mice.
We found that the assay of Gluc in the blood of immunodeficient mice allows the detection of a tumor graft as early as ten days from transplant, and, in average, 60 days before mice showed the first hint of neurological symptoms. We also observed a good correlation between Gluc activity and tumor size evaluated with morphometric and weight analyses. In immunocompetent mice, however, the use of Gluc is limited by the development of immune response that inhibits Gluc activity, impairing its correlation with tumor size.
Materials and Methods
Animal procedures
Mice were handled in agreement with guidelines conforming to current Italian regulations for the protection of animals used for scientific purposes (D.lvo 27/01/1992, no. 116). Procedures were approved by the Ethical Committee for Animal Experimentation of the IRCCS San Martino-IST and by the Italian Ministry of Health. The experiments were performed on the Nod/Scid and BALB/c mouse strains. Anesthetized animals were injected by way of a stereotaxic apparatus. Up to 5 µl of suspension, containing from 4x10⁴ to 105 cells preparations, were injected using a Hamilton syringe (Bregma coordinates: anterio-posterior, 1.0 mm; lateral, 1.5 mm left and 2.5 mm below the skull surface). Resorbable suture was used before awakening the animals. Animals were then monitored daily and killed at first sign of neurological symptoms or, in some instance, before it, as soon as they reached planned levels of Gluc activity. Their brains were then explanted and photographed under a Leica fluorescence stereomicroscope (Wetzlar, Germany).
Gluc assays were carried on twice a week, by collecting about 5 µl of blood from the tail tip of mice in tube containing 0.5M EDTA. Mice sera were obtained by centrifuging at 500 RCF blood samples preincubated without EDTA at 37°C for 30 minutes.
To estimate the volume of the tumors inside the brains, the apparent feret diameters of the tumor were calculated from two pictures taken from the dorsal- (upper feret) and from the ventral- (lower feret) side of the brain. We then approximated the tumor volume to that of a sphere with a diameter equal to the average between the upper and lower feret diameter.
Survival curves were determined using Kaplan-Meier analysis and survival between groups was assayed by log-rank test.
Retroviral Vectors
pCAG:DsRed-EGFRvIII and pCAG:DsRed retroviral vectors were previously described [15].
pCAG:mGFP-Gluc vector was obtained as follows. The coding sequence of Gaussia luciferase from the pCMV-GLuc 2 Control Plasmid (New England BioLabs, Hitchin, UK) was cloned into the pCAG:GFP vector (kindly provided by Dr. M. Goetz) upstream the IRES-GFP region. GFP sequence was replaced with a mutated, non-fluorescent, GFP (mGFP) that is detectable by immunostaining techniques. mGFP was obtained by substitution of three nucleotides inducing the mutations T66A and Y67A by PCR.
Cell cultures and Transduction Procedures
Human glioma initiating cells (hGIC) L0306, kindly provided by Dr. R. Galli [16], were engineered with pCAG:DsRed and oCAG:mGFP-Gluc and maintained as spheres in Neurocult Medium supplemented with NeuroCult NS-A (StemCell Technologies, Vancouver, British Columbia, CA), human recombinant fibroblast growth factor 2 (10 ng/ml; PeproTech, Rocky Hill, USA), epidermal growth factor (20 ng/ml; PeproTech, Rocky Hill, USA) and Heparin (2µg/ml, Sigma-Aldrich, Milano,Italy).
HGG[vIII] cells were obtained from INK4a/ARF knock-out BALB/c mice intracranially injected with syngeneic neural progenitor cells transduced with pCAG:DsRed-EGFRvIII as previously described [17]. Cells were maintained in Dulbecco's modified Eagle's medium-F12 (Invitrogen, Carlsbad,CA) with B27 supplement (Invitrogen, Carlsbad,CA), human basic fibroblast growth factor (10 ng/ml, Peprotech, London, UK) and epidermal growth factor (10 ng/ml, Peprotech, London, UK) and plated on Matrigel (1:200; BD Biosciences, Franklin Lakes, NJ). Cultures from tumors were established microdissecting DsRed-positive areas under a fluorescence microscope and trypsinizing them for 20 minutes. Cells were maintained in the medium described above.
Gaussia luciferase assay
Gluc activity was evaluated in a reaction set up obtained by combining 5µl of blood sample with a buffer constituted by 17.5 µl of Stop & Glo® Buffer (Promega, Milano, IT) supplemented with coelentherazine, and 17.5 µl of a buffer containing HEPES 75mM; DTT 20 mM, EDTA 100 µM, pH 8.0. The luminometer (Promega Glomax 20/20n) was set to acquire a series of 40 consecutive measures with an integration time of 1 second. Data analysis was performed with the software "R".
Results and Discussion
Gluc expression does not alter cell proliferation rate and tumor latency of different glioma models
To be employed as tool for monitor glioma growth, a reporter gene should not induce alterations on cell behavior. A recent report addressed specifically this point on a model of glioma expressing firefly luciferase [18] showing not gross alteration on cell proliferation and in vivo growth. To assess whether also Gluc expression does not perturb glioma cells, we compared the doubling time of the human glioma initiating cells L0306, with that of L0306 transduced with pCAG:mGFP-Gluc construct expressing Gluc (L0306-Gluc). This analysis showed that Gluc does not grossly alter glioma proliferation rate, since the doubling time of L0306 was 3.8±1.3 days before transduction and 3.1±0.6 days after transduction.
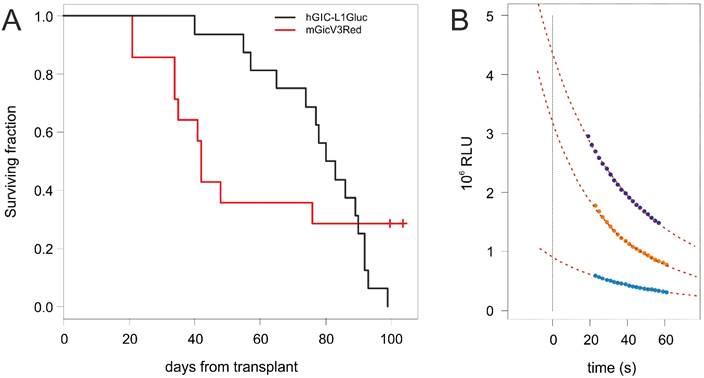
Most significantly, the median survival time of Nod/Scid mice following intracranic transplantation of L0306-Gluc (81 days, Figure 1A) did not significantly differed from that of mice transplanted with non-transduced L0306 cells (78 days). Similar results were obtained with the mouse glioma models induced by EGFRvIII overexpression (HGG[vIII] [15]) where the median survival time was 42 days for Gluc-transduced- (Figure 1A) and 41 days for untransduced-HGG[vIII] cells.
Correlation between glioma growth and Gluc activity
To evaluate the reliability of Gluc quantification as a method to monitor the growth of intracranic gliomas in mice, 105 L0306-Gluc cells were orthotopically transplanted in 18 Nod/Scid mice. Starting from two days after transplant, 5 µl of blood were collected twice a week from the tail tip and assayed for Gluc activity.
(A) Kaplan-Meyer survival curves of Nod/Scid mice transplanted with L0306-Gluc (black) and BALB/c mice transplanted with HGG[vIII] (red). (B) Gluc has a flashing kinetic and its activity dramatically decreases over the time when incubated with the substrate. The curves represent three examples of regression curves obtained from measured values of luminescence over the time (colored dots) to extrapolate the starting activity ([Gluc]T0), determining a value that is time-independent.

Since Gluc has a flashing kinetics, its activity (herein referred as [Gluc]) under substrate excess conditions changes rapidly during time. An analysis of our experimental data showed that [Gluc], which value is proportional to the luminescence, decreases over time following the relation:
To standardize the way of measuring [Gluc] in all blood samples, a series of measurements of luminescence over time was recorded for each sample and used to extrapolate by linear regression from the former relationship the starting activity of Gluc ([Gluc]T0; Figure 1B). This method allows fully exploiting the initial activity of the enzyme, thus making the assay very sensitive compared to methods relying on stabilization of the luciferase activity, which lowers it of one or more order of magnitude.
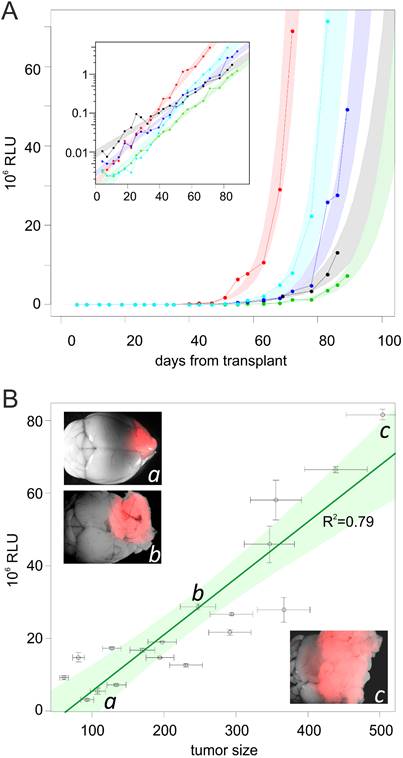
In 40% of the mice, the level of Gluc activity crossed the detection threshold already at the first experimental point, and the levels became detectable in all mice within 43 days after transplant. By plotting [Gluc]T0 values versus time after transplant, we obtained exponential curves (Figure 2A), suggesting that the tumors were expanding at an exponential rate, with a doubling time of 113±19 hours.
To measure the correlation between [Gluc]T0 and tumors burden, mice were killed when showing different levels of [Gluc]T0. Brains were photographed under an epifluorescence stereomicroscope that allows the visualization of the tumor mass thanks to the DsRed reporter gene expressed by L0306-Gluc cells. A morphometric analysis was then performed to estimate the volume of the tumors. Additionally, tumors were microdissected and weighted. These two independent measurements were combined to obtain an estimated tumor burden and to analyse its correlation with [Gluc]T0. This analysis showed that tumor burden is linearly related to [Gluc]T0 and the regression has a R2 of 0.79 (Figure 2B) independently from the localizations of the tumor that varied from mostly dorsal- to mostly ventral-localization and even partly extraencephalic (Figure 2B). This suggests that the localization of the tumor has a minor impact on the level of Gluc activity found in the blood. It should be noticed that the estimation of tumor burden is invariably affected by an error due to the variable tumor cell density inside the tumor masses. This may explain why the trend line of the logarithm of [Gluc]T0 over the time in each animal shows a better correlation coefficient (R2=0.97±0.03; Figure 2A) than that between [Gluc]T0 and the estimated tumor burden in different animals.
Similar results were obtained using a different line of hGIC transplanted in NOD/Scid mice (data not shown).
(A) Increase of [Gluc]T0 over the time from tumor transplant. The plot shows the levels of [Gluc]T0 from blood samples collected starting from 2 days after transplant, up to the end of the experiment in five representative mice. In the inset, the same curves are shown in logarithmic scale. Colored areas represent the 90% confidence interval of each regression curve. (B) Correlation between [Gluc]T0 and glioma size. The plot represents the [Gluc]T0 from mouse blood samples versus the size (estimated as described in the text) of L0306-Gluc tumors harbored by the mice. Green area represents the 90% confidence interval of the regression line (in dark green). Examples of brains harboring tumors (in red) from three mice with low (a), medium (b) and high (c) [Gluc]T0 are shown in inset pictures.

Gluc activity assay in immunocompetent mice
We then tested the suitability of Gluc assay in immunocompetent mice. Murine glioblastoma stem cells (HGG[vIII]), induced by the overexpression of EGFRvIII and the DsRed reporter gene in p16/p19 knock-out neural progenitor cells, were orthotopically transplanted in syngeneic adult BALB/c mice. Previous analyses showed that such a model is more aggressive than the L0306 in Nod/Scid mice, and the median survival time of transplanted animals is about 41 days. In contrast to the L0306 transplants, not all the HGG[vIII] transplants resulted in the development of a glioma and the overall penetrance was about 75%.
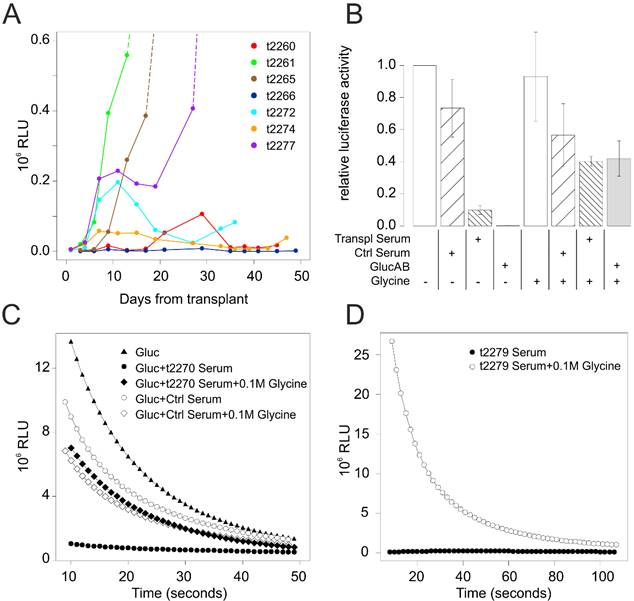
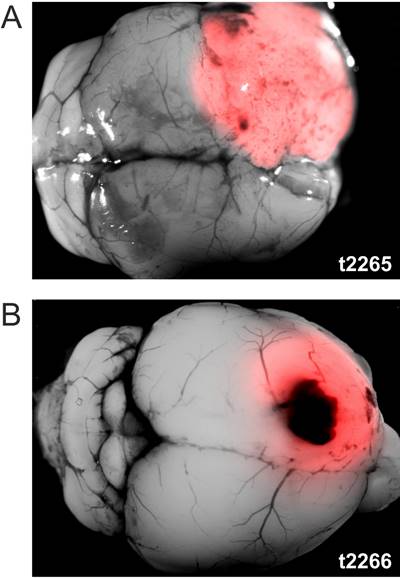
We therefore transplanted a pool of 24 mice with 4x10⁴ HGG[vIII] cells engineered to express Gluc (HGG[vIII]-Gluc). During the first 4 weeks from transplant, 9 animals showed growing levels of [Gluc]T0, consistent with a doubling time of the tumor mass of 51±20 hours, which reflected the higher aggressivity of the model. Thanks to the very dense series of measurements, in five additional animals we had the possibility to observe irregular patterns of Gluc levels, which underwent to a sudden decrease following a previous phase of growth. The remaining mice did not show any detectable level of Gluc (Figure 3A). From day 27, mice displaying higher Gluc levels started to develop neurological symptoms and were therefore killed. Mice were found to harbor large gliomas expressing DsRed reporter gene (Figure 4A). Unexpectedly, however, from day 36 some animals with low levels of [Gluc]T0 also started to display neurological symptoms. Four of them belonged to the group of animals with irregular pattern of Gluc activity, two showed a slight increase of [Gluc]T0 just before developing symptoms, and other two never showed any detectable level of Gluc. When analyzed, all these animals showed DsRed-expressing tumor masses similar in size to those found in the animals displaying high-level of [Gluc]T0 (Figure 4B).
(A) Levels of [Gluc]T0 in blood samples over the time in a representative sample of BALB/c mice transplanted with HGG[vIII]-Gluc cells. (B) Effects on Gluc activity of sera derived from BALB/c mice displaying irregular patterns of Gluc levels over the time (Transpl Serum) following transplantation with HGG[vIII]-Gluc cells. Purified anti-Gluc antibody (GlucAB) and sera from non-transplated BALB/c mice (Ctrl Serum) were included as positive and negative controls respectively. Glycine 0.1M was used, as control, to inhibit antibody binding. (C) The plot shows how the kinetic of Gluc reaction is modified by the incubation in the specified conditions. Ctrl serum and t2270 serum derived respectively from a non-transplanted mouse and a mouse transplanted with HGG[vIII]-Gluc 33 days before. (D) The plot shows the effects of 0.1M Glycine on the activity of Gluc in a transplanted mouse which displayed irregular pattern of Gluc activity over the time.

Example HGG[vIII] tumors of similar size derived from two BALB/c mice displaying very different [Gluc]T0 levels. [Gluc]T0 never reached a detectable level in the blood of t2266, while it exponentially grew in t2265.

Since this phenomenon was only seen in immunocompetent animals, we speculated that an immune response of the host occurred, selectively depleting the Gluc expressing population from the tumors. To test this hypothesis, we dissociated and cultured cells from tumor masses explanted from two animals displaying no detectable levels of Gluc in their blood and assayed their Gluc expression in vitro. Surprisingly, the supernatants from both cultures were found to contain an amount of Gluc not far from that of HGG[vIII]-Gluc population prior to the transplant, ranging from one half to one third of the original level. These results indicate that the fall of Gluc levels in those mice cannot be explained by a decrease of Gluc expressing cells. We therefore hypothesize that the decrease of [Gluc]T0 could be due to the rise of a neutralizing antibody against Gluc, as suggested by Tannous [6], but in contrast to what reported by other authors [19]. To test this possibility, we incubated a defined amount of Gluc with sera derived from mice having displayed low or irregular pattern of [Gluc]T0 over the time and found that 7 out of the 8 tested sera were able to dramatically inhibit Gluc activity (Figure 3B-C). On the contrary, sera derived either from non-transplanted mice or from mice that did not develop gliomas following HGG[vIII] transplant, were not able to significantly inhibit Gluc activity. Moreover, the further addition of 0.1M glycine in samples where Gluc was inhibited by serum restored the Gluc activity, as expected if the inhibition would depend on neutralizing antibodies (Figure 3B-C). The addition of 0.1M glycine was also able to unmask Gluc activity in sera of mice displaying barely detectable levels of Gluc but harbouring large tumor masses (Figure 3D). Taken together these results indicate that immunocompetent mice tend to develop neutralizing antibody that can perturb the Gluc activity. Accordingly, with this view, [Gluc]T0 was not correlated to tumor size even in those animals displaying exponentially growing [Gluc]T0 levels, as shown by the Pearson correlation coefficient lower than 0.5 (data not shown), suggesting the presence of Gluc antibodies even in these animals. The luciferase monitoring immunocompetent animals can be therefore used as qualitative method to determine whether tumor successfully grafted but cannot be used as a quantitative method to establish the tumor size.
Conclusions
Tumor growth is not easily monitored when the tumor mass is located in inaccessible locations as in the case of gliomas. A precise assessment of the tumor dynamic, however, would be important to evaluate the effects of experimental treatments and may guide the establishment of new treatments. An essential characteristic of a method designed to frequently monitor tumor growth should be a minimal invasiveness, and this criterion is not fulfilled by the currently used methods, which need anaesthesia and long acquisition times. Gluc assay allows to monitor tumor growth in Nod/Scid mice at least twice a week, with a rapid and non-invasive procedure. By exploiting the initial burst of activity of Gluc, our method is highly sensitive allowing to detect the tumor at very early stages. Data collected here allowed for the first time a thorough analysis of the correlation between [Gluc]T0 and tumor burden, determined directly by weight and morphometric assay. The analysis showed this correlation is good and thus we deem that Gluc assay represents an excellent tool to monitor gliomas in vivo. The Gluc assay is, however, not suitable in immunocompetent animals, due to the onset of an immune response against the luciferase.
Acknowledgements
We would like to thank Dr Magdalena Götz (Institute of Stem Cell Research-Helmholtz Centre Munich, Germany) for sharing plasmids and Dr Rossella Galli (IRCCS San Raffaele Scientific Institute, Milan, Italy) for providing L0306 cells. I.A. was supported by the grant GR-2011-02349694 from Italian Ministero della Salute.
Competing Interest
The authors declare that they have no competing interests.
References
1. Cho HR, Kim DH, Kim D, Doble P, Bishop D, Hare D. et al. Malignant glioma: MR imaging by using 5-aminolevulinic acid in an animal model. Radiology. 2014;272(3):720-30
2. Nedergaard MK, Kristoffersen K, Michaelsen SR, Madsen J, Poulsen HS, Stockhausen MT. et al. The use of longitudinal 18F-FET MicroPET imaging to evaluate response to irinotecan in orthotopic human glioblastoma multiforme xenografts. PLoS One. 2014;9(2):e100009
3. Sun A, Hou L, Prugpichailers T, Dunkel J, Kalani MA, Chen X. et al. Firefly luciferase-based dynamic bioluminescence imaging: a noninvasive technique to assess tumor angiogenesis. Neurosurgery. 2010;66(4):751-7 discussion 57
4. Lewandrowski GK, Magee CN, Mounayar M, Tannous BA, Azzi J. Simultaneous in vivo monitoring of regulatory and effector T lymphocytes using secreted Gaussia luciferase, Firefly luciferase, and secreted alkaline phosphatase. Methods in molecular biology. 2014;1098:211-27
5. Kitamura M, Hiramatsu N. Real-time monitoring of ER stress in living cells and animals using ESTRAP assay. Methods in enzymology. 2011;490:93-106
6. Tannous BA. Gaussia luciferase reporter assay for monitoring biological processes in culture and in vivo. Nature protocols. 2009;4(4):582-91
7. Wurdinger T, Badr C, Pike L, de Kleine R, Weissleder R, Breakefield XO. et al. A secreted luciferase for ex vivo monitoring of in vivo processes. Nature methods. 2008;5(2):171-3
8. Tannous BA, Kim DE, Fernandez JL, Weissleder R, Breakefield XO. Codon-optimized Gaussia luciferase cDNA for mammalian gene expression in culture and in vivo. Molecular therapy: the journal of the American Society of Gene Therapy. 2005;11(3):435-43
9. Verhaegent M, Christopoulos TK. Recombinant Gaussia luciferase. Overexpression, purification, and analytical application of a bioluminescent reporter for DNA hybridization. Analytical chemistry. 2002;74(17):4378-85
10. Branchini BR, Southworth TL, Khattak NF, Michelini E, Roda A. Red- and green-emitting firefly luciferase mutants for bioluminescent reporter applications. Anal Biochem. 2005;345(1):140-8
11. Matthews JC, Hori K, Cormier MJ. Purification and properties of Renilla reniformis luciferase. Biochemistry. 1977;16(1):85-91
12. Badr CE, Hewett JW, Breakefield XO, Tannous BA. A highly sensitive assay for monitoring the secretory pathway and ER stress. PLoS One. 2007;2(6):e571
13. Tseng AW, Akerstrom V, Chen C, Breslin MB, Lan MS. Detection of neuroendocrine tumors using promoter-specific secreted Gaussia luciferase. International journal of oncology. 2016;48(1):173-80
14. Chung E, Yamashita H, Au P, Tannous BA, Fukumura D, Jain RK. Secreted Gaussia luciferase as a biomarker for monitoring tumor progression and treatment response of systemic metastases. PLoS One. 2009;4(12):e8316
15. Appolloni I, Barilari M, Caviglia S, Gambini E, Reisoli E, Malatesta P. A cadherin switch underlies malignancy in high-grade gliomas. Oncogene. 2015;34(15):1991-2002
16. Mazzoleni S, Politi LS, Pala M, Cominelli M, Franzin A, Sergi Sergi L. et al. Epidermal growth factor receptor expression identifies functionally and molecularly distinct tumor-initiating cells in human glioblastoma multiforme and is required for gliomagenesis. Cancer Res. 2010;70(19):7500-13
17. Appolloni I, Calzolari F, Corte G, Perris R, Malatesta P. Six3 controls the neural progenitor status in the murine CNS. Cerebral cortex. 2008;18(3):553-62
18. Clark AJ, Safaee M, Oh T, Ivan ME, Parimi V, Hashizume R. et al. Stable luciferase expression does not alter immunologic or in vivo growth properties of GL261 murine glioma cells. J Transl Med. 2014;12:345
19. Yin Y, Takahashi Y, Ebisuura N, Nishikawa M, Takakura Y. Removal of transgene-expressing cells by a specific immune response induced by sustained transgene expression. The journal of gene medicine. 2014;16(3-4):97-106
Author contact
![]() Corresponding author: E-Mail: paolo.malatestait; Tel.: +39-010-5558403; Fax: +39-010-5558405.
Corresponding author: E-Mail: paolo.malatestait; Tel.: +39-010-5558403; Fax: +39-010-5558405.

 Global reach, higher impact