Impact Factor ISSN: 1837-9664

 Global reach, higher impact
J Cancer 2016; 7(13):1877-1887. doi:10.7150/jca.15512 This issue Cite
Research Paper
Phenylethanoid Glycosides from Cistanche tubulosa Inhibits the Growth of B16-F10 Cells both in Vitro and in Vivo by Induction of Apoptosis via Mitochondria-dependent Pathway
Jinyu Li1, Jinyao Li1 ![]() , Adila Aipire1, Li Gao2, Shixia Huo2, Jiaojiao Luo1, Fuchun Zhang1
, Adila Aipire1, Li Gao2, Shixia Huo2, Jiaojiao Luo1, Fuchun Zhang1
1. Xinjiang Key Laboratory of Biological Resources and Genetic Engineering, College of Life Science and Technology, Xinjiang University, Urumqi, Xinjiang, China;
2. Xinjiang Laboratory of Uyghur Medical Prescription, Xinjiang Institute of Traditional Uyghur Medicine, Urumqi, Xinjiang, China.
Received 2016-3-12; Accepted 2016-7-24; Published 2016-9-12
Abstract
Cistanche tubulosa phenylethanoid glycosides (CTPG) have been shown various biological activities including anti-allergy, hepatoprotective activity and bone regeneration. However, the anti-tumor activity of CTPG needs to be investigated. CTPG was used to treat B16-F10 cells both in vitro and in vivo. We found that CTPG dramatically changed the morphology of B16-F10 cells, and significantly reduced the viability of B16-F10 cells in a dose-dependent and time-dependent manner, which might be mediated by CTPG-induced apoptosis and cell cycle arrest. After CTPG treatment, the expressions of BAX and BCL-2 were up-regulated and down-regulated, respectively. Moreover, mitochondrial membrane potential was reduced and ROS generation was increased. Consequently, the levels of cytochrome c and cleaved-caspase-3 and -9 were up-regulated by CTPG treatment but not for cleaved-caspase-8. We further observed that CTPG significantly inhibited the tumor growth in vivo and improved the survival rate of tumor mice. We also observed that CTPG promoted the proliferation of splenocytes and increased the proportions of CD4+ and CD8+ T cells in spleens of tumor mice. The results showed that CTPG induced the apoptosis of B16-F10 cells through mitochondria-dependent pathway, suggesting that CTPG could be a potential candidate for treatment of cancer.
Keywords: Cistanche tubulosa phenylethanoid glycosides, B16-F10 cell apoptosis, cytochrome c, ROS, mitochondria-dependent pathway.
Introduction
Over the past several decades, a number of drugs targeted the mutants of the constituents in the mitogen-activated protein kinase (MAPK) signaling pathway or immune checkpoint inhibitors against cytotoxic T-lymphocyte-associated antigen 4 (CTLA-4) and PD-1 have been developed and approved by the United States Food and Drug Administration for the treatment of metastatic melanoma [1-3]. However, worldwide incidence of melanoma and death from melanoma continue to rise. In 2014, the estimated new cases of melanoma are 76,100 in the United States, and the estimated deaths are 9710 [4]. It is urgent to develop new drugs or agents to prolong progression-free survival and overall survival.
Traditional Chinese medicine (TCM) has been used to treat various diseases including cancer for several thousands of years. TCM with anti-tumor activity may provide potential candidates for anticancer drug development. Many active components have been identified and isolated from TCM and showed anti-tumor activities [5, 6]. Cistanche, a kind of TCM with various bioactivities including anti-oxidative, anti-aging, anti-osteoporotic, anti-nociceptive, anti-inflammatory and neuroprotective activities, contains many components including phenylethanoid glycosides (PhGs), iridoids, lignans, alditols, oligosaccharides, polysaccharides, and volatile oils [7-10]. PhGs are the major active components of Cistanche and have been shown the effects of anti-oxidation, anti-apoptosis, anti-inflammation, hepatoprotection and neuroprotection [7, 11-14]. Echinacoside and acteoside are two major compounds of PhGs and have been reported to improve glucose tolerance, promote cell proliferation and bone regeneration and inhibit type I allergy [15-18]. However, the anti-tumor activity of PhGs needs to be investigated. In this paper, we investigated the effects of the PhGs from Cistanche on the inhibition of B16-F10 melanoma cell growth in vitro and in vivo. We also explored the mechanism of PhGs on the inhibition of B16-F10 melanoma cell growth.
Material and methods
Ethics Statement
All animal studies were carried out according to the guidelines of the Animal Care and Use Committee of Xinjiang University. The protocol was approved by the Committee on the Ethics of Animal Experiments of Xinjiang Key Laboratory of Biological Resources and Genetic Engineering. The mice were anesthetized with pentobarbital sodium for injections and sacrificed by ether anesthesia. For measuring tumors, all efforts were made to ameliorate suffering.
Animals
Female C57BL/6 mice (6-8 weeks' age) were obtained from the Beijing laboratory animal research center (Beijing, China) and housed in a temperature-controlled, light-cycled animal facility of Xinjiang University.
High performance liquid chromatography (HPLC)
Cistanche tubulosa phenylethanoid glycosides (CTPG) were purchased from Hetian Dichen Biotech Co., Ltd (Hetian, Xinjiang, China) and dissolved by dimethyl sulfoxide (DMSO) (St. Louis, MO, USA) at the concentration of 100 mg/ml. The major compounds of CTPG were qualified and quantified by high performance liquid chromatography (HPLC). HPLC was carried out on LC2010 (Water) with VP-ODS18 Column (Shimadzu, 250 mm×4.6 mm, 5 µm particle size) at 30 °C. Elution was performed at the flow of 1.0 ml/min with mobile phase of methanol (A)-0.2% formic acid (B) solution using a gradient of 23%-31% A for 0-45 min. The injection volume was 10 μl. The detection wavelength was 330 nm. The echinacoside and isoacteoside standards were purchased from Shanghai Baoban Biotech Co., Ltd (Shanghai, China), and acteoside standard was purchased from Sigma (St. Louis, MO, USA).
Cell lines and cell culture
The mouse melanoma B16-F10 cell, mouse hepatoma H22 cell and human kidney embryonic HEK-293T were obtained from the Xinjiang Key Laboratory of Biological Resources and Genetic Engineering in Xinjiang University (Urumqi, Xinjiang, China) and cultured in DMEM medium (Gibco) supplemented with 10% heat-inactivated fetal bovine serum (Gibco), 1% L-glutamine (100mM), 100 U/ml penicillin and 100 μg/ml streptomycin at 37 °C in a humidified atmosphere of 5% CO2.
MTT Assay
Cell proliferation was evaluated by 3-(4, 5-dimethylthiazol-2-yl)-2, 5-diphenyltetrazolium bromide (MTT) (Sigma, St. Louis, MO, USA) assay. B16-F10 cells were seeded into 96-well plates at a density of 2×10⁴ cells in 100 μl medium per well and incubated at 37 °C for 24 h, followed by the treatment of CTPG at various concentrations (0, 100, 200, 300 and 400 μg/ml) and 0.3% DMSO (equal to that in 400 μg/ml CTPG) for 24, 48 and 72 h, respectively. The plates were centrifuged at 1200 rpm for 5 min and supernatant was discarded. Then 100 μl of MTT solution (0.5 mg/ml in PBS) was added to each well and incubated at 37 °C for 4 h. The formed formazan crystals were dissolved in 100 μl DMSO. The OD490 values were measured by a 96-well microplate reader (Bio-Rad Laboratories, CA, USA). The relative cell viability was calculated as the followed formula: Cell viability (%) = (ODtreated/ODuntreated) ×100%.
For the proliferation of splenocytes, cells were isolated from C57BL/6 mice and plated into 96-well plates at a density of 1.2×10⁵ cells/well in 100 μl medium. Splenocytes were treated with different concentrations of CTPG (0, 100, 200, 300 and 400 μg/ml) for 24 and 48 h. Proliferation index = ODtreated/ODuntreated.
Analysis of apoptosis and cell cycle
For apoptosis analysis, B16-F10 cells and HEK-293T cells were treated with different concentrations of CTPG (0, 100, 200, 300 and 400 μg/ml) for 48h and 0.3% DMSO. Cells were stained with Annexin V-FITC/propidiumidide (PI) Apoptosis Detection Kit (YEASEN, China) according to the manufacturer's instructions. Samples were analyzed by flow cytometry (BD FACSCalibur, USA).
For analyzing the effect of CTPG on cell cycle, B16-F10 and H22 cells were seeded in 60 mm culture dishes and treated with 200 and 400 μg/ml of CTPG or 0.3% DMSO for 24 h. All cells were harvested and washed twice with PBS. The cells were fixed in 70% ice-cold ethanol at -20 °C for 2 h and washed twice with PBS. Then, the cell pellet was re-suspended in 300 μl Propidiumiodide/RNase staining buffer (BD Biosciences) for 10 min at room temperature (RT) and analyzed by flow cytometry (BD FACSCalibur, USA). The cell cycle distribution was analyzed with the ModFit LT 3.0 software.
Hoechst 33258 staining
The morphological changes of nuclei were examined using membrane-permeable DNA-binding dye Hoechst 33258 staining. Briefly, the cells were inoculated in 6-well plate at the concentration of 1×10⁵ cells/well in 3 ml medium. After 50%~60% confluence, the cells were treated with 200 and 400 μg/ml of CTPG for 48 h. The cells were harvest and fixed with 4% ice-cold Paraformaldehyde at 4 °C for 10 min. After washing with PBS, cells were stained with Hoechst 33258 (Beyotime, China) at 4 °C for 10 min. Samples were observed by fluorescence phase-contrast microscope (Nikon Eclipse Ti-E, Japan).
Analysis of mitochondrial membrane potential and reactive oxygen species (ROS)
The B16-F10 cells were treated with different concentrations of CTPG (0, 100, 200, 300 and 400 μg/ml) for 48 h of treatment. For analysis of mitochondrial membrane potential, cells were stained by the membrane-permeable JC-1 dye (Beyotime, China) for 20 min at 37 °C. After washing twice with JC-1 buffer, samples were re-suspended with 300 μl of JC-1 buffer and analyzed by flow cytometry (BD FACSCalibur, USA). For analysis of ROS, cells were stained by 10 mM of fluorescent probe DCFH-DA (Beyotime, China) for 20 min at 37 °C, which is a specific probe for hydrogen peroxide. After washing three times with medium, samples were analyzed by flow cytometry (BD FACSCalibur, USA).
Western blot
Anti-caspase-3, anti-cleaved caspase-3, anti-caspase-8, anti-cleaved-caspase-8, anti-caspase-9, anti-cleaved-caspase-9, anti-PARP, anti-cleaved PARP, anti-mouse IgG-HRP and anti-rabbit IgG-HRP were purchased from Cell Signaling Technology. Anti-BCL-2 and anti-BAX were obtained from Beyotime Biotech Co., Ltd (Shanghai, China). Anti-β-actin was purchased from Beijing ComWin Biotech Co., Ltd (Beijing, China).
B16-F10 cells were treated with different concentrations of CTPG (0, 100, 200, 300 and 400 μg/ml) and lysed in RIPA Lysis Buffer (Beijing ComWin Biotech Co., Ltd) for 20 min on ice. After centrifugation at 14000g for 10 min at 4 °C, the supernatants were collected and protein concentration was determined by BCA Kit (Thermo Fisher Scientific, USA) according to the manufacturer's instructions. Samples were isolated by 12% SDS-PAGE and transferred to PVDF membranes. The membranes were blocked with PBST buffer (Phosphate Buffered Saline and 0.05% Tween-20) contained 5% nonfat milk for 1 h at RT, and then incubated with corresponding primary antibodies on shaker overnight at 4 °C. After washing three times with PBST, the membranes were subsequently incubated with horseradish peroxidase-conjugated secondary antibodies against mouse or rabbit for 1 h at RT. After extensive washing with PBST, the target proteins were detected using ECL assay kit (Beyotime, China).
In Vivo tumor study
B16-F10 cells in log-phase growth were re-suspended in PBS at a density of 5×10⁶/ml. 5 × 10⁵ B16-F10 cells were subcutaneously injected into the right flank of C57BL/6 mice. After 3 days, mice were randomly divided into 3 groups (12 mice/group). Control group was administered with 0.2 ml DMSO. CTPG-200 and CTPG-400 groups were subcutaneously administered with 200 or 400 mg/kg CTPG in 0.2 ml DMSO around tumor, respectively. Mice were treated every 2 days for up to 15 days. Tumor volume was measured using calipers and calculated according to the following formula: tumor volume (mm3) = (length×width2)/2. On day 31, the animals were sacrificed and spleens were isolated to analyze the percentages of CD8+ T and CD4+ T cells. Splenocytes were stained with PE-anti-CD8 and FITC-anti-CD4 antibodies (BD Biosciences) for 15 min at RT. After washing with PBS, samples were analyzed by flow cytometry (BD FACSCalibur, USA).
Statistical analysis
Statistical significance was determined by one-way analysis of variance among the treatment and control groups. All data were expressed as the mean ± standard deviation (S.D.). p<0.05 was considered statistically significant.
Results
The components of Cistanche tubulosa phenylethanoid glycosides (CTPG)
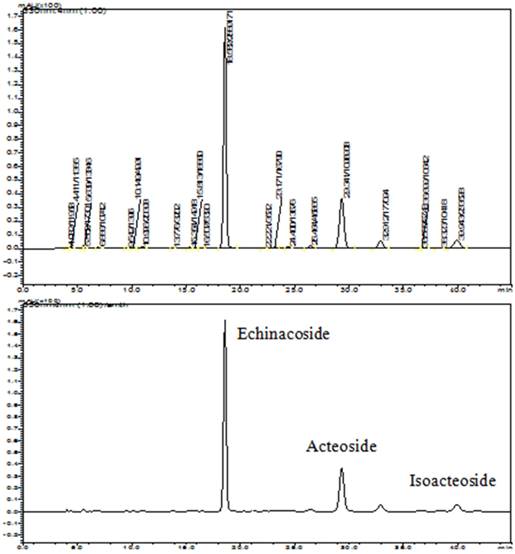
It has reported that echinacoside, acteoside and isoacteoside are the major compounds of PhGs and can be used as quality control of CTPG [19, 20]. The components of CTPG were qualified and quantified by HPLC and compared with the standards of echinacoside, acteoside and isoacteoside (Fig 1). The results showed that the concentrations of echinacoside, acteoside and isoacteoside were 266.38, 101.88 and 17.08 mg/g, respectively. The proportions of echinacoside, acteoside and isoacteoside in CTPG are 26.64%, 10.19% and 1.71%, respectively.
The qualify control of CTPG. The components of CTPG were qualitatively and quantitatively analyzed by HPLC and compared to the standards of echinacoside, acteoside and isoacteoside.
CTPG inhibits the growth of B16-F10 cells in vitro
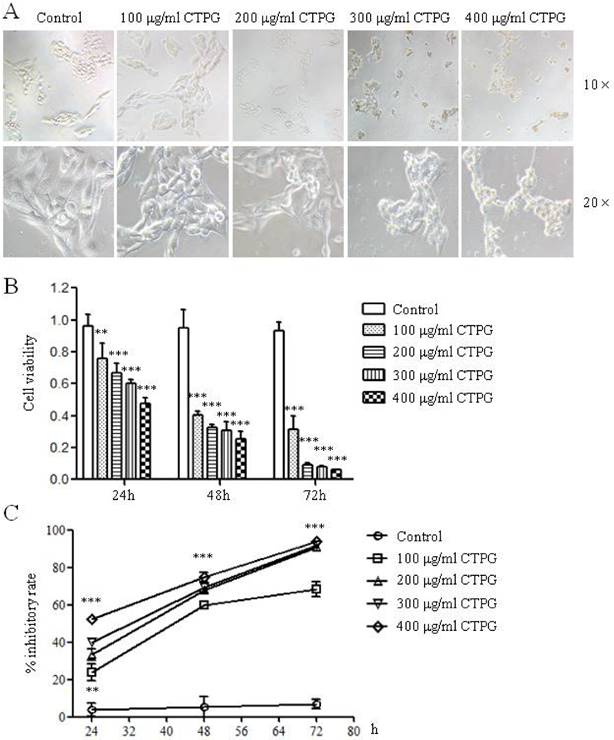
To investigate whether CTPG can inhibit the growth of B16-F10 cells, different concentrations of CTPG (100, 200, 300 and 400 μg/ml) were used to treat B16-F10 cells in vitro. After 24 h, the morphology of B16-F10 cells was observed by microscope. The morphology of B16-F10 cells was dramatically changed by the CTPG treatment in a dose-dependent manner (Fig 2A). B16-F10 cell viability was analyzed by MTT assay at 24, 48 and 72 h after CTPG treatment. CTPG treatment significantly reduced the B16-F10 cell viability in a dose-dependent and time-dependent manner (Fig 2B). The inhibition rates of B16-F10 cell growth treated with 100 μg/ml of CTPG for 48 h or 200 μg/ml of CTPG for 72 h were higher than 60% and 90%, respectively (Fig 2C). These results suggested that CTPG inhibited B16-F10 cell growth in a dose-dependent and time-dependent manner.
The inhibitory effect of CTPG on the growth of B16-F10 in vitro. (A) The morphological changes of B16-F10 cells after 24 h of CTPG treatment. The magnification folders for upper panel and lower panel are 10 and 20, respectively. (B) The cell viability and (C) inhibitory rate of B16-F10 cells. 24, 48 and 72 h after CTPG treatment, cell viability was analyzed by MTT assay and the inhibitory rate was calculated. Data are from 4 independent experiments and analyzed by one-way analysis of variance. ** p < 0.01; *** p < 0.001 compared to control.
CTPG induces apoptosis of B16-F10 cells
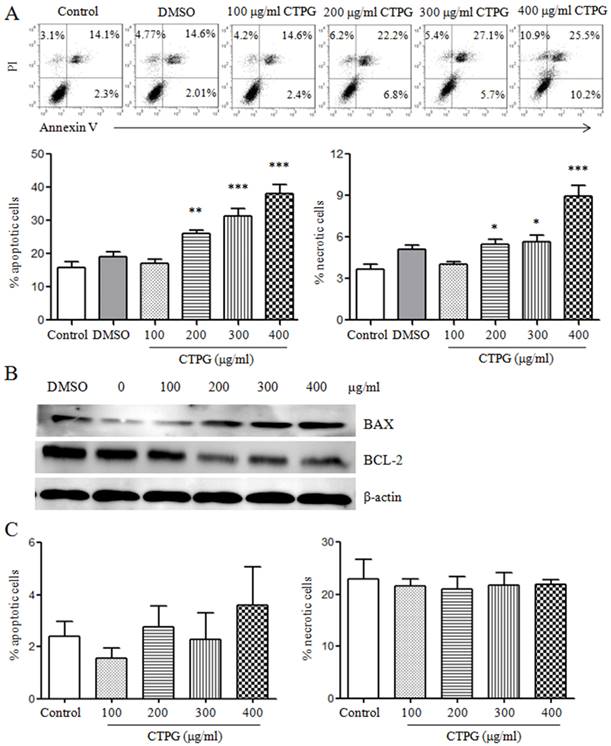
Next, we detected whether the inhibitory effect of CTPG on B16-F10 cell growth caused by the induction of apoptosis. B16-F10 cells were treated with different concentrations of CTPG (100, 200, 300 and 400 μg/ml). After 24 h, B16-F10 cells were stained with PI and Annexin V and samples were analyzed by flow cytometry (Fig 3A). The results showed that CTPG dose-dependently induced the apoptosis of B16-F10 cells. We also observed that CTPG induced the necrosis of B16-F10 cells, but the proportion of necrosis is much lower than that of apoptosis (including early and late apoptosis). We further detected the expressions of anti-apoptotic B cell lymphoma 2 (BCL-2) and pro-apoptotic BCL-2-associated X protein (BAX) by western blot. The data showed that the expressions of BAX and BCL-2 were dose-dependently increased and decreased, respectively (Fig 3B). These results suggested that CTPG induced the apoptosis of B16-F10 cells. However, CTPG did not induce the apoptosis and necrosis of 293T cells (Fig 3C).
The apoptosis of B16-F10 and 293T cells induced by CTPG treatment. Different concentrations of CTPG were used to treat B16-F10 and 293T cells for 24 h. (A) The apoptosis and necrosis of B16-F10 and 293T cells were analyzed by flow cytometry. The upper panel showed the individual dot plots and the lower panel showed the summary data. (B) After 24 h, total protein was isolated and the expressions of BAX and BCL-2 were detected by western blot. (C) The apoptosis and necrosis of 293T cells were analyzed by flow cytometry. Data are from 3 independent experiments and analyzed by one-way analysis of variance. * p < 0.05; ** p < 0.01; *** p < 0.001 compared to control.
CTPG induces chromosomal condensation and cell cycle arrest of B16-F10 cells
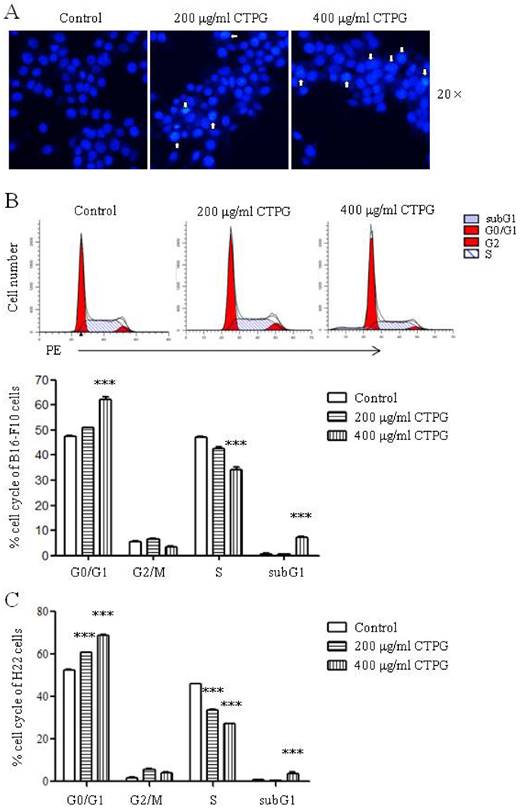
To confirm the apoptosis of B16-F10 cells induced by CTPG treatment, B16-F10 cells were treated with different concentrations of CTPG (200 and 400 μg/ml) for 24 h. B16-F10 cells were stained by Hoechst 33342 and the apoptotic nuclear morphology was observed using fluorescent microscopy. The nuclei in the control group were homogeneously stained, whereas CTPG-treated cells showed obviously morphological changes of the nuclei characterized by chromatin condensation and fragmentation (Fig 4A). We further analyzed cell cycle by flow cytometry after PI staining. CTPG treatment significantly increased the proportion of G0/G1-phase cells and significantly decreased the proportion of S-phase cells (Fig 4B), suggesting that CTPG induced G0/G1-phase arrest in B16-F10 cells. We also observed that CTPG treatment significantly increased the proportion of subG1-phase cells, which is consistent with the increased cell death. Similar results were observed in H22 cells. CTPG also induced G0/G1-phase arrest in H22 cells and significantly increased the proportion of subG1-phase cells (Fig 4C).
The chromosomal condensation and cell cycle arrest of B16-F10 and H22 cells induced by CTPG treatment. After 24 h, cells were stained with Hoechst 33342 or PI, and then the apoptotic nuclear morphology of B16-F10 cells was observed using fluorescent microscopy (A) and cell cycle distribution in B16-F10 (B) and H22 cells (C) was analyzed by flow cytometry. The arrows indicated the chromosomal condensation. Data are from 3 independent experiments and analyzed by one-way analysis of variance. *** p < 0.001 compared to control.
CTPG decreased mitochondrial membrane potential and increased intracellular ROS generation
Reduction in mitochondrial membrane potential (Δψm) induces apoptotic cell death [21]. JC-1 aggregate (red fluorescence) will disintegrate into monomer (green fluorescence) when Δψm is reducing [22]. Therefore, we detected the Δψm after CTPG treatment for 48 h by JC-1 staining. We observed that CTPG dose-dependently increased the green fluorescence detected by flow cytometry in FL-1 channel except 100 μg/ml of CTPG that decreased the green fluorescence (Fig 5A), suggesting that CTPG reduced the Δψm. This is consistent with the increased level of pro-apoptotic BAX and decreased level of anti-apoptotic BCL-2.
The reduction of Δψm and up-regulation of cytochrome c and ROS. (A) After 48 h of CTPG treatment, Δψm was detected by JC-1 staining and samples were analyzed by flow cytometry. The overlay (left panel) shows the fluorescent intensity of JC-1 in FL-1 channel. The frequency of FITC+ cells is shown in the right panel. (B) After 48 h of CTPG treatment, ROS generation was detected by fluorescent probe DCFH-DA and samples were analyzed by flow cytometry. The overlay (left panel) shows the level of ROS generation. The frequency of ROS+ cells is shown in the right panel. Data are from 3 independent experiments and analyzed by one-way analysis of variance. ** p < 0.01; *** p < 0.001 compared to control. (C) The level of cytochrome c was detected by western blot after CTPG treatment for 24 h.
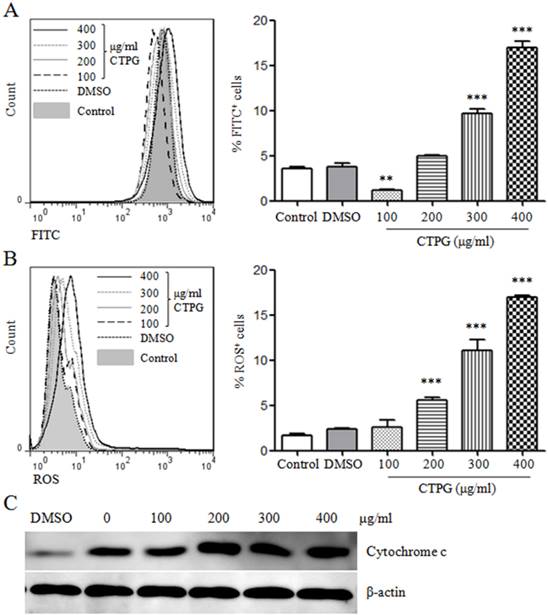
ROS generation plays a critical role in the induction of apoptosis mediated by the reduction of Δψm [23]. ROS generation was detected by fluorescent probe DCFH-DA. We found that CTPG increased ROS generation in a dose-dependent manner (Fig 5B). The disassociation of cytochrome c with oxidated cardiolipin and the reduction of Δψm facilitate the release of cytochrome c [24]. We also found that the level of cytochrome c was increased by CTPG treatment (Fig 5C). These results suggested that the apoptosis of B16-F10 cells induced by CTPG treatment might be mediated by the reduction of Δψm and generation of ROS.
CTPG up-regulated the activity of caspase-9 and -3
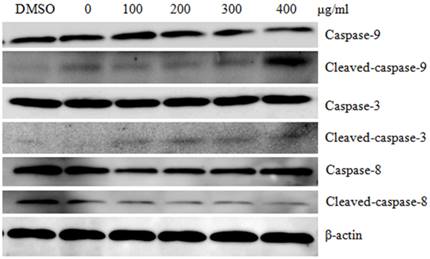
Mitochondrial membrane integrity plays critical role in the activation of the caspase proteases to induce apoptosis, which is strictly regulated by the pro- and anti-apoptotic members of the BCL-2 protein family [25, 26]. We investigated the activation of caspase-3, 8 and 9 upon CTPG treatment. We found that the levels of cleaved-caspase-9 and -3 were up-regulated by CTPG treatment in a dose-dependent manner but not for the level of cleaved-caspase-8 (Fig 6). This is consistent with the reduction of Δψm, suggesting that the apoptosis of B16-F10 cells induced by CTPG treatment might be through mitochondrial mediated caspase activation.
The levels of cleaved-caspases upon CTPG treatment. After 24 h, proteins were isolated and the levels of cleaved-caspases were detected by western blot.
CTPG suppresses the growth of melanoma in vivo
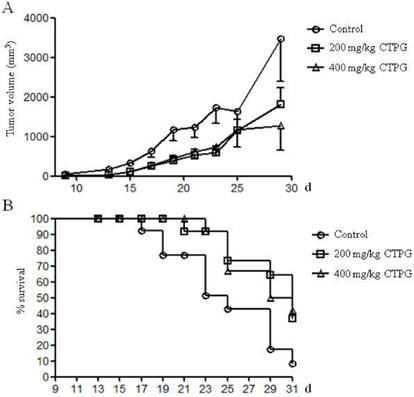
To evaluate the in vivo anti-tumor effect of CTPG, B16-F10 cells were subcutaneously injected into the right flank of C57BL/6 mice. After 3 days, mice with tumor were treated with 200 or 400 mg/kg of CTPG or DMSO as control. The growth of tumors in mice treated with 200 or 400 mg/kg of CTPG is similar but greatly suppressed compared to control group (Fig 7A). In CTPG-200 group, one mouse is accidentally dead on day 15 after B16-F10 cell injection and the tumor volume is 10.62 mm3 in this mouse. The survival rate was calculated until the end of this experiment (on day 31 after B16-F10 cell injection) (Fig 7B). Mice were sacrificed when the length of tumor is longer than 20 mm. Mice in control group were dead from day 17 and the final survival rate is 8.3% (11 of 12 mice were dead). 7 of 11 mice in CTPG-200 group were dead and the survival rate is 36.4%. 7 of 12 mice in CTPG-400 group were dead and the survival rate is 41.7%. The in vivo data suggested that CTPG suppressed the growth of tumor and increased the survival rate.
The inhibition of tumor growth in vivo. Tumor mouse model was induced by injection of B16-F10 cells. After 3 days, tumor mice (12 mice per group) were treated with or without CTPG. Tumor growth (A) and survival rate (B) were monitored at the indicated time points.
CTPG enhanced the proliferation of splenocytes and increased the frequencies of CD4+ and CD8+ T cells in spleen of mice with tumor
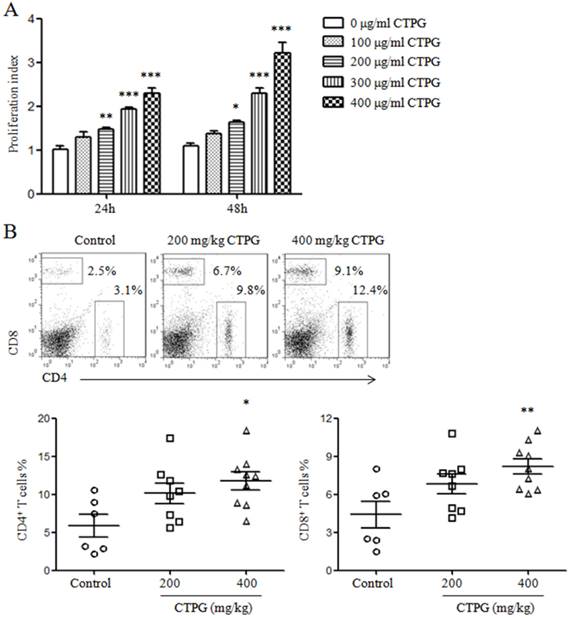
To investigate whether CTPG affect the proliferation of splenocytes in vitro, splenocytes were isolated from naïve C57BL/6 mice and treated with different concentrations of CTPG (0, 100, 200, 300 and 400 μg/ml). After 24 and 48 h, the proliferation of splenocytes was detected by MTT. CTPG dose-dependently enhanced the proliferation of splenocytes both at 24 and 48 h (Fig 8A). We further detected the frequencies of CD4+ and CD8+ T cells in spleen of mice with tumor. Spleens were collected from mice that were sacrificed due to big tumor or at the end of the experiment but not from naturally dead mice. Splenocytes were stained with FITC-anti-CD4 and PE-anti-CD8 antibodies and samples were analyzed by flow cytometry. The results showed that the frequencies of CD4+ and CD8+ T cells were significantly increased in CTPG-400 group compared to control group (Fig 8B).
The proliferation of splenocytes and the proportions of CD4+ and CD8+ T cells in spleen. (A) Splenocytes were isolated from naïve C57BL/6 mice and stimulated with different concentrations of CTPG. After 24 and 48 h, the proliferation was detected by MTT assay. (B) Splenocytes were isolated from tumor mice and stained with FITC-anti-CD4 and PE-anti-CD8. Samples were analyzed by flow cytometry. Representative dot plots (upper panel) show the gate of CD4+ and CD8+ T cells. The numbers are the frequencies of CD4+ and CD8+ T cells in spleen. The summarized data are shown in lower panel. Data are analyzed by one-way analysis of variance. * p < 0.05; ** p < 0.01; *** p < 0.001 compared to control.
Discussion
Drug-induced apoptotic cell death plays a critical role in their anti-tumor effects. In our study, we found that CTPG inhibited the growth of B16-F10 cells both in vitro and in vivo. CTPG induced the apoptosis of B16-F10 cells characterized by the chromosomal condensation, cell cycle arrest and increased Annexin-V. Apoptosis can be induced by intrinsic signaling mainly through mitochondria-dependent pathway [27, 28]. Mitochondrial membrane integrity is strictly controlled by the pro- and anti-apoptotic members of the BCL-2 protein family [25, 26]. BCL-2 prevents mitochondrial outer membrane permeabilization (MOMP) but BAX promotes MOMP [27]. We found that CTPG increased the level of BAX and decreased the level of BCL-2, which might result in the disruption of mitochondrial membrane integrity. Consistently, Δψm was reduced upon CTPG treatment. The reduction of Δψm results in the release of pro-apoptotic factors such as cytochrome c, which leads to the cleavage and activation of caspase-9. The active caspase-9 then cleaves and activates effector caspases such as caspase-3 [29]. Cytochrome c was increased upon CTPG treatment. Moreover, the levels of cleaved-caspase-9 and -caspase-3 were up-regulated. These results suggested that CTPG induced cancer cell apoptosis through mitochondrial signaling pathway.
Apoptosis can also be induced by extrinsic signaling through death receptors, which promotes the formation of the death-inducing signaling complex to cleave and activate the initiator caspase 8 [27, 28]. However, we found that the level of cleaved-caspase-8 was not increased by CTPG treatment, suggesting that apoptosis induced by CTPG is not mediated by extrinsic signaling pathway.
The reduction of Δψm could cause the excess ROS production, which resulted in the oxidation of lipids, nucleic acids, and proteins, and then further enhanced the reduction of Δψm [28]. The disassociation of cytochrome c with oxidated cardiolipin and the reduction of Δψm facilitate the release of cytochrome c [24]. CTPG treatment increased the level of ROS that might be involved in the damage of DNA and the release of cytochrome c. However, both mitochondria-dependent and -independent pathways mediated ROS generation [28]. The further study should explore the source of ROS induced by CTPG.
It has been reported that echinacoside protects human neuroblastoma cells from TNF-α-induced apoptosis, which reduced oxidative stress, maintained mitochondrial function, suppressed caspase-3 activity and increased the expression of BCL-2 [14]. Another study showed that echinacoside could attenuate mitochondrial dysfunction induced by 6-Hydroxydopamine via reduction of ROS in PC12 cells (a cell model for Parkinson's disease) [30]. Acteoside also showed anti-apoptotic effects on cerebellar granule neurons through inhibition of lactate dehydrogenase release and caspase-3 activity [13]. However, the recent study showed that echinacoside and acteoside had anti-tumor effect on mouse skin melanoma cell line KML [31], although the mechanism was not explored. Consistently, we also found that CTPG showed anti-tumor effect on mouse melanoma cell line B16-F10. These studies suggested that echinacoside and acteoside might exert different effects on tumor cells and neurocytes. Therefore, the mechanism about the contrary effects of echinacoside and acteoside on tumor cells and neurocytes needs to be further investigated.
Recently, Zhang et al. has been reported that extracts of C. deserticola can antagonize immunosenescence in senescence-accelerated mouse prone 8 (SAM-P8) mice, which increased both naïve T and natural killer cells in blood and spleen but decreased memory T cells [32]. The phenylethanoid glycosides including echinacoside and acteoside also showed immunoregulatory effects, such as anti-allergy and anti-inflammatory [12, 18, 30]. We found that CTPG enhanced the proliferation of splenocytes and increased the proportions of CD4+ and CD8+ T cells in spleens of tumor mice. These results suggested that the immunoregulatory effects of CTPG might be involved in the inhibition of tumor growth in vivo.
Although CTPG could inhibit the growth of B16-F10 cells in vivo, there is still some room to improve the anti-tumor efficacy of CTPG. In the future study, the combined strategies will be investigated, such as the combination of CTPG with chemotherapy or immune checkpoint inhibitors.
In conclusion, CTPG inhibited the growth of tumor cells both in vitro and in vivo through induction of apoptosis, which was mediated by mitochondrion-dependent signaling pathway. Moreover, CTPG showed immunoregulatory effects that might contribute the inhibition of tumor growth in vivo.
Acknowledgements
This work was supported by the Open Research Fund Program of Xinjiang Key Laboratory (2015KL001) and the Chinese National Natural Science Foundation Grant (31460241) to J.L.
Conflicts of Interest
All authors declare that they have no conflict of interests.
References
1. Ascierto PA, Grimaldi AM, Anderson AC, Bifulco C, Cochran A, Garbe C. et al. Future perspectives in melanoma research: meeting report from the "Melanoma Bridge", Napoli, December 5th-8th 2013. Journal of translational medicine. 2014;12:277
2. Sullivan RJ, Fisher DE. Understanding the biology of melanoma and therapeutic implications. Hematology/oncology clinics of North America. 2014;28:437-53
3. Luke JJ, Ott PA. PD-1 pathway inhibitors: the next generation of immunotherapy for advanced melanoma. Oncotarget. 2015;6:3479-92
4. Siegel R, Ma J, Zou Z, Jemal A. Cancer statistics, 2014. CA: a cancer journal for clinicians. 2014;64:9-29
5. Parekh HS, Liu G, Wei MQ. A new dawn for the use of traditional Chinese medicine in cancer therapy. Molecular cancer. 2009;8:21
6. Man S, Gao W, Wei C, Liu C. Anticancer drugs from traditional toxic Chinese medicines. Phytotherapy research: PTR. 2012;26:1449-65
7. Jiang Y, Tu PF. Analysis of chemical constituents in Cistanche species. Journal of chromatography A. 2009;1216:1970-9
8. Lin LW, Hsieh MT, Tsai FH, Wang WH, Wu CR. Anti-nociceptive and anti-inflammatory activity caused by Cistanche deserticola in rodents. Journal of ethnopharmacology. 2002;83:177-82
9. Li F, Yang X, Yang Y, Guo C, Zhang C, Yang Z. et al. Antiosteoporotic activity of echinacoside in ovariectomized rats. Phytomedicine: international journal of phytotherapy and phytopharmacology. 2013;20:549-57
10. Wu CR, Lin HC, Su MH. Reversal by aqueous extracts of Cistanche tubulosa from behavioral deficits in Alzheimer's disease-like rat model: relevance for amyloid deposition and central neurotransmitter function. BMC complementary and alternative medicine. 2014;14:202
11. Morikawa T, Pan Y, Ninomiya K, Imura K, Matsuda H, Yoshikawa M. et al. Acylated phenylethanoid oligoglycosides with hepatoprotective activity from the desert plant Cistanche tubulosa. Bioorganic & medicinal chemistry. 2010;18:1882-90
12. Nan ZD, Zeng KW, Shi SP, Zhao MB, Jiang Y, Tu PF. Phenylethanoid glycosides with anti-inflammatory activities from the stems of Cistanche deserticola cultured in Tarim desert. Fitoterapia. 2013;89:167-74
13. Pu X, Song Z, Li Y, Tu P, Li H. Acteoside from Cistanche salsa inhibits apoptosis by 1-methyl-4-phenylpyridinium ion in cerebellar granule neurons. Planta medica. 2003;69:65-6
14. Deng M, Zhao J, Tu P, Jiang Y, Li Z, Wang Y. Echinacoside resues the SHSY5Y neuronal cells from TNF α-induced apoptosis. Eur J Pharmacol. 2004;505:11-8
15. Jia Y, Guan Q, Guo Y, Du C. Echinacoside stimulates cell proliferation and prevents cell apoptosis in intestinal epithelial MODE-K cells by up-regulation of transforming growth factor-beta1 expression. Journal of pharmacological sciences. 2012;118:99-108
16. Li F, Yang Y, Zhu P, Chen W, Qi D, Shi X. et al. Echinacoside promotes bone regeneration by increasing OPG/RANKL ratio in MC3T3-E1 cells. Fitoterapia. 2012;83:1443-50
17. Morikawa T, Ninomiya K, Imamura M, Akaki J, Fujikura S, Pan Y. et al. Acylated phenylethanoid glycosides, echinacoside and acteoside from Cistanche tubulosa, improve glucose tolerance in mice. Journal of natural medicines. 2014;68:561-6
18. Motojima H, Villareal MO, Iijima R, Han J, Isoda H. Acteoside inhibits type Iota allergy through the down-regulation of Ca/NFAT and JNK MAPK signaling pathways in basophilic cells. Journal of natural medicines. 2013;67:790-8
19. Tu PF, Wang B, Deyama T, Zhang ZG, Lou ZC. Analysis of phenylethanoid glycoside of Herba cistanchis by RP-HPLC. Acta Pharmacologica Sinica. 1997;32:294-300
20. Jiang Y, Li SP, Wang YT, Chen XJ, Tu PF. Differentiation of Herba Cistanches by fingerprint with high-performance liquid chromatography-diode array detection-mass spectrometry. Journal of chromatography A. 2009;1216:2156-62
21. Zamzami N, Marchetti P, Castedo M, Zanin C, Vayssiere JL, Petit PX. et al. Reduction in mitochondrial potential constitutes an early irreversible step of programmed lymphocyte death in vivo. The Journal of experimental medicine. 1995;181:1661-72
22. Chong ZZ, Lin SH, Li F, Maiese K. The sirtuin inhibitor nicotinamide enhances neuronal cell survival during acute anoxic injury through AKT, BAD, PARP, and mitochondrial associated "anti-apoptotic" pathways. Current neurovascular research. 2005;2:271-85
23. Ling YH, Liebes L, Zou Y, Perez-Soler R. Reactive oxygen species generation and mitochondrial dysfunction in the apoptotic response to Bortezomib, a novel proteasome inhibitor, in human H460 non-small cell lung cancer cells. The Journal of biological chemistry. 2003;278:33714-23
24. Ott M, Robertson JD, Gogvadze V, Zhivotovsky B, Orrenius S. Cytochrome c release from mitochondria proceeds by a two-step process. Proceedings of the National Academy of Sciences of the United States of America. 2002;99:1259-63
25. Tait SW, Green DR. Mitochondria and cell death: outer membrane permeabilization and beyond. Nature reviews Molecular cell biology. 2010;11:621-32
26. Galluzzi L, Kepp O, Kroemer G. Mitochondria: master regulators of danger signalling. Nature reviews Molecular cell biology. 2012;13:780-8
27. Xu G, Shi Y. Apoptosis signaling pathways and lymphocyte homeostasis. Cell research. 2007;17:759-71
28. Sinha K, Das J, Pal PB, Sil PC. Oxidative stress: the mitochondria-dependent and mitochondria-independent pathways of apoptosis. Archives of toxicology. 2013;87:1157-80
29. Sun SY. Apoptosis induction by chemopreventive agents. Drug news & perspectives. 2001;14:75-80
30. Wang YH, Xuan ZH, Tian S, Du GH. Echinacoside Protects against 6-Hydroxydopamine-Induced Mitochondrial Dysfunction and Inflammatory Responses in PC12 Cells via Reducing ROS Production. Evidence-based complementary and alternative medicine: eCAM. 2015;2015:189239
31. Ayupbek A, Ziyavitdinov JF, Ishimov UJ, Sagdiev NZ, Kuznetsova NN, Hu KL. et al. Phenylethanoid Glycosides From Cistanche Tubulosa. Chem Nat Compd+. 2012;47:985-7
32. Zhang K, Ma X, He WJ, Li HX, Han SY, Jiang Y. et al. Extracts of Cistanche deserticola Can Antagonize Immunosenescence and Extend Life Span in Senescence-Accelerated Mouse Prone 8 (SAM-P8) Mice. Evid-Based Compl Alt. 2014
Author contact
![]() Corresponding author: E-mail: ljyxjuedu.cn (JL).
Corresponding author: E-mail: ljyxjuedu.cn (JL).