Impact Factor ISSN: 1837-9664

 Global reach, higher impact
J Cancer 2016; 7(15):2197-2206. doi:10.7150/jca.16686 This issue Cite
Research Paper
Alteration status and prognostic value of MET in head and neck squamous cell carcinoma
Yoon Ah Cho1, Eun Kyung Kim1, Su Jin Heo2, Byoung Chul Cho2, Hye Ryun Kim2, Ji Myung Chung3, Sun Och Yoon1 ![]()
1. Department of Pathology, Yonsei University College of Medicine, Seoul, Korea;
2. Yonsei Cancer Center, Division of Medical Oncology, Yonsei University College of Medicine, Seoul, Korea;
3. Yonsei University College of Medicine, Seoul, Korea.
Received 2016-7-2; Accepted 2016-9-18; Published 2016-10-25
Abstract
The MET pathway plays a key role in various cancers, and its inhibition represents a potential treatment target. However, appropriate biomarkers are needed to facilitate the selection of patients who would benefit from MET inhibiting therapy. We herein conducted a robust confirmatory evaluation of the MET copy number alteration status and prognostic significance of c-Met expression in a large series of patients (n = 396) who underwent standard surgical resection and adjuvant chemoradiotherapy for head and neck squamous cell carcinoma (HNSCC). Surgically resected HNSCC samples were subjected to immunohistochemical and H-score analysis of c-Met expression and silver in situ hybridization analysis of MET amplification and copy number gains. c-Met expression varied, with mean and median H-scores (scale: 0-300 scale) of 61.2 and 60.0, respectively. The lowest and highest expression levels were observed in SCC of the larynx and oral cavity, respectively. MET copy number gains were observed in 16.9% of cases (67/339) and were associated with c-Met protein expression. High c-Met expression, determined according to MET gain status, was associated with an inferior overall survival rate, especially among completely resected cases. In conclusion, our robust analysis revealed that c-Met expression in HNSCCs varied according to anatomical site, correlated with MET copy number gains, and was associated with poor prognosis. This c-Met expression analysis method, which is based on the MET gain status, appears to appropriately predict high-risk HNSCC patients in the context of anti-MET therapeutic decisions.
Keywords: Head and neck squamous cell carcinoma, c-Met protein, MET gene, Prognosis
Introduction
Head and neck cancers (HNCs) comprise one of the most common groups of cancers worldwide. Histologically, approximately 95% of all HNCs are head and neck squamous cell carcinoma (HNSCC) [1]; this type of tumor is characterized by frequent recurrence and metastasis, as well as resistance to the conventional cisplatin-based chemoradiotherapy. Accordingly, patients with recurrent or metastatic HNSCC have dismal outcomes [2].
The tyrosine kinase receptor c-Met normally binds with hepatocyte growth factor (HGF), which triggers its involvement in processes such as embryogenesis, cell growth, cell differentiation, and angiogenesis [3, 4]. However, c-Met activation is also involved in processes related to malignant transformation, such as tumor growth, invasion, metastasis, and angiogenesis [5-9]. In addition to paracrine or autocrine signaling via HGF, c-Met may also be activated via protein overexpression or the amplification, mutation, or transcriptional alteration (via microRNA-mediated dysregulation) of MET [10-12]. c-Met overexpression and/or MET amplification are known to correlate with a worse prognosis in some types of cancers, including non-small-cell lung cancer and gastric cancer [12]. In HNSCC, c-Met expression has been associated with cisplatin resistance and a strong metastatic ability in vivo, [2] as well as a poor patient prognosis [13].
Inhibition of the MET pathway, which plays a key role in various types of cancer, is a potential cancer treatment target. Recently, several types of inhibitors that target various components of the MET signaling pathway have been introduced [12, 14-16]. Of these, an anti-MET monoclonal antibody has yielded promising results against tumors that over express c-Met, as have small molecule inhibitors against tumors harboring MET mutation or amplification [12]. However, a biomarker that would facilitate patient selection with respect to MET inhibiting therapy is needed.
The prognostic significance of c-Met expression has not yet been confirmed in studies of MET and HNSCC [13, 17-19], possibly because of variability in detection methods and patient selection and a lack of validation of cut-off values. In addition, MET amplification and/or copy number alteration have been rarely studied in HNSCC; to date, a relatively small number of cases of recurrent/metastatic HNSCC at limited anatomical sites have been studied using immunohistochemistry and fluorescence in situ hybridization [13, 17-19]. Accordingly, in this study, we conducted a robust evaluation of c-Met expression and MET copy number alteration in a large number of patients with HNSCC at various anatomic sites of the head and neck who had undergone standard surgical resection and adjuvant chemoradiotherapy when indicated. In these patients, we analyzed the association of c-Met expression with MET copy alterations, as well as the associations of c-Met/MET abnormalities with clinical variables such as anatomical site, tumor-node-metastasis (TNM) stage, human papillomavirus (HPV) status, and survival.
Materials and methods
Patients and clinical data
This study was approved by the Institutional Review Board of Severance Hospital. Formalin-fixed, paraffin-embedded specimens were obtained from consecutive patients who underwent surgical resection with a curative aim for HNSCC at Severance Hospital, Seoul, Korea, between 2005 and 2012 and were archived. The present study excluded HNSCC tissue samples that had been subjected to decalcification for accurate immunohistochemistry and DNA in situ hybridization analyses; as a result, some cases of surgically resected hypopharyngeal/laryngeal and sinonasal SCC were excluded. The inclusion criteria were available tumor tissue, clinical data regarding smoking status, and survival data; lack of preoperative treatment; and no clinicopathologic evidence of distant metastasis at the time of surgery. Ultimately, 396 cases were selected, among which 305 achieved complete R0 resection, defined histologically as tumor-free resection margins. In the present cohort, the affected anatomic sites included the oral cavity (anterior two-thirds of the tongue, mouth floor, hard palate, buccal mucosa, oral cavity; n = 204), hypopharynx (n = 28), larynx (lingual surface of the epiglottis, glottis, supraglottis, subglottis, larynx; n = 42), and oropharynx (tonsils, base of tongue, soft palate, oropharynx; n = 122). Other evaluated parameters included tumor location and size, histologic grade, metastasis to regional lymph nodes, lymphovascular invasion, and perineural invasion.
Tumors were classified according to the Seventh American Joint Committee on Cancer (AJCC) TNM cancer classification system and the World Health Organization system [20, 21]. Two pathologists (S.O.Y. and Y.A.C.) confirmed the histopathologic diagnoses of HNSCC. Clinical data were collected from the patients' medical records and reviewed to evaluate the clinicopathologic characteristics and survival outcomes. The median follow-up period was 37.1 months (range, 0.8-99.6 months). Other clinicopathologic characteristics are described in Table 1.
Clinicopathological characteristics of 396 HNSCC patients.
| Category | Variables | No. of cases (n = 396) | Percentage (%) |
|---|---|---|---|
| Sex | Male | 298 | 75.3 |
| Female | 98 | 24.7 | |
| Age | Median (IQR), yrs | 58 (22-88) | |
| Smoking | Never smoker | 154 | 38.9 |
| Ex-smoker | 80 | 20.2 | |
| Current smoker | 162 | 40.9 | |
| Anatomical site | Oral cavity | 204 | 51.5 |
| Oropharynx | 122 | 30.8 | |
| Hypopharynx | 28 | 7.1 | |
| Larynx | 42 | 10.6 | |
| p16 IHC status | Negative | 236 | 59.6 |
| Positive | 160 | 40.4 | |
| Lymphovascular invasion | Absent | 320 | 80.8 |
| Present | 76 | 19.2 | |
| Perineural invasion | Absent | 342 | 86.4 |
| Present | 54 | 13.6 | |
| Resection margin status | R0* | 305 | 77.0 |
| Non-R0 | 91 | 23.0 | |
| Pathologic T stage | pT1-2 | 326 | 82.3 |
| pT3-4 | 70 | 17.7 | |
| Pathologic N stage | pN0-1 | 248 | 62.6 |
| pN2-3 | 148 | 37.4 | |
| Postoperative therapy | No treatment | 145 | 36.6 |
| RTx alone | 150 | 37.9 | |
| CCRT | 99 | 25.0 | |
| CTx alone or other CTx alone or incomplete CCRT | 2 | 0.5 | |
| Recurrence/metastasis | Absent | 293 | 74.0 |
| Present | 103 | 26.0 | |
| Survival | Alive | 324 | 81.8 |
| Expired | 72 | 18.2 |
HNSCC: head and neck squamous cell carcinoma; IQR: interquartile range; IHC: immunohistochemistry.
* R0 resection status was defined as complete tumor resection.
Tissue microarray preparation
Sections of formalin-fixed, paraffin-embedded tissues were prepared and stained with hematoxylin and eosin (H&E). Representative tumor areas were confirmed microscopically, selected, and used for tissue microarray (TMA) construction. Two or three different representative areas per case were selected; core tissues (3 mm in diameter) were taken from the individual tissue blocks (donor blocks) and arranged in recipient paraffin blocks (tissue array blocks) using a trephine apparatus.
Immunohistochemistry and analysis
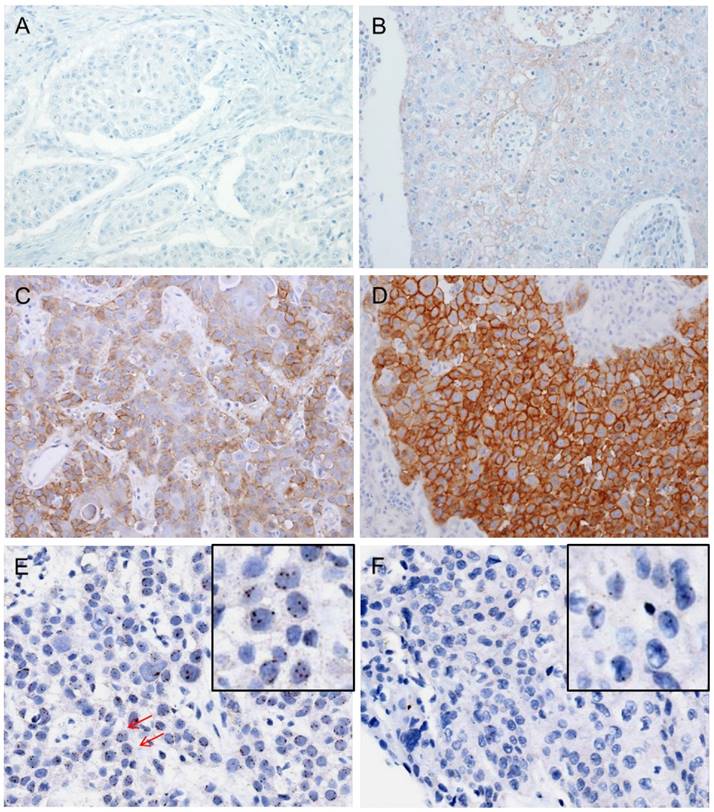
Immunohistochemistry was performed on 4-μm TMA tissue sections with a Ventana Bench Mark XT Autostainer (Ventana Medical Systems, Tucson, AZ, USA) as described in previous reports [22]. The following primary antibodies were tested: c-Met (pre-dilution; clone SP44; Ventana) and p16 (RTU; Ventana). c-Met protein expression was analyzed according to the semiquantitative H-score method; this method yields a total score range of 0-300 [23] by multiplying the dominant nuclear staining intensity score (0, no staining; 1, weak or barely detectable membranous staining; 2, distinct brown membranous staining; 3, strong dark brown membranous staining) by the percentage (0-100%) of positive cell nuclei (Figs. 1A-D). Conventionally accepted criteria were used for p16 immunohistochemistry, and positivity was defined as the presence of strong and diffuse nuclear and cytoplasmic staining in >70% of the HNSCC cells. All other staining patterns were scored as negative [24].
Immunohistochemical analysis of c-MET protein expression and silver in-situ hybridization (SISH) to determine MET copy number alterations. Representative images of immunohistochemical staining for c-Met demonstrate negative staining (intensity score 0, A), weak or barely detectable membranous staining (intensity score 1, B), distinct brown membranous staining (intensity score 2, C), and strong dark brown membranous staining (intensity score 3, D). Each intensity score was multiplied by the percentage of positive nuclear cell staining (0-100%) to calculate the H-score (possible scores: 0-300). In a SISH dataset, the black signals indicate MET copies and red signals indicate CEP7. The representative case harbored 3-4 MET signals per nucleus in ≥20% of counted tumor cells, indicating a MET copy number gain. Arrows point to cells that show 4 MET signals in the nucleus (E). Another representative case exhibits normal disomy of the MET and CEP7 signals (F). Selective magnification of cells is shown inside the black box (E and F).
Dual-color silver in situ hybridization and interpretation (SISH)
Dual-color SISH was performed on a Ventana BenchMark XT apparatus (Ventana Medical Systems) using the MET DNA (Roche-Ventana) and Chromosome 7 enumeration (CEP7) probes (Roche-Ventana). Signals were enumerated in 100 tumor cells with intact, non-overlapping nuclei per core under a light microscope with a magnification of 600X. Tumor nuclei with clearly distinct color signals for MET (black signal) and CEP7 (red signal) were evaluated (Figs. 1 E-H). If clusters of dots representing many copies of MET gene were noted, small and large clusters of multiple signals were counted as 6 and 12 signals, respectively, according to the interpretive guide provided for INFORM HER2 DNA probe staining of breast carcinoma (Ventana Medical Systems). MET SISH results were interpreted by two experienced evaluators (S.O.Y. and Y.A.C.) blinded to the clinical data.
To define MET copy number gain or amplification, several criteria were considered with reference to previous fluorescence in situ hybridization-based studies of tyrosine kinase receptor genes, including the University of Colorado Cancer Center (UCCC) criteria for the epidermal growth factor receptor gene [25] and criteria for the fibroblast growth factor receptor gene in HNSCC [26] and MET in several tumor types [18, 19, 27-29]. To address tyrosine kinase receptor gene heterogeneity in tumors [30], the proportion of tumor cells harboring copy number alterations was also considered. Previous studies that used the SISH method to detect MET copy number changes in several types of cancer (e.g., colorectal, gastric, non-small-cell lung, HNSCC) used different criteria for MET amplification, high MET copy numbers, and copy number gains. For example, MET amplification/copy number gain/polysomy was defined as a copy number ≥4 or ≥5, and the proportion of tumor cells (10%, 40%, or 90%, according to polysomy status) exhibiting copy number alterations was also considered in some definitions of MET gene amplification/copy number gain/polysomy [19, 31-33].
In our study, we used the following definitions of MET copy number gain and amplification: 2-4 MET signals per nucleus in ≥20% of tumor cells, and ≥5 MET signals per nucleus in ≥20% of tumor cells, respectively.
In all 396 cases, immunohistochemistry (IHC) and SISH were performed. Although c-Met IHC was available for all cases, we were not able to properly evaluate several SISH cores due to either disruption of cores or inadequate hybridization. Therefore, after excluding these cases (n=59), only 339 cases of SISH were analyzed properly.
Statistical analysis
The Mann-Whitney (MW) U test, Kruskal-Wallis (KW) test, one-way analysis of variance (ANOVA), two-sample t test,  2 test, and Pearson's or Spearman's correlation test were used to analyze differences between the evaluated variables. Overall survival was measured from the date of initial diagnosis to that of death or the last follow-up visit. Progression-free survival was measured from the date of initial diagnosis to that of disease progression, defined as cancer recurrence, continuance of stable disease/partial remission/progressive disease without complete remission, or cancer-related death during the study period. The Kaplan-Meier method was used to analyze survival rates, and differences were compared using the log-rank test. The Cox proportional hazards model was implemented for a multivariate analysis. Two-sided P-values <0.05 were considered statistically significant. Statistical analyses were conducted using IBM SPSS 22 software for Windows (IBM Corp, Armonk, NY, USA).
Results
Expression of c-Met protein in HNSCC
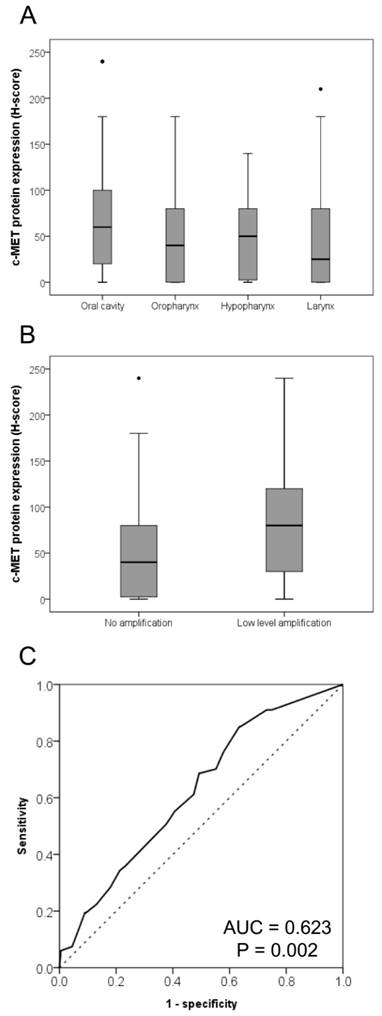
Overall, c-Met protein expression varied among HNSCC cases, with H-scores ranging from 0-240 (mean and median H-scores: 61.2 and 60.0, respectively). Regarding anatomical sites, the lowest and highest expression levels were observed in laryngeal SCC and SCC of the oral cavity, respectively; oropharyngeal and hypopharyngeal SCCs exhibited intermediate levels of expression (P = 0.003; Fig. 2A). Other clinicopathologic variables such as age, sex, smoking, lymphovascular invasion, perineural invasion, pT stage, and pN stage did not differ significantly with respect to c-Met expression level.
Relationships of c-Met expression with affected anatomic site and MET copy number. The c-MET expression levels were lowest and highest in laryngeal squamous cell carcinoma (SCC) and SCC of the oral cavity, respectively (A). Intermediate c-Met levels were observed in oropharyngeal and hypopharyngeal SCC (P = 0.003). The c-MET protein expression level was higher in cases exhibiting MET copy number gains than in those without MET gains (B, P = 0.002). A receiver operating characteristic curve analysis based on the MET copy number gain was conducted to determine the c-Met protein expression cut-off value (C).
MET copy number variation in HNSCC
The median MET copy number per case was 2 (range, 1-7), and the median MET/CEP7 per case was 1.05 (range, 1.00-1.76). Using our above-defined criteria for MET copy number gain and amplification, 16.9% (67/335) of the cases harbored copy number gain, whereas none harbored amplification (Table 2).
MET gene copy number variation of HNSCC.
| Category | Definition | No. of cases | Percentage (%) |
|---|---|---|---|
| Negative | Disomy | 268 | 67.7 |
| Copy number gain | 2 < MET signals < 5 per nucleus in 20% or more of tumor cells | 67 | 16.9 |
| Amplification | MET signals ≥ 5 per nucleus in 20% or more of tumor cells | 0 | 0 |
Relationship between c-Met protein expression and MET copy number variation
Cases harboring copy number gains had significantly higher c-Met protein expression levels than did cases without copy number gains (Fig. 2B; P = 0.001). According to a receiver operating characteristic curve analysis of MET copy number gain, an H-score of 65, which was higher than the above-mentioned mean and median c-Met expression H-score scores for overall HNSCC cases, was identified as the cut-off value for high c-Met protein expression (Fig. 2C). Using this cut-off value, 41.9% (166/396) of HNSCC cases exhibited high c-Met expression.
Associations of a high c-Met protein expression level and MET copy number gain with clinicopathologic variables
Among the overall cohort of HNSCC cases, a high c-Met protein expression was not found to associate significantly with clinicopathologic variables such as age, sex, smoking, anatomic site, HPV (p16 immunohistochemistry) status, lymphovascular invasion, perineural invasion, pT category, or pN category. No other significant associations were observed between MET copy number gain and other clinicopathologic variables (Table 3).
Clinicopathologic characteristics of HNSCC according to the c-MET protein expression and MET gene CN gain status.
| Category | Variables | No. of cases (n = 396) | c-MET protein | No. of cases (n = 335) | MET copy number variation | ||||
|---|---|---|---|---|---|---|---|---|---|
| Low (%) | High (%) | P-value | No gain (%) | CN gain (%) | P-value | ||||
| (n = 230) | (n = 166) | (n = 268) | (n = 67) | ||||||
| Sex | Male | 298 | 180 (78.3) | 118 (71.1) | 0.102 | 80 | 65 (24.3) | 15 (22.4) | 0.749 |
| Female | 98 | 50 (21.7) | 48 (28.9) | 255 | 203 (75.7) | 52 (77.6) | |||
| Age (yrs) | < 58 | 194 | 111 (48.3) | 83 (50.0) | 0.733 | 167 | 129 (48.1) | 38 (56.7) | 0.209 |
| ≥ 58 | 202 | 119 (51.7) | 83 (50.0) | 168 | 139 (51.9) | 29 (43.3) | |||
| Smoking | Never smoker | 154 | 88 (38.3) | 66 (39.8) | 0.924 | 128 | 106 (39.6) | 22 (32.8) | 0.161 |
| Ex-smoker | 80 | 46 (20.0) | 34 (20.5) | 66 | 56 (20.9) | 10 (14.9) | |||
| Current smoker | 162 | 96 (41.7) | 66 (39.8) | 141 | 106 (39.6) | 35 (52.2) | |||
| Anatomical sites | Oral cavity | 204 | 110 (47.8) | 94 (56.6) | 0.305 | 168 | 129 (48.1) | 39 (58.2) | 0.164 |
| Oropharynx | 122 | 76 (33.0) | 46 (27.7) | 109 | 94 (35.1) | 15 (22.4) | |||
| Hypopharynx | 28 | 16 (7.0) | 12 (7.2) | 24 | 17 (6.3) | 7 (10.4) | |||
| Larynx | 42 | 28 (12.2) | 14 (8.4) | 34 | 28 (10.4) | 6 (9.0) | |||
| p16 IHC status | Negative | 236 | 134 (58.3) | 102 (61.4) | 0.524 | 190 | 149 (55.6) | 41 (61.2) | 0.408 |
| Positive | 160 | 96 (41.7) | 64 (38.6) | 145 | 119 (44.4) | 26 (38.8) | |||
| Lymphovascular invasion | Negative | 320 | 182 (79.1) | 138 (83.1) | 0.318 | 267 | 208 (77.6) | 59 (88.1) | 0.057 |
| Positive | 76 | 48 (20.9) | 28 (16.9) | 68 | 60 (22.4) | 8 (11.9) | |||
| Perineural invasion | Negative | 342 | 202 (87.8) | 140 (84.3) | 0.318 | 285 | 226 (84.3) | 59 (88.1) | 0.443 |
| Positive | 54 | 28 (12.2) | 26 (15.7) | 50 | 42 (15.7) | 8 (11.9) | |||
| Resection margin status | R0* | 305 | 175 (76.1) | 130 (78.3) | 0.630 | 255 | 202 (75.4) | 53 (79.1) | 0.522 |
| Non-R0 | 91 | 55 (23.9) | 36 (21.7) | 80 | 66 (24.6) | 14 (20.9) | |||
| Pathologic T stage | pT1-2 | 326 | 188 (81.7) | 138 (83.1) | 0.720 | 273 | 218 (81.3) | 55 (82.1) | 0.888 |
| pT3-4 | 70 | 42 (18.3) | 28 (16.9) | 62 | 50 (18.7) | 12 (17.9) | |||
| Pathologic N stage | pN0-1 | 248 | 144 (62.6) | 104 (62.7) | 0.993 | 204 | 156 (58.2) | 48 (71.6) | 0.044 |
| pN2-3 | 148 | 86 (37.4) | 62 (37.3) | 131 | 112 (41.8) | 19 (28.4) | |||
HNSCC: head and neck squamous cell carcinoma; CN: copy number; IHC: immunohistochemistry
* R0 resection status was defined as complete tumor resection
Associations of a high c-Met protein expression level and MET copy number gain with patient survival
In the overall cohort, high c-Met protein expression tended to associate with inferior overall survival with marginal significance (P = 0.071; Fig. 3A; supplementary Table 1). However, MET copy number gain was not related to overall survival (supplementary Table 1). Furthermore, neither c-Met protein expression nor MET copy number gain associated significantly with progression-free survival (supplementary Table 2). Other clinicopathologic variables, particularly age, anatomical site, p16 expression, pT category, and pN category, were found to associate significantly with both overall and progression-free survival (supplementary Tables 1 and 2).
Kaplan-Meier analysis of overall survival according to c-Met expression status. In the overall cohort of head and neck squamous cell carcinoma (HNSCC) cases, a high c-Met protein expression level tended to correlate with inferior overall survival in a marginally significant relationship (A). Among HNSCC cases that achieved complete (R0) resection, a high c-MET protein expression level correlated significantly with inferior overall survival (B).
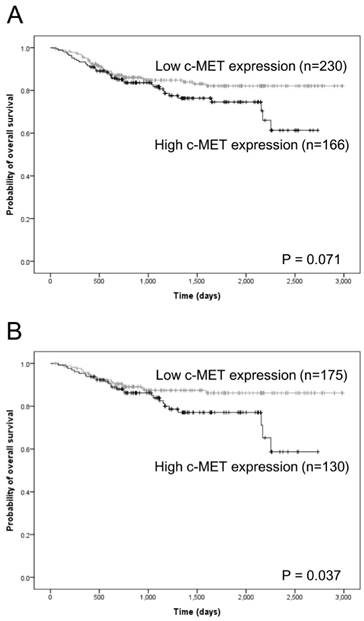
Among the 305 cases in which complete tumor resection (R0 resection) was achieved, high c-Met expression was significantly related to inferior overall survival (P = 0.037; Fig. 3B and Table 4). In a multivariate Cox proportional hazards analysis, high c-Met expression tended to correlate independently with inferior OS, albeit with marginal significance (P = 0.061; Table 4). However, no significant association was observed between high c-Met expression and progression-free survival (Table 5). In addition, MET copy number gain did not associate significantly with overall or progression-free survival among cases involving R0 resection (Table 4 and 5). In this subgroup, other clinicopathologic variables, particularly anatomical site, pT category, and pN category, associated significantly with overall survival and progression-free survival (Table 4 and 5).
Cox analysis for overall survival among complete tumor resection (R0 resection; n=305).
| Category | Variables | Univariate | Multivariate | ||
|---|---|---|---|---|---|
| HR (95% CI) | P-value | HR (95% CI) | P-value | ||
| Sex | Female | 1 | N/A | ||
| Male | 1.242 (0.681-2.265) | 0.480 | N/A | ||
| Age (years) | < 58 | 1 | 1 | ||
| ≥ 58 | 1.881 (1.048-3.493) | 0.034 | 1.752 (0.953-3.220) | 0.071 | |
| Location | Oropharynx | 1 | 1 | ||
| Oral cavity | 2.654 (1.118-6.302) | 0.027 | 3.570 (1.436-8.871) | 0.006 | |
| Hypopharynx | 3.225 (0.806-12.9) | 0.098 | 2.377 (0.587-9.623) | 0.225 | |
| Larynx | 1.830 (0.457-7.319) | 0.393 | 2.526 (0.613-10.418) | 0.200 | |
| Smoking | Never smoker | 1 | N/A | ||
| Ex-smoker | 0.621 (0.250-1.538) | 0.303 | N/A | ||
| Current smoker | 1.157 (0.631-2.120) | 0.637 | N/A | ||
| p16 IHC status | 1 | N/A | |||
| 1.457 (0.782-2.717) | 0.236 | N/A | |||
| Lymphovascular invasion | Absent | 1 | N/A | ||
| Present | 1.795 (0.913-3.528) | 0.090 | N/A | ||
| Perineural invasion | Absent | 1 | N/A | ||
| Present | 1.877 (0.907-3.882) | 0.090 | N/A | ||
| Pathologic T stage | pT1-2 | 1 | 1 | ||
| pT3-4 | 4.089 (2.240-7.464) | < 0.001 | 2.714 (1.413-5.214) | 0.003 | |
| Pathologic N stage | pN0-1 | 1 | 1 | ||
| pN2-3 | 2.198 (1.248-3.872) | 0.006 | 2.263 (1.187-4.315) | 0.013 | |
| c-MET expression | Low | 1 | 1 | ||
| High | 1.838 (1.037-3.259) | 0.037 | 1.742 (0.975-3.112) | 0.061 | |
| MET CN gain | No gain | 1 | N/A | ||
| Gain | 0.577 (0.244-1.366) | 0.211 | N/A | ||
HNSCC: head and neck squamous cell carcinoma; CN: copy number; IHC: immunohistochemistry.
Cox analysis for progression-free survival among complete tumor resection (R0 resection; n=305).
| Category | Variables | Univariate | Multivariate | ||
|---|---|---|---|---|---|
| HR (95% CI) | P-value | HR (95% CI) | P-value | ||
| Sex | Female | 1 | N/A | ||
| Male | 1.007 (1.107-1.671) | 0.977 | N/A | ||
| Age (years) | < 58 | 1 | 1 | ||
| ≥ 58 | 1.767 (1.048-2.819) | 0.017 | 1.635 (0.998-2.679) | 0.051 | |
| Location | Oropharynx | 1 | 1 | ||
| Oral cavity | 2.159 (1.126-4.140) | 0.020 | 2.386 (1.100-5.176) | 0.028 | |
| Hypopharynx | 3.270 (1.135-9.416) | 0.028 | 2.352 (0.755-7.328) | 0.140 | |
| Larynx | 1.976 (0.730-5.347) | 0.180 | 1.876 (0.620-5.679) | 0.265 | |
| Smoking | Never smoker | 1 | N/A | ||
| Ex-smoker | 0.879 (0.436-1.774) | 0.720 | N/A | ||
| Current smoker | 1.563 (0.948-2.577) | 0.080 | N/A | ||
| p16 IHC status | 1 | 1 | |||
| 1.812 (1.075-3.053) | 0.026 | 0.635 (0.353-1.140) | 0.128 | ||
| Lymphovascular invasion | Absent | 1 | 1 | ||
| Present | 1.885 (1.094-3.249) | 0.022 | 1.811 (0.998-3.286) | 0.051 | |
| Perineural invasion | Absent | 1 | 1 | ||
| Present | 2.060 (1.168-3.634) | 0.013 | 1.219 (0.639-2.323) | 0.548 | |
| Pathologic T stage | pT1-2 | 1 | 1 | ||
| pT3-4 | 3.328 (2.003-5.529) | < 0.001 | 2.290 (1.307-4.014) | 0.004 | |
| Pathologic N stage | pN0-1 | 1 | 1 | ||
| pN2-3 | 1.969 (1.247-3.110) | 0.004 | 1.842 (1.055-3.215) | 0.032 | |
| c-MET expression | Low | 1 | N/A | ||
| High | 1.186 (0.750-1.874) | 0.466 | N/A | ||
| MET CN gain | No gain | 1 | N/A | ||
| Gain | 0.494 (0.235-1.037) | 0.062 | N/A | ||
HNSCC: head and neck squamous cell carcinoma; CN: copy number; IHC: immunohistochemistry.
Discussion
Although several studies have evaluated c-Met expression levels and MET amplification/copy number alteration in several types of cancer, none have determined cut-off values for these parameters with regard to prognostic importance or patient selection for MET inhibitor therapy [13, 17-19, 31-36]. In this study, we aimed to investigate changes in statuses of c-Met protein expression and MET copy number, to analyze the association between these factors, and to determine the prognostic value of both factors in patients with HNSCC.
Previous studies of c-Met expression and MET copy number alteration in HNSCC have been restricted to specific anatomic sites or stage, or have included relatively small numbers of cases; in addition, the studies were heterogeneous with respect to detection method or treatment modality [13, 17-19]. These differences might explain the lack of confirmation for the prognostic significance of c-Met expression or MET copy alteration or cut-off values for these factors. In addition, MET amplification or copy number alteration has been rarely studied in HNSCC, particularly in cohorts composed primarily of patients treated with radical surgery. In contrast, the current study presents a robust evaluation of c-Met expression and MET copy number alterations in a large number of HNSCC cases that occurred in various anatomic sites of the head and neck; in addition, all involved patients underwent surgical resection with a curative aim and standard adjuvant chemoradiotherapy according to indicated treatment protocols.
In the present cohort of HNSCC cases, overall c-Met protein expression was variable, with an average H-score of approximately 60 (scale: 0-300). The c-Met expression level differed according to anatomical site, with lower and higher levels observed in laryngeal SCC and SCC of the oral cavity, respectively, and intermediate levels in oropharyngeal and hypopharyngeal SCC. These findings agree with a previous study in which high c-Met expression was relatively more frequent in the oral cavity and less frequent in the larynx [18], although the previous study involved a relatively smaller cohort and somewhat different detection criteria. Although little is known about other comparative analyses of c-Met expression according to anatomical site, it appears that SCC of the oral cavity might be associated with high c-Met expression more strongly than HNSCCs at other anatomical sites.
Differences in tumor microenvironment, according to various anatomical sites of HNSCC, might be related to different expression levels of c-Met. Active immune responses against foreign bodies occur in the oral cavity, while HPV infection is predominantly found in oropharyngeal areas. This might suggest a difference in immune responses according to anatomical site, which may be associated with differential c-Met expression. Hepatocyte growth factor (HGF), a ligand of Met, plays a significant role in immune surveillance in HNSCC [37]. In addition to tumor microenvironment, tumor-intrinsic factors, such as invasion, metastasis, and cancer stem cell-like phenotype, may also contribute to differences in c-Met expression. Several studies have shown that HGF/Met signaling is involved in tumor invasion, migration, and metastasis, as well as cancer stem cell-like properties [37]. Therefore, anatomical sites of HNSCC should be considered when choosing candidates in c-Met-associated clinical trials. Further study is needed to identify potential mechanisms of variances in c-Met expression at different anatomical sites.
Regarding MET alteration, a copy number gain was observed in 20.0% (67/335) of the tested cases in the present study. A majority (80.0% of tested cases, 268/335) of the remaining HNSCC cases exhibited normal disomy of MET and chromosome 7. In addition, no MET amplification was observed in the present study. In previous studies, high-level or focal MET amplification (clustered MET signals) has been reported as a rare event in HNSCC, as well as in other type of cancers (e.g., non-small-cell lung cancer or gastric cancer), with rates ranging 1-8%, despite considerable differences among studies in the detection methods and criteria used to define high copy number [19, 32, 33, 36]. Although MET amplification may be rare, MET copy number gain may not be an uncommon event in HNSCC.
HNSCC cases harboring a MET copy number gain had significantly higher c-Met protein expression levels than did cases with a normal MET status, suggesting a potential association between a MET gain and c-Met protein overexpression. This corroborates earlier studies that reported positive correlations of c-Met expression (via immunohistochemistry) with MET copy number gain or amplification (via fluorescence in situ hybridization) [32, 33]. To further explore this result, a c-Met expression cut-off value of an H-score of 65, was determined based on the MET gain status. As noted previously, this value was slightly higher than the mean and median c-Met expression levels among all tested HNSCC cases, which would generally be used as a cut-off value with which to determine a high value for a quantitative variable.
High c-Met expression, determined through a MET gain-based analysis, was significantly related to a poor overall survival rate and tended to be independently related to poor overall survival among cases with R0 resection. In other words, a high tumor c-Met expression level might be associated with high-risk HNSCC even after complete tumor removal. According to the findings of the present study, the devised method for determining high c-Met expression according to a MET gain-based analysis appears to be reliable and appropriate for the prediction of patients with high-risk HNSCC.
Recent studies of potential biomarkers to identify patients who would benefit from MET pathway inhibitors suggest a 50% cut-off for c-Met expression. In other words, ≥50% of tumor cells would exhibit moderate (2+) to strong (3+) intensity in a c-Met immunohistochemistry analysis (i.e., H score ≥100) or 1+ or stronger staining (i.e., H score ≥50). Although those trials have focused on non-small-cell lung cancer and gastric or esophagogastric junction adenocarcinoma [34-36], the c-Met expression cutoff value determined in the present study could be considered when developing biomarkers to select patients with HNSCC who would benefit from MET inhibitor therapy.
A MET gain or increased copy number did not directly associate with the survival prognoses of HNSCC patients in the present study. As in previous studies, the prognostic role of a MET gain has not yet been confirmed in HNSCC [19], although other studies have identified a relationship between a MET gain and poor prognosis in patients with lung, gastric, or nasopharyngeal carcinoma [27-29, 32]. Regardless of differences in the detection methods, interpretation criteria, and tumor types between the present study and previous studies, a MET gain itself did not seem to affect patient prognosis among patients with HNSCC who underwent curative surgical resection.
In summary, SCC of the oral cavity was associated with higher c-Met protein expression when compared with HNSCCs of other anatomical sites, and the c-Met protein expression level was associated with a MET gain. Furthermore, a high c-Met expression level, determined according to the MET gain status, was found to correlate with inferior overall survival, especially in patients who had achieved complete resection of HNSCC. The method described herein for determining high c-Met expression based on MET gains seemed to be reliable and appropriate for predicting patients with high-risk HNSCC and could facilitate the selection of patients who would benefit from MET inhibitor therapy.
Supplementary Material
Supplementary tables.
Acknowledgements
The study was supported by the Basic Science Research Program through the National Research Foundation of Korea (NRF), funded by the Ministry of Education (NRF-2015R1D1A1A09059399).
Competing Interests
The authors have declared that no competing interest exists.
References
1. Chaturvedi AK, Anderson WF, Lortet-Tieulent J, Curado MP, Ferlay J, Franceschi S. et al. Worldwide trends in incidence rates for oral cavity and oropharyngeal cancers. Journal of clinical oncology: official journal of the American Society of Clinical Oncology. 2013;31:4550-9
2. Sun S, Wang Z. Head neck squamous cell carcinoma c-Met(+) cells display cancer stem cell properties and are responsible for cisplatin-resistance and metastasis. Int J Cancer. 2011;129:2337-48
3. Joffre C, Barrow R, Menard L, Calleja V, Hart IR, Kermorgant S. A direct role for Met endocytosis in tumorigenesis. Nat Cell Biol. 2011;13:827-37
4. Maina F, Pante G, Helmbacher F, Andres R, Porthin A, Davies AM. et al. Coupling Met to specific pathways results in distinct developmental outcomes. Mol Cell. 2001;7:1293-306
5. Gentile A, Trusolino L, Comoglio PM. The Met tyrosine kinase receptor in development and cancer. Cancer Metastasis Rev. 2008;27:85-94
6. Chu SH, Feng DF, Zhang H, Chen ET, Duan ZX, Li XY. et al. c-Met-targeted RNA interference inhibits growth and metastasis of glioma U251 cells in vitro. J Neurooncol. 2009;93:183-9
7. Merlin S, Pietronave S, Locarno D, Valente G, Follenzi A, Prat M. Deletion of the ectodomain unleashes the transforming, invasive, and tumorigenic potential of the MET oncogene. Cancer Sci. 2009;100:633-8
8. Birchmeier C, Birchmeier W, Gherardi E, Vande Woude GF. Met, metastasis, motility and more. Nat Rev Mol Cell Biol. 2003;4:915-25
9. You WK, McDonald DM. The hepatocyte growth factor/c-Met signaling pathway as a therapeutic target to inhibit angiogenesis. BMB Rep. 2008;41:833-9
10. Kentsis A, Reed C, Rice KL, Sanda T, Rodig SJ, Tholouli E. et al. Autocrine activation of the MET receptor tyrosine kinase in acute myeloid leukemia. Nat Med. 2012;18:1118-22
11. Graziano F, Galluccio N, Lorenzini P, Ruzzo A, Canestrari E, D'Emidio S. et al. Genetic activation of the MET pathway and prognosis of patients with high-risk, radically resected gastric cancer. Journal of clinical oncology: official journal of the American Society of Clinical Oncology. 2011;29:4789-95
12. Peters S, Adjei AA. MET: a promising anticancer therapeutic target. Nat Rev Clin Oncol. 2012;9:314-26
13. Lo Muzio L, Farina A, Rubini C, Coccia E, Capogreco M, Colella G. et al. Effect of c-Met expression on survival in head and neck squamous cell carcinoma. Tumour biology: the journal of the International Society for Oncodevelopmental Biology and Medicine. 2006;27:115-21
14. Comoglio PM, Giordano S, Trusolino L. Drug development of MET inhibitors: targeting oncogene addiction and expedience. Nat Rev Drug Discov. 2008;7:504-16
15. Blumenschein GR Jr, Mills GB, Gonzalez-Angulo AM. Targeting the hepatocyte growth factor-cMET axis in cancer therapy. Journal of clinical oncology: official journal of the American Society of Clinical Oncology. 2012;30:3287-96
16. Appleman LJ. MET signaling pathway: a rational target for cancer therapy. Journal of clinical oncology: official journal of the American Society of Clinical Oncology. 2011;29:4837-8
17. Freudlsperger C, Alexander D, Reinert S, Hoffmann J. Prognostic value of c-Met expression in oral squamous cell carcinoma. Exp Ther Med. 2010;1:69-72
18. Choe JY, Yun JY, Nam SJ, Kim JE. Expression of c-Met Is Different along the Location and Associated with Lymph Node Metastasis of Head and Neck Carcinoma. Korean journal of pathology. 2012;46:515-22
19. Kwon MJ, Kim DH, Park HR, Shin HS, Kwon JH, Lee DJ. et al. Frequent hepatocyte growth factor overexpression and low frequency of c-Met gene amplification in human papillomavirus-negative tonsillar squamous cell carcinoma and their prognostic significances. Human pathology. 2014;45:1327-38
20. Edge SB, American Joint Committee on Cancer. AJCC cancer staging manual. 7th ed. New York; London: Springer. 2010
21. Barnes L, International Academy of Pathology, World Health Organization, International Agency for Research on Cancer. Pathology and genetics of head and neck tumours. Lyon: IARC Press. 2005
22. Yun S, Koh JM, Lee KS, Seo AN, Nam KH, Choe G. Expression of c-MET in Invasive Meningioma. Journal of pathology and translational medicine. 2015;49:44-51
23. Park E, Park SY, Kim H, Sun PL, Jin Y, Cho SK. et al. Membranous Insulin-like Growth Factor-1 Receptor (IGF1R) Expression Is Predictive of Poor Prognosis in Patients with Epidermal Growth Factor Receptor (EGFR)-Mutant Lung Adenocarcinoma. Journal of pathology and translational medicine. 2015;49:382-8
24. Ang KK, Harris J, Wheeler R, Weber R, Rosenthal DI, Nguyen-Tan PF. et al. Human papillomavirus and survival of patients with oropharyngeal cancer. The New England journal of medicine. 2010;363:24-35
25. Cappuzzo F, Hirsch FR, Rossi E, Bartolini S, Ceresoli GL, Bemis L. et al. Epidermal growth factor receptor gene and protein and gefitinib sensitivity in non-small-cell lung cancer. Journal of the National Cancer Institute. 2005;97:643-55
26. Goke F, Bode M, Franzen A, Kirsten R, Goltz D, Goke A. et al. Fibroblast growth factor receptor 1 amplification is a common event in squamous cell carcinoma of the head and neck. Modern pathology: an official journal of the United States and Canadian Academy of Pathology, Inc. 2013;26:1298-306
27. Cappuzzo F, Marchetti A, Skokan M, Rossi E, Gajapathy S, Felicioni L. et al. Increased MET gene copy number negatively affects survival of surgically resected non-small-cell lung cancer patients. Journal of clinical oncology: official journal of the American Society of Clinical Oncology. 2009;27:1667-74
28. Go H, Jeon YK, Park HJ, Sung SW, Seo JW, Chung DH. High MET gene copy number leads to shorter survival in patients with non-small cell lung cancer. Journal of thoracic oncology: official publication of the International Association for the Study of Lung Cancer. 2010;5:305-13
29. Li Y, Li W, He Q, Xu Y, Ren X, Tang X. et al. Prognostic value of MET protein overexpression and gene amplification in locoregionally advanced nasopharyngeal carcinoma. Oncotarget. 2015;6:13309-19
30. Hanna WM, Ruschoff J, Bilous M, Coudry RA, Dowsett M, Osamura RY. et al. HER2 in situ hybridization in breast cancer: clinical implications of polysomy 17 and genetic heterogeneity. Modern pathology: an official journal of the United States and Canadian Academy of Pathology, Inc. 2014;27:4-18
31. Seo AN, Park KU, Choe G, Kim WH, Kim DW, Kang SB. et al. Clinical and prognostic value of MET gene copy number gain and chromosome 7 polysomy in primary colorectal cancer patients. Tumour biology: the journal of the International Society for Oncodevelopmental Biology and Medicine. 2015;36:9813-21
32. Lee HE, Kim MA, Lee HS, Jung EJ, Yang HK, Lee BL. et al. MET in gastric carcinomas: comparison between protein expression and gene copy number and impact on clinical outcome. British journal of cancer. 2012;107:325-33
33. Weingertner N, Meyer N, Voegeli AC, Guenot D, Renaud S, Massard G. et al. Correlation between MET protein expression and MET gene copy number in a Caucasian cohort of non-small cell lung cancers according to the new IASLC/ATS/ERS classification. Pathology. 2015;47:320-8
34. Iveson T, Donehower RC, Davidenko I, Tjulandin S, Deptala A, Harrison M. et al. Rilotumumab in combination with epirubicin, cisplatin, and capecitabine as first-line treatment for gastric or oesophagogastric junction adenocarcinoma: an open-label, dose de-escalation phase 1b study and a double-blind, randomised phase 2 study. Lancet Oncol. 2014;15:1007-18
35. Spigel DR, Ervin TJ, Ramlau RA, Daniel DB, Goldschmidt JH Jr, Blumenschein GR Jr. et al. Randomized phase II trial of Onartuzumab in combination with erlotinib in patients with advanced non-small-cell lung cancer. Journal of clinical oncology: official journal of the American Society of Clinical Oncology. 2013;31:4105-14
36. Koeppen H, Rost S, Yauch RL. Developing biomarkers to predict benefit from HGF/MET pathway inhibitors. J Pathol. 2014;232:210-8
37. Hartmann S, Bhola NE, Grandis JR. HGF/Met Signaling in Head and Neck Cancer: Impact on the Tumor Microenvironment. Clinical cancer research: an official journal of the American Association for Cancer Research. 2016;22:4005-13
Author contact
![]() Corresponding author: Sun Och Yoon, MD, PhD, Department of Pathology, Yonsei University College of Medicine, 50-1 Yonsei-ro, Seodaemun-gu, Seoul, 120-752, Korea. OFFICE TEL: +82-2-2228-1763; FAX: +82-2-362-0860; E-mail: soyoonac.
Corresponding author: Sun Och Yoon, MD, PhD, Department of Pathology, Yonsei University College of Medicine, 50-1 Yonsei-ro, Seodaemun-gu, Seoul, 120-752, Korea. OFFICE TEL: +82-2-2228-1763; FAX: +82-2-362-0860; E-mail: soyoonac.