3.2
Impact Factor
ISSN: 1837-9664
J Cancer 2017; 8(2):278-286. doi:10.7150/jca.17302 This issue Cite
Research Paper
Network Biomarkers Constructed from Gene Expression and Protein-Protein Interaction Data for Accurate Prediction of Leukemia
1. Center for Systems Biology, Soochow University, Suzhou, 215006, China.
2. School of Chemistry and Biological Engineering, Suzhou University of Science and Technology, Suzhou, 215011, China.
3. Department of Pediatrics, The First People's Hospital of Lianyungang, Lianyungang, 222002, China.
4. Key Laboratory of Systems Biology, Chinese Academy of Sciences, Shanghai, 200031, China.
5. Department of Hematology, The Third Hospital Affiliated to Nantong University, No. 585 North Xingyuan Road, Wuxi, Jiangsu214041, China.
Received 2016-8-22; Accepted 2016-10-29; Published 2017-1-15
Abstract
Leukemia is a leading cause of cancer deaths in the developed countries. Great efforts have been undertaken in search of diagnostic biomarkers of leukemia. However, leukemia is highly complex and heterogeneous, involving interaction among multiple molecular components. Individual molecules are not necessarily sensitive diagnostic indicators. Network biomarkers are considered to outperform individual molecules in disease characterization. We applied an integrative approach that identifies active network modules as putative biomarkers for leukemia diagnosis. We first reconstructed the leukemia-specific PPI network using protein-protein interactions from the Protein Interaction Network Analysis (PINA) and protein annotations from GeneGo. The network was further integrated with gene expression profiles to identify active modules with leukemia relevance. Finally, the candidate network-based biomarker was evaluated for the diagnosing performance. A network of 97 genes and 400 interactions was identified for accurate diagnosis of leukemia. Functional enrichment analysis revealed that the network biomarkers were enriched in pathways in cancer. The network biomarkers could discriminate leukemia samples from the normal controls more effectively than the known biomarkers. The network biomarkers provide a useful tool to diagnose leukemia and also aids in further understanding the molecular basis of leukemia.
Keywords: network biomarker, integrative analysis, leukemia.
Introduction
Leukemia is a prevalent hematologic malignancy and one of the most common causes of cancer deaths in the developed countries[1, 2]. The overall incidence of leukemia is 14 per 100000 people in the United States in 2015 and is projected to continue rising. Based on the origin, leukemia can be classified into myeloid leukemia or lymphoid leukemia, which can be subdivided into acute or chronic according to the degree of cellular differentiation[3, 4].
Many of the symptoms of leukemia are non-specific and vague, which could not be diagnosed by conventional blood tests and bone marrow examination[5, 6]. Plenty of efforts have been devoted to investigate the molecular alterations in leukemogenesis. Next generation sequencing of human genomes and exomes has revealed somatic mutations, aberrantly expressed genes, microRNAs and DNA methylations with putative roles in leukemia[7-9]. However, most of the individual molecules suffer from low reproducibility and high false-positive rates. Few of them have been translated to the clinic for diagnostic application.
It is well recognized that cancer is a complex disease caused not by the malfunction of single molecules but their collective behavior in the network [10-15]. Therefore, network biomarkers are considered to better characterize leukemia than individual molecules and have recently attracted much attention. A number of protein interaction sub-networks have been proposed for early diagnosis, prognosis and efficacy prediction of cancers[16-19].
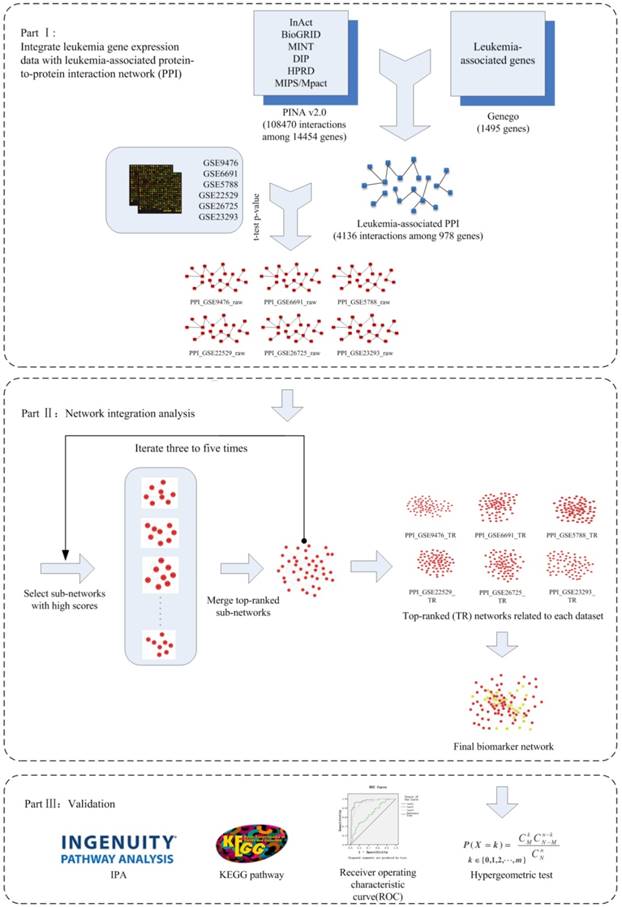
In this study, we proposed a framework (Figure 1) that integrates protein-protein interaction (PPI) data and microarray-based gene expression profiles to construct network biomarkers for accurate prediction of leukemia. The network biomarkers prove to be effective in distinguishing leukemia from normal samples.
Materials and Methods
Data collection
We used two different types of datasets, protein-protein interaction data and disease annotation of the protein-coding genes to reconstruct the leukemia-specific PPI network. PPI data was extracted from the Protein Interaction Network Analysis (PINA) v2.0 platform [20]. PINA is a unified database of protein-protein interaction
that collects 14454 genes and 108470 interactions from six manually curated public databases (listed in Table 1). The leukemia-associated genes were extracted from the commercial knowledge database MetacoreTM, which is developed by GeneGo.
Source databases of PINA.
| Original database | Version | Ref. | Link |
|---|---|---|---|
| IntAc | Oct 4,2012 | [21] | http://www.ebi.ac.uk/intact/ |
| BioGRID | 3.1.93 | [22] | http://thebiogrid.org/ |
| MINT | Dec 21,2010 | [23] | http://mint.bio.uniroma2.it/mint/Welcome.do |
| DIP | June 14,2010 | [24] | http://dip.doe-mbi.ucla.edu/dip/Stat.cgi |
| HPRD | April 13,2010 | [25] | http://www.hprd.org/download |
| MIPS/Mpact | Oct 1,2008 | [26] | http://mips.helmholtz-muenchen.de/ |
The public gene expression data were downloaded from the Gene Expression Omnibus (GEO) database. All the gene expression data were obtained using Affymetrix Human Genome arrays. The samples in each GEO datasets are divided into three categories: Leukemia (including AML, CLL, T-PLL and B-CLL), others and Normal. The others samples are filtered out in this study since they are not associated with leukemia. Detailed information for GEO datasets is summarized in Table 2. The six groups of expression datasets were analyzed to get statistics values. Additional three sets of expression datasets were used for further verification (Table 3).
Leukemia-associated gene expression datasets used for analysis.
| Series | Platform | No. Samples | Leukemia | Others | Normal | Ref. | |||
|---|---|---|---|---|---|---|---|---|---|
| AML | CLL | T-PLL | B-CLL | ||||||
| GSE9476 | GPL96 | 64 | 26 | 38 | [27] | ||||
| GSE6691 | GPL96 | 56 | 11 | 32 | 13 | [28] | |||
| GSE5788 | GPL96 | 14 | 6 | 8 | [29] | ||||
| GSE22529 | GPL96 | 52 | 41 | 11 | [30] | ||||
| GSE26725 | GPL570 | 17 | 12 | 5 | [31] | ||||
| GSE23293 | GPL570 | 41 | 7 | 18 | 16 | [32] | |||
Leukemia-associated gene expression datasets used for validation.
| Series | Platform | No. of samples | CML | CLL | Normal | Ref. |
|---|---|---|---|---|---|---|
| GSE8835 | GPL96 | 66 | 42 | 24 | [33] | |
| GSE24739 | GPL570 | 24 | 16 | 8 | [34] | |
| GSE39411 | GPL570 | 152 | 104 | 48 | [35] |
Reconstruction of leukemia-specific PPI network
Human leukemia-specific protein-protein interaction network was first downloaded from PINA and then refined with the 1495 leukemia-associated gene from GeneGo. Only the interactions formed between leukemia-associated genes were selected to form a leukemia-specific PPI network.
Integration with gene expressing profiles
The statistical analysis was invoked through the limma (Linear Models for Microarray Data) R package [36] and the affy(Methods for Affymetrix Oligonucleotide Arrays) R package in R software platform [37]. Student t-test was used to identify the significant difference level (P-value) of each considerable gene in each dataset. To enhance the accuracy, we applied the empirical Bayesian statistical method to moderate the standard errors and then utilized the method proposed by Benjamini et al. to adjust the multi-testing [38], and got the adjusted P-values simultaneously.
To integrate the gene expression data and leukemia-specific PPI network, the adjusted P-value of each gene was mapped onto its corresponding gene in the leukemia-specific PPI network to obtain a dataset-specific weighted PPI network, with adjusted P-value as weight factor.
Active module subtraction
In general, the network integration analysis was performed in 3 steps. At the first step, we converted the adjusted P-values to Z score through using the inverse normal cumulative distribution. Higher Z score indicates more important role in leukemogenesis. Given the Z score, we performed a greedy search to identify the modules with a locally maximal Z score. The candidate modules were seeded with a single gene and then a neighbor within a distanced=3 from the seed were iteratively added. If the neighbor added to the Z score, it was incorporated into the module. The search terminated when no addition increased the Z score over the improvement rate r. The parameter r was set as 0.05 to avoid over fitting. At last the top 10 modules with the highest Z-score identified from each run were merged and iteratively searched for 3-5 times, until the module reached the optimal size of 70-80 nodes. We used jActiveModules [39] to select active modules from the weighted PPI network since it is a fashionable method for this kind of investigation. jAM is a plug-in of Cytoscape which evaluated module activity with Z score.
Network-based biomarkers construction
At last, as 6 optimized modules include 290 genes in total, which are too large and loosely interconnected for further analysis, we carried out the overlapping analysis to find out the number of enriched genes shared by each optimized modules. We overlapped the six modules and selected the genes shared by at least two networks to construct the final network-based biomarker.
Pathway enrichment analysis
We performed pathway enrichment analysis in Ingenuity Pathway Analysis (IPA) and Kyoto Encyclopedia of Genes and Genomes (KEGG) [40]to provide functional insight into the identified network marker. The statistical significance of the enrichment was calculated using hypergeometric test and adjusted by FDR method (P-value < 0.05).
Statistical significance assessment
Hypergeometric test was used to test whether the network biomarkers are significantly enriched with leukemia-related genes. Known mutation genes related to cancers were obtained from the Catalogue of Somatic Mutations in Cancer (COSMIC), which is a cancer gene census [41]. 213 of the COSMIC genes are found in common with the GeneGO database. An empirical P-value was calculated to evaluate the statistical significance. P-value was obtained according to the following equation:
Where, N represents the number of genes in the leukemia-specific PPI network; M is the number of known leukemia related genes in COSMIC; n denotes the number of genes in the final network biomarkers; k represents the known leukemia related genes in the final network biomarkers.
Performance evaluation
We employed the receiver-operating characteristic (ROC) analysis to evaluate the prediction performance of the network biomarkers in distinguishing leukemia samples from the normal controls. The epicalc R package (http://CRAN.R-project.org/package=epicalc) was used to produce the ROC curves. A 5-fold cross validation was performed on three gene expression dataset listed in Table 3. Normal samples were set as 0 and cancer samples were set as 1. The classification performance was represented as the area under curve (AUC). We also provided sensitivity, specificity and accuracy for the network biomarkers.
Results and Discussion
Sub-network involved in leukemogenesis
The leukemia-specific PPI network was reconstructed by integrating PPI from PINA and 1495 leukemia-associated genes from GeneGo. As a result, the leukemia-specific PPI network consists of 4136 interactions among 978 genes.
As is described in Methods section, gene expression profiles of 6 independent GEO datasets were overlaid to the reconstructed leukemia-specific PPI network and 6 correspondent dataset-specific sub-networks were obtained (marked orderly as PPI_GSE9476_raw, PPI_GSE6691_raw, PPI_GSE9476_raw, PPI_GSE22529_raw, PPI_GSE23293_raw and PPI_GSE26725_raw in Figure 1). Greedy search was performed for 6 sub-networks respectively. After 3 iterations for GSE5788, GSE9476 and GSE22529, 4 iterations for GSE23293 and GSE26725, 5 iterations for GSE6691, finally we obtained 6 active modules with a locally maximal Z score by jActiveModules (marked orderly as PPI_GSE9476_TR, PPI_GSE6691_ TR, PPI_GSE9476_TR, PPI_GSE22529_TR, PPI_GSE23293_TR and PPI_GSE26725_TR in Figure 1). The number of nodes and edges in each module is summarized in Table 4.
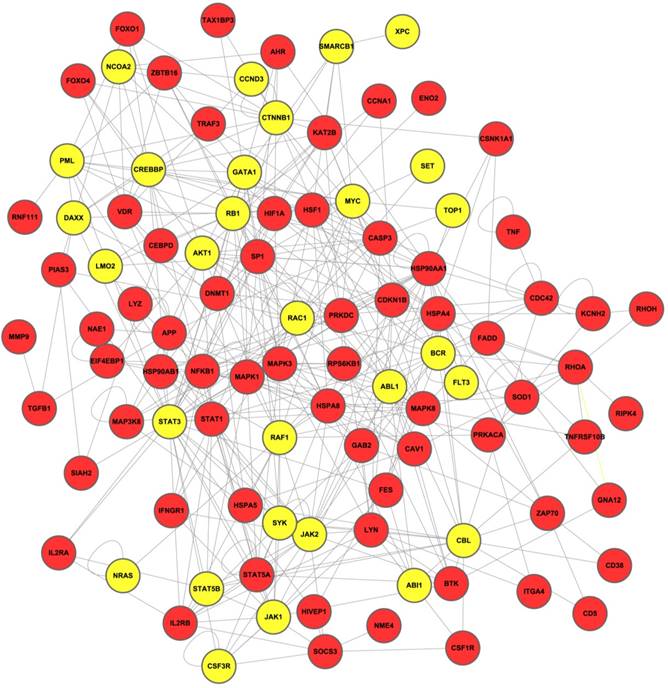
After overlap analysis, a total of 97 genes along with their interactions were incorporated into the final network-based biomarkers, as illustrated in Figure 2. Genes with previous evidence in leukemia are marked yellow.
The flowchart of network biomarkers identification for leukemia diagnosis.
Detailed information of the active modules.
| PPI_GSE5788_TR | PPI_GSE6691_ TR | PPI_GSE9476_ TR | PPI_GSE22529_ TR | PPI_GSE23293_ TR | PPI_GSE23293_ TR | |
|---|---|---|---|---|---|---|
| Nodes | 77 | 71 | 75 | 73 | 71 | 75 |
| Edges | 205 | 186 | 166 | 193 | 126 | 188 |
The final network-based biomarker for leukemia. The known cancer related genes in final network are marked yellow.
Functional analysis of candidate network biomarkers
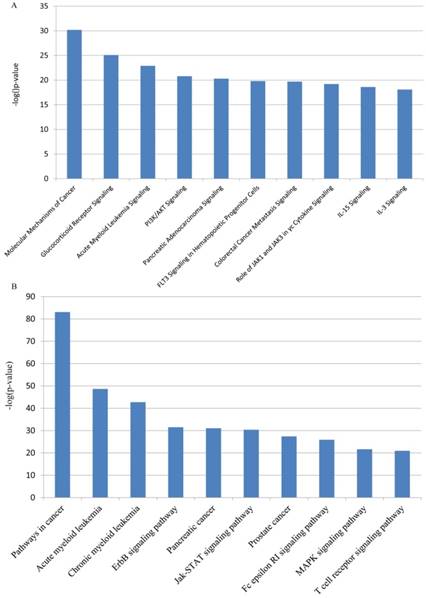
The network biomarkers were most enriched for molecular mechanisms of cancer (IPA) and pathways in cancer (KEGG). Leukemia-specific pathways such as Chronic Myeloid Leukemia (KEGG) and Acute Myeloid Leukemia Signaling (both IPA and KEGG) were also enriched and showed high statistical significance. It indicates that genes in the biomarker network are closely associated with the development of different types of leukemia. Besides, in He's study, P13K/AKT Signaling (IPA) was also proved to be involved in chronic myeloid leukemia[42]. Irwin et al. found that ErbB inhibitors played important roles in Philadelphia chromosome-positive acute lymphoblastic leukemia (Ph(+)ALL) and ErbB signaling (KEGG) was a complementary molecular target in Ph(+)ALL [43]. The top-ranked pathways in both IPA and KEGG displayed apparent correlation between leukemia and the network biomarkers, which implied the potential accuracy of our result. Figure 3 shows the top 10 most significantly enriched IPA and KEGG pathway respectively.
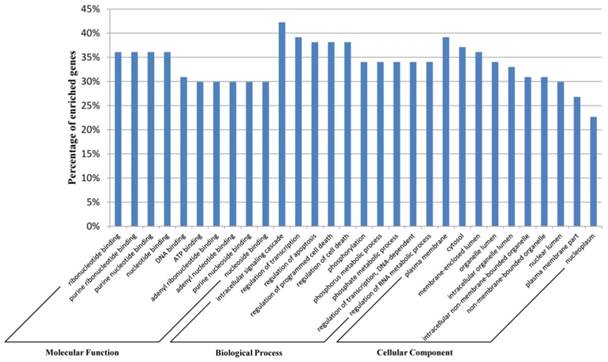
We used the Database for Annotation, Visualization, and Integrated Discovery (DAVID) [44] for the Gene ontology (GO) annotation in three domains: molecular function, biological process, and cellular component. The top 10 most significantly enriched items for each domain are shown in Figure 4. These results indicate that genes in the network are closely associated with the biological processes in the development of different types of leukemia, such as cell death [45] and apoptosis [46]. This indicated the accuracy of the predicted network biomarkers to a certain extent.
IPA and KEGG pathway enrichment analysis for network biomarkers. The top 10 most significantly enriched IPA and KEGG pathway are shown in panel (A) and (B) respectively.
Gene ontology annotation for the network biomarkers. The network biomarkers identified by our method were annotated with DAVID tools at three levels of gene ontology: Molecular Function, Biological Process, and Cellular Component. The top 10 most significantly enriched items for each level are shown.
Network biomarkers are significantly associated with leukemia
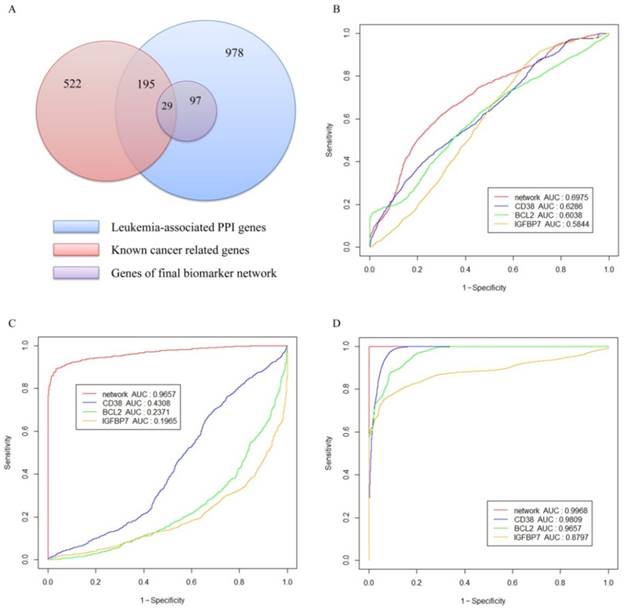
We further investigated whether the genes in the network biomarkers were randomly obtained. The statistical significance was checked using hypergeometric test and a significant p-value of 0.008987933 was obtained. This indicates that the candidate network biomarkers are enriched with known leukemia-related genes and could not be obtained randomly.
As illustrated in Figure 5(A), the blue circle represents the 978 genes in the leukemia-specific PPI network; the red circle includes the 522 known leukemia-related genes in COSMIC. The leukemia-specific PPI contains 195 known leukemia-related genes in COSMIC. The purple circle represents 97 genes in final network biomarkers, among which 29 genes belong to the known leukemia-related category.
Sub-network marker with higher classification accuracy
To evaluate the performance of network biomarkers in classifying leukemia and normal gene expression profiles, we used three independent gene expression datasets listed in Table 3 as tested datasets to produce the ROC curves. We compared the network biomarker with three reported gene biomarkers: CD38[47], BCL2 [48] and IGFBP7 [49]. The reasons we chose these three markers for comparison are as follows, 1) these biomarkers are all well-studied and all of them have been validated by clinical experiments. 2) The marker CD38 is a member of our network whereas the remaining two are not. We included two others for fair evaluating the performance of our network biomarker. Figure 5 shows the ROC curves for network biomarkers and 3 known biomarkers. Network-based biomarker has higher AUC than any of the single markers which means network-based biomarker could more effectively discriminate the leukemia from the normal controls. The sensitivity, specificity and accuracy of each dataset are given in Table 5.
Validation of the network biomarkers. (A) Distribution of the leukemia-associated genes in the network. (B-D) ROC curves obtained with the network biomarkers tested by three gene expression datasets. Panel (B), (C) and (D) represent respectively the results of the gene expression datasets in series of GSE8835, GSE24739 and GSE39411.
Detailed information of ROC curves.
| Series | Biomarker | Sensitivity | Precision | Specificity | Accuracy | AUC |
|---|---|---|---|---|---|---|
| GSE8835 | CD38 | 0.913 | 0.700 | 0.212 | 0.658 | 0.629 |
| BCL2 | 0.885 | 0.650 | 0.166 | 0.623 | 0.604 | |
| IGFBP7 | 0.965 | 0.665 | 0.148 | 0.668 | 0.584 | |
| Network biomarkers | 0.851 | 0.686 | 0.316 | 0.657 | 0.698 | |
| GSE24739 | CD38 | 0.893 | 0.662 | 0.088 | 0.625 | 0.431 |
| BCL2 | 0.943 | 0.654 | 0.004 | 0.630 | 0.237 | |
| IGFBP7 | 0.938 | 0.652 | 0.001 | 0.625 | 0.197 | |
| Network biomarkers | 0.874 | 0.986 | 0.976 | 0.908 | 0.966 | |
| GSE39411 | CD38 | 0.999 | 0.725 | 0.177 | 0.740 | 0.981 |
| BCL2 | 0.915 | 0.931 | 0.853 | 0.895 | 0.966 | |
| IGFBP7 | 0.886 | 0.797 | 0.513 | 0.768 | 0.880 | |
| Network biomarkers | 0.996 | 0.999 | 0.998 | 0.997 | 0.999 |
It is worth noting that for network biomarkers from GSE8835 has a relatively lower AUC than the other two datasets. This may be caused by the difference of platform and method between GSE8835 and the training datasets. Anyhow, the accuracy of the network biomarkers is still higher than other three single biomarkers.
The result indicates that the putative network biomarkers could diagnose leukemia samples more accurately and could be used as putative biomarker to aid in early diagnosis of leukemia.
Conclusions
In conclusion, we developed a network approach for molecular investigation and diagnosis of leukemia. The constructed network biomarkers not only achieve higher accuracy rate of diagnosis compared to known single biomarkers but also provide systematic insights into the leukemogenesis process. We noticed that we only considered the combination of genes (or the nodes) in the network for the prediction of leukemia. The interactions among genes can also provide valuable biological signatures for diagnosis of diseases. We will take the edge-variation in the network into the account for the further improving of the leukemia prediction.
Abbreviations
PPI: Protein-protein interaction.
PINA: Protein Interaction Network Analysis.
GEO: Gene Expression Omnibus.
IPA: Ingenuity Pathway Analysis.
KEGG: Kyoto Encyclopedia of Genes and Genomes.
COSMIC: Catalogue of Somatic Mutations in Cancer.
ROC: Receiver-operating characteristic.
AUC: area under curve.
DAVID: Database for Annotation, Visualization, and Integrated Discovery.
GO: Gene ontology.
Availability of Data and Materials
PINA: http://cbg.garvan.unsw.edu.au/pina/interactome.stat.do.
GeneGo: https://portal.genego.com/cgi/data_manager.cgi.
GSE9476: http://www.ncbi.nlm.nih.gov/geo/query/acc.cgi?acc=GSE9476.
GSE6691: http://www.ncbi.nlm.nih.gov/geo/query/acc.cgi?acc=GSE6691.
GSE5788: http://www.ncbi.nlm.nih.gov/geo/query/acc.cgi?acc=GSE5578.
GSE22529: http://www.ncbi.nlm.nih.gov/geo/query/acc.cgi?acc=GSE22529.
GSE26725: http://www.ncbi.nlm.nih.gov/geo/query/acc.cgi?acc=GSE26725.
GSE23293: http://www.ncbi.nlm.nih.gov/geo/query/acc.cgi?acc=GSE23293.
GSE8835: http://www.ncbi.nlm.nih.gov/geo/query/acc.cgi?acc=GSE8835.
GSE24739: http://www.ncbi.nlm.nih.gov/geo/query/acc.cgi?acc=GSE24739.
GSE39411: http://www.ncbi.nlm.nih.gov/geo/query/acc.cgi?acc=GSE39411.
COSMIC: http://cancer.sanger.ac.uk/cosmic/download
IPA: http://www.ingenuity.com/products/login
DAVID: https://david.ncifcrf.gov/.
Acknowledgements
BS, XY and JC were supported by National Natural Science Foundation of China (NSFC) (grant no. 31670851, 31470821, 31400712, 91530320).
Conflict of Interest
The authors declare no conflict of interest.
References
1. World Health Organization. World Cancer Report 2014. WHO. 2014
2. Yan W, Xu L, Sun Z, Lin Y, Zhang W, Chen J. et al. MicroRNA biomarker identification for pediatric acute myeloid leukemia based on a novel bioinformatics model. Oncotarget. 2015;6:26424-36
3. Vardiman JW, Thiele J, Arber DA, Brunning RD, Borowitz MJ, Porwit A. et al. The 2008 revision of the World Health Organization (WHO) classification of myeloid neoplasms and acute leukemia: rationale and important changes. Blood. 2009;114:937-51
4. Pui CH, Carroll WL, Meshinchi S, Arceci RJ. Biology, risk stratification, and therapy of pediatric acute leukemias: an update. Journal of clinical oncology: official journal of the American Society of Clinical Oncology. 2011;29:551-65
5. Alperstein W, Boren M, McNeer JL. Pediatric Acute Lymphoblastic Leukemia: From Diagnosis to Prognosis. Pediatric annals. 2015;44:e168-74
6. Bene MC, Grimwade D, Haferlach C, Haferlach T, Zini G, European L. Leukemia diagnosis: today and tomorrow. European journal of haematology. 2015
7. Marcucci G, Mrozek K, Radmacher MD, Garzon R, Bloomfield CD. The prognostic and functional role of microRNAs in acute myeloid leukemia. Blood. 2011;117:1121-9
8. Walker A, Marcucci G. Molecular prognostic factors in cytogenetically normal acute myeloid leukemia. Expert review of hematology. 2012;5:547-58
9. Marcucci G, Yan P, Maharry K, Frankhouser D, Nicolet D, Metzeler KH. et al. Epigenetics meets genetics in acute myeloid leukemia: clinical impact of a novel seven-gene score. Journal of clinical oncology: official journal of the American Society of Clinical Oncology. 2014;32:548-56
10. Wang X. Role of clinical bioinformatics in the development of network-based Biomarkers. Journal of clinical bioinformatics. 2011;1:28
11. Chen J, Sun M, Shen B. Deciphering oncogenic drivers: from single genes to integrated pathways. Briefings in bioinformatics. 2015;16:413-28
12. Zhang W, Zang J, Jing X, Sun Z, Yan W, Yang D. et al. Identification of candidate miRNA biomarkers from miRNA regulatory network with application to prostate cancer. Journal of translational medicine. 2014;12:66
13. Wang Y, Chen J, Li Q, Wang H, Liu G, Jing Q. et al. Identifying novel prostate cancer associated pathways based on integrative microarray data analysis. Comput Biol Chem. 2011;35:151-8
14. Cui W, Qian Y, Zhou X, Lin Y, Jiang J, Chen J. et al. Discovery and characterization of long intergenic non-coding RNAs (lincRNA) module biomarkers in prostate cancer: an integrative analysis of RNA-Seq data. BMC Genomics. 2015;16(Suppl 7):S3
15. Chen J, Wang Y, Shen B, Zhang D. Molecular signature of cancer at gene level or pathway level? Case studies of colorectal cancer and prostate cancer microarray data. Comput Math Methods Med. 2013;2013:909525
16. Li Y, Vongsangnak W, Chen L, Shen B. Integrative analysis reveals disease-associated genes and biomarkers for prostate cancer progression. BMC medical genomics. 2014;7(Suppl 1):S3
17. Chuang HY, Lee E, Liu YT, Lee D, Ideker T. Network-based classification of breast cancer metastasis. Molecular systems biology. 2007;3:140
18. Nibbe RK, Markowitz S, Myeroff L, Ewing R, Chance MR. Discovery and scoring of protein interaction subnetworks discriminative of late stage human colon cancer. Molecular & cellular proteomics: MCP. 2009;8:827-45
19. Wang YC, Chen BS. A network-based biomarker approach for molecular investigation and diagnosis of lung cancer. BMC medical genomics. 2011;4:2
20. Cowley MJ, Pinese M, Kassahn KS, Waddell N, Pearson JV, Grimmond SM. et al. PINA v2.0: mining interactome modules. Nucleic acids research. 2012;40:D862-5
21. Kerrien S, Aranda B, Breuza L, Bridge A, Broackes-Carter F, Chen C. et al. The IntAct molecular interaction database in 2012. Nucleic acids research. 2012;40:D841-6
22. Chatr-Aryamontri A, Breitkreutz BJ, Heinicke S, Boucher L, Winter A, Stark C. et al. The BioGRID interaction database: 2013 update. Nucleic acids research. 2013;41:D816-23
23. Ceol A, Chatr Aryamontri A, Licata L, Peluso D, Briganti L, Perfetto L. et al. MINT, the molecular interaction database: 2009 update. Nucleic acids research. 2010;38:D532-9
24. Xenarios I, Fernandez E, Salwinski L, Duan XJ, Thompson MJ, Marcotte EM. et al. DIP: The Database of Interacting Proteins: 2001 update. Nucleic acids research. 2001;29:239-41
25. Keshava Prasad TS, Goel R, Kandasamy K, Keerthikumar S, Kumar S, Mathivanan S. et al. Human Protein Reference Database-2009 update. Nucleic acids research. 2009;37:D767-72
26. Mewes HW, Frishman D, Guldener U, Mannhaupt G, Mayer K, Mokrejs M. et al. MIPS: a database for genomes and protein sequences. Nucleic acids research. 2002;30:31-4
27. Stirewalt DL, Meshinchi S, Kopecky KJ, Fan W, Pogosova-Agadjanyan EL, Engel JH. et al. Identification of genes with abnormal expression changes in acute myeloid leukemia. Genes, chromosomes & cancer. 2008;47:8-20
28. Gutierrez NC, Ocio EM, de Las Rivas J, Maiso P, Delgado M, Ferminan E. et al. Gene expression profiling of B lymphocytes and plasma cells from Waldenstrom's macroglobulinemia: comparison with expression patterns of the same cell counterparts from chronic lymphocytic leukemia, multiple myeloma and normal individuals. Leukemia. 2007;21:541-9
29. Sellick GS, Broderick P, Fielding S, Catovsky D, Houlston RS. Lack of a relationship between the common 8q24 variant rs6983267 and risk of chronic lymphocytic leukemia. Leukemia. 2008;22:438-9
30. Gutierrez A Jr, Tschumper RC, Wu X, Shanafelt TD, Eckel-Passow J, Huddleston PM 3rd. et al. LEF-1 is a prosurvival factor in chronic lymphocytic leukemia and is expressed in the preleukemic state of monoclonal B-cell lymphocytosis. Blood. 2010;116:2975-83
31. Vargova K, Curik N, Burda P, Basova P, Kulvait V, Pospisil V. et al. MYB transcriptionally regulates the miR-155 host gene in chronic lymphocytic leukemia. Blood. 2011;117:3816-25
32. Christopoulos P, Pfeifer D, Bartholome K, Follo M, Timmer J, Fisch P. et al. Definition and characterization of the systemic T-cell dysregulation in untreated indolent B-cell lymphoma and very early CLL. Blood. 2011;117:3836-46
33. Gorgun G, Holderried TA, Zahrieh D, Neuberg D, Gribben JG. Chronic lymphocytic leukemia cells induce changes in gene expression of CD4 and CD8 T cells. J Clin Invest. 2005;115:1797-805
34. Affer M, Dao S, Liu C, Olshen AB, Mo Q, Viale A. et al. Gene Expression Differences between Enriched Normal and Chronic Myelogenous Leukemia Quiescent Stem/Progenitor Cells and Correlations with Biological Abnormalities. J Oncol. 2011;2011:798592
35. Vallat L, Kemper CA, Jung N, Maumy-Bertrand M, Bertrand F, Meyer N. et al. Reverse-engineering the genetic circuitry of a cancer cell with predicted intervention in chronic lymphocytic leukemia. Proc Natl Acad Sci U S A. 2013;110:459-64
36. Smyth GK, Michaud J, Scott HS. Use of within-array replicate spots for assessing differential expression in microarray experiments. Bioinformatics. 2005;21:2067-75
37. Mohapatra SK, Krishnan A. Microarray data analysis. Methods Mol Biol. 2011;678:27-43
38. Benjamini Y, Drai D, Elmer G, Kafkafi N, Golani I. Controlling the false discovery rate in behavior genetics research. Behavioural brain research. 2001;125:279-84
39. Shannon P, Markiel A, Ozier O, Baliga NS, Wang JT, Ramage D. et al. Cytoscape: a software environment for integrated models of biomolecular interaction networks. Genome research. 2003;13:2498-504
40. Du J, Yuan Z, Ma Z, Song J, Xie X, Chen Y. KEGG-PATH: Kyoto encyclopedia of genes and genomes-based pathway analysis using a path analysis model. Molecular bioSystems. 2014;10:2441-7
41. Forbes SA, Bindal N, Bamford S, Cole C, Kok CY, Beare D. et al. COSMIC: mining complete cancer genomes in the Catalogue of Somatic Mutations in Cancer. Nucleic acids research. 2011;39:D945-50
42. He L, Tang J, Bu YJ. [Role of P13K/Akt pathway in chronic myeloid leukemia]. Zhonghua xue ye xue za zhi = Zhonghua xueyexue zazhi. 2013;34:80-2
43. Irwin ME, Nelson LD, Santiago-O'Farrill JM, Knouse PD, Miller CP, Palla SL. et al. Small molecule ErbB inhibitors decrease proliferative signaling and promote apoptosis in philadelphia chromosome-positive acute lymphoblastic leukemia. PloS one. 2013;8:e70608
44. Huang da W, Sherman BT, Lempicki RA. Systematic and integrative analysis of large gene lists using DAVID bioinformatics resources. Nat Protoc. 2009;4:44-57
45. Yokoyama T, Ohyashiki K. [Hematopoietic cell death and leukemia]. Nihon Rinsho. 2009;67:1869-74
46. Loeder S, Zenz T, Schnaiter A, Mertens D, Winkler D, Dohner H. et al. A novel paradigm to trigger apoptosis in chronic lymphocytic leukemia. Cancer Res. 2009;69:8977-86
47. Deaglio S, Vaisitti T, Aydin S, Ferrero E, Malavasi F. In-tandem insight from basic science combined with clinical research: CD38 as both marker and key component of the pathogenetic network underlying chronic lymphocytic leukemia. Blood. 2006;108:1135-44
48. Papageorgiou SG, Kontos CK, Pappa V, Thomadaki H, Kontsioti F, Dervenoulas J. et al. The novel member of the BCL2 gene family, BCL2L12, is substantially elevated in chronic lymphocytic leukemia patients, supporting its value as a significant biomarker. Oncologist. 2011;16:1280-91
49. Heesch S, Schlee C, Neumann M, Stroux A, Kuhnl A, Schwartz S. et al. BAALC-associated gene expression profiles define IGFBP7 as a novel molecular marker in acute leukemia. Leukemia. 2010;24:1429-36
Author contact
![]() Corresponding author: Dr. Haiying Hua, email: huahy007com.
Corresponding author: Dr. Haiying Hua, email: huahy007com.

 Global reach, higher impact