Impact Factor ISSN: 1837-9664

 Global reach, higher impact
J Cancer 2017; 8(8):1441-1452. doi:10.7150/jca.18455 This issue Cite
Research Paper
Towards Prognostic Profiling of Non-Small Cell Lung Cancer: New Perspectives on the Relevance of Polo-Like Kinase 1 Expression, the TP53 Mutation Status and Hypoxia
Jolien Van den Bossche1 ![]() , Christophe Deben1, 2, Ken Op de Beeck1, 3, Vanessa Deschoolmeester1, 2, Christophe Hermans1, 2, Ines De Pauw1, Julie Jacobs1, 2, Paul Van Schil4, Jan Baptist Vermorken1, 5, Patrick Pauwels1, 2, Marc Peeters1, 5, Filip Lardon1*, An Wouters1*
, Christophe Deben1, 2, Ken Op de Beeck1, 3, Vanessa Deschoolmeester1, 2, Christophe Hermans1, 2, Ines De Pauw1, Julie Jacobs1, 2, Paul Van Schil4, Jan Baptist Vermorken1, 5, Patrick Pauwels1, 2, Marc Peeters1, 5, Filip Lardon1*, An Wouters1*
1. Center for Oncological Research (CORE), University of Antwerp, Universiteitsplein 1, 2610 Wilrijk, Belgium;
2. Department of Pathology, Antwerp University Hospital, Wilrijkstraat 10, 2650 Edegem, Belgium;
3. Center of Medical Genetics, University of Antwerp, Antwerp University Hospital, Prins Boudewijnlaan 43, 2650 Edegem, Belgium;
4. Department of Thoracic and Vascular Surgery, Antwerp University Hospital, Wilrijkstraat 10, 2650 Edegem, Belgium;
5. Department of Oncology, Antwerp University Hospital, Wilrijkstraat 10, 2650 Edegem, Belgium.
* These authors share senior authorship
Received 2016-11-22; Accepted 2017-2-4; Published 2017-5-12
Abstract
Background: Currently, prognosis of non-small cell lung cancer (NSCLC) patients is based on clinicopathological factors, including TNM stage. However, there are considerable differences in patient outcome within a similar staging group, even when patients received identical treatments. In order to improve prognostic predictions and to guide treatment options, additional parameters influencing outcome are required. Polo-like kinase 1 (Plk1), a master regulator of mitotic cell division and the DNA damage response, is considered as a new potential biomarker in this research area. While several studies reported Plk1 overexpression in a broad range of human malignancies, inconsistent results were published regarding the clinical significance hereof. A prognostic panel, consisting of Plk1 and additional biomarkers that are related to the Plk1 pathway, might further improve prediction of patient prognosis.
Methods: In this study, we evaluated for the first time the prognostic value of Plk1 mRNA and protein expression in combination with the TP53 mutation status (next generation sequencing), induction of apoptotic cell death (immunohistochemistry for cleaved caspase 3) and hypoxia (immunohistochemistry for carbonic anhydrase IX (CA IX)) in 98 NSCLC adenocarcinoma patients.
Results: Both Plk1 mRNA and protein expression and CA IX protein levels were upregulated in the majority of tumor samples. Plk1 mRNA and protein expression levels were higher in TP53 mutant samples, suggesting that Plk1 overexpression is, at least partially, the result of loss of functional p53 (<0.05). Interestingly, the outcome of patients with both Plk1 mRNA and CA IX protein overexpression, who also harbored a TP53 mutation, was much worse than that of patients with aberrant expression of only one of the three markers (p=0.001).
Conclusion: The combined evaluation of Plk1 mRNA expression, CA IX protein expression and TP53 mutations shows promise as a prognostic panel in NSCLC patients. Moreover, these results pave the way for new combination strategies with Plk1 inhibitors.
Keywords: Polo-like kinase 1, Carbonic anhydrase IX, TP53, Non-small cell lung cancer, Prognostic biomarker, Hypoxia.
Introduction
Non-small cell lung cancer (NSCLC), accounting for an estimated 75-85% of all lung neoplasms, is the leading cause of cancer-related death worldwide [1]. Over the last decades, molecular profiling studies revealed that both genetic and molecular changes underlie this malignancy, leading to the development of individualized and more selective treatment approaches [2]. However, clinical efficacy of these targeted therapies in long-term treatments is often limited by the emergence of resistance mechanisms. Therefore, numerous new potential targets, including several cell cycle kinases, are under investigation in order to further improve patient survival [3, 4].
The Polo-like kinase (Plk) family, which consists of five members (Plk1-5), represents a family of highly conserved serine/threonine kinases that play crucial roles in cell cycle processes [5]. Plk1, the first identified member of the Plk family, mediates several mitotic events, including mitotic entry, microtubule nucleation, centrosome maturation, kinetochore assembly and regulation of cytokinesis (reviewed by Zitouni et al. [6] and Van den Bossche et al. [7]). In addition, Plk1 also plays a role in DNA damage response by regulating (i) G2/M DNA damage checkpoint maintenance and recovery and (ii) DNA repair through phosphorylation of the RAD51 recombinase to facilitate homologous recombination [8]. Both Plk1 mRNA and protein levels are tightly regulated in time, with low levels during interphase and high expression in mitosis. Aberrant Plk1 activity may result in overriding cell cycle checkpoints, leading to genomic instability [9]. To date, Plk1 has been found to be overexpressed in a broad range of tumor types. In some malignancies, high expression levels were correlated with genetic instability and poor patient prognosis [10-19]. Moreover, high tumor mitotic rate and risk of metastasis have been associated with high Plk1 levels, implying a role for Plk1 in aggressive cancers and the potential for its use as a prognostic marker and therapeutic target [20].
Another crucial regulator of the cell cycle is p53, which ensures regulation of the response to cellular stress signals by induction of cell cycle arrest, senescence or apoptosis in order to prevent malignant transformation. In addition to activating the expression of a wide range of genes involved in these protective processes, p53 also represses the expression of many genes required for cell cycle progression and survival, including Plk1. Hence, it became clear that the Plk1 pathway and p53 are cross-linked [21]. In the presence of DNA damage during the G2/M phase, the Plk1 promotor is downregulated by p53, leading to mitotic arrest and the induction of apoptotic cell death. As such, loss of p53 function may result in deregulated Plk1 levels [21]. Furthermore, Sur et al. reported that p53 deficient cells become more dependent on Plk1 under stress conditions, suggesting that the p53 status might be a predictive marker for successfully targeting Plk1 [22]. Meanwhile, Plk1 also negatively regulates p53, thereby inhibiting its pro-apoptotic function [21]. However, the exact relationship between Plk1 expression levels, the TP53 status and the induction of apoptotic cell death still needs to be further elucidated.
Reduced oxygen levels (i.e. hypoxia) is a common characteristic of human solid tumors and initiates a complicated biological response, involving numerous pathways that influence the properties of malignant cells: from proliferation and the induction of cell death to angiogenesis, metastatic spread and the selection of cells with more aggressive phenotypes [23-25]. Consequently, hypoxic tumor regions often contain viable cells that are more resistant to chemo- and/or radiotherapy. These adoptive mechanisms are under strict regulation of the hypoxia inducible factor 1 (HIF-1α). Recently, Ward et al. published that Plk1 and Plk4 expression become deregulated under reduced oxygen tension through epigenetic modifications in their promoter regions in a cell-specific p53-dependent manner [26]. However, the exact mechanism controlling Plk1 expression under reduced oxygen conditions is still unknown, making it interesting to further elucidate the involvement of p53 and Plk1 in the hypoxia signaling pathway.
In the present study, we performed a detailed analysis of Plk1 expression at both the transcript and protein level in 98 primary NSCLC (adenocarcinoma) tumor tissue samples compared to adjacent normal lung tissue samples and we correlated our findings with clinicopathological parameters. Furthermore, we investigated for the first time the relationship between Plk1 and the TP53 gene mutation status, induction of apoptotic cell death and the occurrence of hypoxia.
Materials and Methods
Patients and tissue specimens
Formaldehyde fixed-paraffin embedded (FFPE) samples from NSCLC adenocarcinoma tissues were obtained from 98 patients who underwent surgery at the Antwerp University Hospital (Belgium). The patients' main clinical and pathological parameters are summarized in Table 1. FFPE samples from adjacent normal lung tissue from 16 NSCLC patients were used as control samples. Tissue specimens were obtained from the Antwerp University Hospital Tumorbank and fixed in 4% formaldehyde for 6-18h and paraffin embedded on a routine basis. The study was approved by the Ethics committee of the Antwerp University Hospital.
Patient characteristics.
| Patient characteristic | Number of patients (%) |
|---|---|
| Gender | |
| Female | 64 (65.3%) |
| Male | 34 (34.7%) |
| Smoking behavior | |
| Non-smoker | 7 (7.1%) |
| Smoker | 76 (77.6%) |
| Unknown | 15 (15.3%) |
| Clinical stage | |
| I | 43 (43.9%) |
| II | 26 (26.5%) |
| III | 22 (22.4%) |
| IV | 7 (7.1%) |
| Tumor classification | |
| T1 | 32 (32.7%) |
| T2 | 38 (38.8%) |
| T3 | 22 (22.4%) |
| T4 | 6 (6.1%) |
| N0 | 66 (67.3%) |
| N1 | 19 (19.4%) |
| N2 | 13 (13.3%) |
| M0 | 90 (91.8%) |
| M1 | 8 (8.2%) |
| Metastasis during follow-up | |
| No | 71 (72.4%) |
| Yes | 27 (27.6%) |
| Differentiation | |
| Poor | 28 (28.6%) |
| Moderate | 34 (34.7%) |
| Well | 36 (36.7%) |
| Neo-adjuvant therapy | |
| No | 81 (82.7%) |
| Yes | 17 (17.3%) |
| Adjuvant therapy | |
| No | 50 (51.0%) |
| Yes | 40 (40.8%) |
| Unknown | 8 (8.2%) |
Overview of the clinicopathological parameters of patients.
Plk1 mRNA expression levels: quantitative PCR
Plk1 mRNA expression levels were successfully determined on 66 NSCLC samples and 4 corresponding normal lung tissue samples. The remaining 32 tumor samples were excluded from the study due to insufficient RNA yields or high Ct values. RNA was isolated from 5-10 FFPE tissue slides (10 μm thick), depending on the size of the tumor region. Tumor regions were determined based on hematoxylin/eosin stained reference slides and macrodissection was performed to achieve a minimum of 80% tumor cells. RNA was extracted using the RNeasy FFPE isolation kit (Qiagen, Venlo, The Netherlands), according to the manufacturers' instructions. RNA concentrations and purity were measured as described previously [27]. Subsequently, reverse transcription was performed using the High Capacity RNA-to-cDNA kit (ThermoFisher Scientific, Nepean, Canada) and real-time PCR was performed using the TaqMan Gene Expression Master Mix on a LightCycler480 instrument (Roche, Vilvoorde, Belgium). The hs00153444_m1 (Plk1) TaqMan gene expression assay was used as target of interest (ThermoFisher Scientific) and hs00609296_g1 (HMBS), hs00984230_m1 (B2M), hs01122445_g1 (YWHAZ) were used as housekeeping genes for normalization. Relative gene expression levels were calculated according to the Ct method of the qbasePLUS software (Biogazelle, Zwijnaarde, Belgium) and plotted against normal tissue.
Protein expression levels: immunohistochemistry
Five μm-thick FFPE sections were prepared and subjected to heat-induced antigen retrieval by incubation in a 10mM citrate buffer (pH 9.0 for Plk1 and CA IX, pH 6.0 for cleaved caspase 3) for 20 minutes at 97°C. Subsequently, the endogenous peroxidase activity was quenched by incubating the slides in peroxidase blocking buffer (DAKO, Glostrup, Denmark) for 10 minutes. Incubations with primary monoclonal antibodies were performed as follows: anti-Plk1 (Cell Signaling Technology, Leiden, The Netherlands, 4513S, 1:50), anti-CA IX (Abcam, Cambridge, United Kingdom, 108351, 1:350) or anti-cleaved caspase 3 (Cell Signaling Technology, 95795, 1:250), all for 1 hour at room temperature. After a washing step, bound antibody was detected with the Envision FLEX+ detection kit (DAKO) using 3,3'-diaminobenzidine chromogen solution (DAKO), according to the manufacturers' instructions. Negative controls were prepared by substituting antibody diluent for primary antibody. Positive controls were included in each staining run and consisted of A549 cells (Plk1), stomach tissue (CA IX) and tonsil tissue (cleaved caspase 3).
Evaluation of immunohistochemical tissue staining
Biopsy specimens were scored by three independent investigators and reviewed by an experienced pathologist. To account for heterogeneity of Plk1 and CA IX expression, an immunoreactivity scoring (IRS) system was applied. Staining intensity was designated as either not existent (0), weak (1), moderate (2) or intense (3). For Plk1 expression, the percentage positive tumor cells was scored 0 to 4 (0%, 1-5%, 6-29%, 30-59% and > 60% of tumor cells stained). For CA IX expression, the percentage positive cells was scored 0 to 4 (0%, 1-19%, 20-39%, 40-59%, 60-79% and > 80% of tumor cells stained). Afterwards, the overall IRS score was calculated by multiplication of these two parameters. Cases were grouped as Plk1/CA IX negative (IRS 0), weak Plk1/CA IX positive (IRS 1-3), moderate Plk1/CA IX positive (IRS 4-6) or strong Plk1/CA IX positive (IRS 7-15). For cleaved caspase 3 staining, positivity was assigned when at least 5% of the tumor cells showed staining.
TP53 mutation status analysis: Next generation sequencing
For TP53 mutation status analysis, DNA was obtained from 5-10 FFPE tissue slides (5 μm thick). Tumor regions were determined based on hematoxylin/eosin stained reference slides by a pathologist and enriched by macrodissection. DNA isolation was performed using the QIAmp DNA FFPE tissue kit (Qiagen), according to the manufacturer's instructions. DNA concentrations and purity were determined as described previously [27]. Subsequently, TP53 next generation sequencing was performed on 69 genomic tumor DNA samples using the commercially available TP53 MASTRTM with MID for Illumina Miseq kit (Multiplicom, Niel, Belgium), according to the manufacturer's instructions. Twenty-nine samples were excluded because they did not pass the quality control steps of the TP53 MASTRTM kit protocol. Sequencing was performed on a MiSeq Sequencing system with a MiSeq® Reagent Kit v2 (500 cycles) (Illumina, San Diego, USA). Using the MUT-TP53 2.0 tool, inactivating TP53 mutations were identified which were used for statistical analysis [28].
Statistical analysis
All statistical analyses were performed using SPSS v23.0 software and significance was recorded if P < 0.05. The correlation between Plk1 mRNA and protein expression was investigated using a Spearman rank correlation test. Associations between Plk1 expression, TP53 mutations and cleaved caspase 3 staining were analysed using Kruskall Wallis test; a Spearman rank correlation test was used to identify the correlation between Plk1 and CA IX. The association with clinicopathological parameters was determined using Kruskall Wallis test or Mann Witney U-test for continuous variables (i.e. Plk1 and CA IX expression) and Fisher's exact test or χ2 analysis for categorical variables (i.e. cleaved caspase 3 expression and TP53 status). Differences in overall survival (OS) and progression free survival (PFS) between patient groups were determined by Kaplan-Meier analysis and univariate Cox regression. A multivariate Cox proportional-hazard model was conducted to identify independent prognostic markers, presented as hazard ratio (HR) and 95% confidence interval (CI).
Results
Plk1 mRNA and protein expression in NSCLC adenocarcinoma samples
Quantitative RT-PCR was performed to determine the relative Plk1 mRNA expression level in 66 NSCLC adenocarcinoma samples and 4 corresponding healthy/normal lung tissue samples. Plk1 mRNA expression was detected in all specimens, including healthy lung tissue samples. Interestingly, NSCLC tissues expressed a significantly higher level of Plk1 mRNA than adjacent healthy lung tissues (P = 0.007) (Table 2). The average Plk1 mRNA expression in tumor samples was 5.73-fold higher (range 0.742-18.846) compared to normal samples.
Association between Plk1 expression levels and clinicopathological parameters of NSCLC patients.
| Patient characteristic | Plk1 mRNA expression | Plk1 protein expression | ||||
|---|---|---|---|---|---|---|
| Mean ± SD | P-value | Negative/weak | Moderate | Strong | P-value | |
| Tissue | ||||||
| Control sample | 1.51 ± 0.70 | 0.007 | 16 (100%) | 0 (0.0%) | 0 (0.0%) | < 0.001 |
| Tumor sample | 5.73 ± 4.40 | 33 (34.7%) | 32 (33.7%) | 30 (31.6%) | ||
| Age | ||||||
| < 60 years | 5.23 ± 3.79 | 0.368 | 21 (63.6%) | 12 (37.5%) | 13 (43.3%) | 0.084 |
| > 60 years | 6.21 ± 4.91 | 12 (36.4%) | 20 (62.5%) | 17 (56.7%) | ||
| Gender | ||||||
| Female | 6.06 ± 4.58 | 0.379 | 22 (66.7%) | 22 (68.8%) | 20 (66.7%) | 0.979 |
| Male | 5.03 ± 4.00 | 11 (33.3%) | 10 (31.3%) | 10 (33.3%) | ||
| Smoking behavior | ||||||
| Non-smoker | 2.51 ± 1.34 | 0.001 | 3 (12.0%) | 2 (7.1%) | 2 (7.1%) | 0.772 |
| Smoker | 5.89 ± 4.50 | 22 (88.0%) | 26 (92.9%) | 26 (92.9%) | ||
| Clinical stage | ||||||
| I | 5.69 ± 4.63 | 0.812 | 15 (45.5%) | 12 (37.5%) | 16 (53.3%) | 0.666 |
| II | 5.09 ± 3.21 | 8 (24.2%) | 10 (31.3%) | 7 (23.3%) | ||
| III | 6.20 ± 4.98 | 9 (27.3%) | 8 (25.0%) | 4 (13.3%) | ||
| IV | 7.17 ± 6.21 | 1 (3.0%) | 2 (6.3%) | 3 (10.0%) | ||
| Tumor classification | ||||||
| T1 | 5.88 ± 5.11 | 0.949 | 8 (24.2%) | 9 (28.1%) | 13 (43.3%) | 0.289 |
| T2 | 5.91 ± 4.08 | 14 (42.4%) | 14 (43.8%) | 10 (33.3%) | ||
| T3 | 5.16 ± 4.04 | 9 (27.3%) | 5 (15.6%) | 7 (23.3%) | ||
| T4 | 6.15 ± 4.62 | 2 (6.1%) | 4 (12.5%) | 0 (0.0%) | ||
| N0 | 5.63 ± 4.36 | 0.959 | 23 (69.7%) | 22 (68.8%) | 20 (66.7%) | 0.999 |
| N1 | 6.02 ± 4.51 | 6 (18.2%) | 6 (18.8%) | 6 (20.0%) | ||
| N2 | 5.83 ± 4.91 | 4 (12.1%) | 6 (20.0%) | 4 (13.3%) | ||
| M0 | 5.63 ± 4.34 | 0.513 | 32 (97.0%) | 29 (90.6%) | 27 (90.0%) | 0.496 |
| M1 | 6.98 ± 5.40 | 1 (3.0%) | 3 (9.4%) | 3 (10.0%) | ||
| Metastasis during follow-up | ||||||
| No | 6.13 ± 4.60 | 0.426 | 17 (51.5%) | 15 (46.9%) | 18 (60.0%) | 0.577 |
| Yes | 5.26 ± 4.16 | 16 (48.5%) | 17 (53.1%) | 12 (40.0%) | ||
| Differentiation | ||||||
| Poor | 8.13 ± 5.46 | 0.004 | 8 (24.2%) | 8 (25.0%) | 10 (33.3%) | 0.779 |
| Moderate | 5.63 ± 3.65 | 10 (30.3%) | 13 (40.6%) | 10 (33.3%) | ||
| Well | 3.90 ± 3.07 | 15 (45.5%) | 11 (34.4%) | 10 (33.3%) | ||
Upper row: Plk1 expression in control samples versus tumor samples. Other rows: associations between Plk1 expression in tumor samples and clinicopathological parameters of NSCLC patients. Relative Plk1 mRNA expression levels were calculated according to the Ct method of the qbasePLUS software and plotted against normal tissue. For Plk1 protein expression, an IRS score was calculated by multiplying the staining intensity score and % positive cells group. Cases were grouped as Plk1 negative (IRS 0), weak Plk1 positive (IRS 1-3), moderate Plk1 positive (IRS 4-6) or strong Plk1 positive (IRS 7-12).
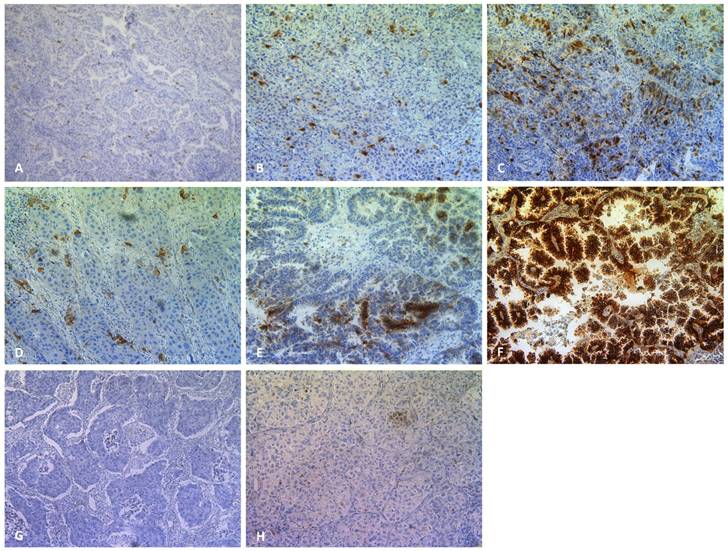
In addition to the Plk1 mRNA expression level, immunohistochemical analysis was performed to evaluate Plk1 protein expression in 95 NSCLC tumor samples and 16 healthy lung specimens from the same patients. Figure 1 shows representative Plk1 immunostaining patterns, with Plk1 expression located in both the nucleus and the cytoplasm. The Plk1 protein level was significantly higher in NSCLC tissues compared to control samples (P < 0.01) (Table 2). While in healthy control samples, no (n=10, 62.5%) or weak (n=6, 37.5%) positive staining was detected, NSCLC adenocarcinomas showed weak (n=33, 34.7%), moderate (n=32, 33.7%) or strong (n=30, 31.6%) Plk1 expression. Both intensity and percentage of Plk1 positive cells varied widely within a tumor section and between tumor samples. A significant correlation was demonstrated between Plk1 expression at the mRNA and protein level (P < 0.001, R2 = 0.497).
Plk1 (200x), CA IX (200x) and cleaved caspase 3 (200x) staining in primary NSCLC. Representative sections of NSCLC tumor samples classified as (A) weak, (B) moderate, (C) strong Plk1 expression. A weak, moderate and strong CA IX positive tumor sample is shown in (D),(E) and (F), respectively. A cleaved caspase 3 negative and positive tumor sample is shown in (G) and (H), respectively.
Associations between Plk1 expression and clinicopathological parameters
Table 2 summarizes the Plk1 mRNA and protein expression data linked to the patients' clinicopathological parameters. Overall, Plk1 mRNA expression showed no association with age, gender, clinical stage, pathological stage or metastasis (P > 0.368). Interestingly, Plk1 mRNA expression was associated with differentiation grade (P = 0.004), being predominantly present in poorly differentiated tumor samples. In addition, significantly higher Plk1 mRNA expression levels were observed in the group of smokers versus non-smokers (P = 0.001). No statistically significant associations were found between Plk1 protein expression levels and clinicopathological characteristics (P > 0.084).
Hypoxia, apoptotic cell death and TP53 status in NSCLC
Hypoxic regions and the presence of apoptotic cells were determined by immunohistochemical staining using antibodies against the CA IX and cleaved caspase 3 proteins, respectively (Figure 1). As shown in Table 3, hypoxia was observed in 96% of all neoplastic tissues, with CA IX expression ranging from weak/moderate (60%) to strong (36%). Only 4 NSCLC samples were negative for the hypoxia marker. In the healthy control group, 14 patients (88%) were negative for CA IX, while weak CA IX expression was observed in only 2 patients (12%). As such, hypoxic regions were significantly more prevalent in tumor samples compared to healthy tissue (P < 0.001).
Association between CA IX expression, cleaved caspase 3 expression, TP53 mutation status and clinicopathological parameters of NSCLC patients.
| Patient characteristic | CA IX protein expression | Cleaved caspase 3 protein expression | TP53 gene mutation analysis | |||||||
|---|---|---|---|---|---|---|---|---|---|---|
| - | + | ++ | P-value | - | + | P-value | WT | MT | P-value | |
| Tissue | ||||||||||
| Control sample | 14 (88.0%) | 2 (12.0%) | 0 (0.0%) | < 0.001 | 10 (62.5%) | 6 (37.5%) | 0.427 | / | / | / |
| Tumor sample | 4 (4.3%) | 56 (59.6%) | 34 (36.2%) | 49 (50.5%) | 48 (49.5%) | 40 (58.0%) | 29 (42.0%) | |||
| Age | ||||||||||
| < 60 years | 2 (50.0%) | 28 (50.0%) | 17 (50.0%) | 1.000 | 24 (49.0%) | 23 (47.9%) | 1.000 | 19 (47.5%) | 14 (48.3%) | 1.000 |
| > 60 years | 2 (50.0%) | 28 (50.0%) | 17 (50.0%) | 25 (51.0%) | 25 (52.1%) | 21 (52.5%) | 15 (51.7%) | |||
| Gender | ||||||||||
| Female | 2 (50.0%) | 38 (67.9%) | 20 (58.8%) | 0.579 | 34 (69.4%) | 30 (62.5%) | 0.525 | 28 (70.0%) | 21 (72.4%) | 1.000 |
| Male | 2 (50.0%) | 18 (32.1%) | 14 (41.2%) | 15 (30.6%) | 18 (37.5%) | 12 (30.0%) | 8 (27.6%) | |||
| Smoking behavior | ||||||||||
| Non-smoker | 0 (0.0%) | 2 (4.2%) | 5 (17.2%) | 0.124 | 5 (11.9%) | 2 (4.9%) | 0.433 | 4 (12.5%) | 1 (3.8%) | 0.367 |
| Smoker | 3 (100%) | 46 (95.8%) | 24 (82.8%) | 37 (88.1%) | 39 (95.1%) | 28 (87.5%) | 25 (96.2%) | |||
| Clinical stage | ||||||||||
| I | 3 (75.0%) | 25 (44.6%) | 13 (38.2%) | 0.247 | 18 (36.7%) | 25 (52.1%) | 0.064 | 16 (40.0%) | 11 (37.9%) | 0.990 |
| II | 0 (0.0%) | 18 (32.1%) | 8 (23.5%) | 17 (34.7%) | 9 (18.8%) | 11 (27.5%) | 9 (31.0%) | |||
| III | 0 0.0%) | 11 (19.6%) | 10 (29.4%) | 9 (18.4%) | 13 (27.1%) | 9 (22.5%) | 6 (20.7%) | |||
| IV | 1 (25.0%) | 2 (3.6%) | 3 (8.8%) | 5 (10.2%) | 1 (2.1%) | 4 (10.0%) | 3 (10.3%) | |||
| Tumor classification | ||||||||||
| T1 | 1 (25.0%) | 21 (37.5%) | 10 (29.4%) | 0.562 | 12 (24.5%) | 20 (41.7%) | 0.321 | 13 (32.5%) | 7 (24.1%) | 0.796 |
| T2 | 3 (75.0%) | 18 (32.1%) | 15 (44.1%) | 22 (44.9%) | 15 (31.3%) | 15 (37.5%) | 11 (37.9%) | |||
| T3 | 0 (0.0%) | 14 (25.0%) | 6 (17.6%) | 12 (24.5%) | 10 (20.8%) | 10 (25.0%) | 10 (34.5%) | |||
| T4 | 0 (0.0%) | 3 (5.4%) | 3 (8.8%) | 3 (6.1%) | 3 (6.3%) | 2 (5.0%) | 1 (3.4%) | |||
| N0 | 3 (75.0%) | 41 (73.2%) | 19 (55.9%) | 0.349 | 31 (63.3%) | 35 (72.9%) | 0.315 | 27 (67.5%) | 19 (65.5%) | 0.720 |
| N1 | 0 (0.0%) | 9 (16.1%) | 10 (29.4%) | 12 (24.5%) | 6 (12.5%) | 7 (17.5%) | 7 (24.1%) | |||
| N2 | 1 (25.0%) | 6 (10.7%) | 5 (14.7%) | 6 (12.2%) | 7 (14.5%) | 6 (15.0%) | 3 (10.3%) | |||
| M0 | 3 (75.0%) | 53 (94.6%) | 31 (91.2%) | 0.327 | 43 (87.8%) | 47 (97.9%) | 0.111 | 36 (90.0%) | 26 (89.7%) | 1.000 |
| M1 | 1 (25.0%) | 3 (5.4%) | 3 (8.8%) | 6 (12.2%) | 1 (2.1%) | 4 (10.0%) | 3 (10.3%) | |||
| Differentiation | ||||||||||
| Poor | 0 (0.0%) | 17 (30.4%) | 8 (23.5%) | 0.074 | 10 (20.4%) | 17 (35.4%) | 0.155 | 11 (27.5%) | 8 (27.6%) | 0.893 |
| Moderate | 3 (75.0%) | 22 (39.3%) | 8 (23.5%) | 21 (42.9%) | 13 (27.1%) | 13 (32.5%) | 8 (27.6%) | |||
| Well | 1 (25.0%) | 17 (30.4%) | 18 (62.9%) | 18 (36.7%) | 18 (37.5%) | 16 (40.0%) | 13 (44.8%) | |||
| Metastasis during follow-up | ||||||||||
| No | 2 (50.0%) | 33 (58.9%) | 13 (38.2%) | 0.163 | 23 (46.9%) | 28 (58.3%) | 0.312 | 19 (47.5%) | 16 (55.2%) | 0.628 |
| Yes | 2 (50.0%) | 23 (41.1%) | 21 (61.8%) | 26 (53.1%) | 20 (41.7%) | 21 (52.5%) | 13 (44.8%) | |||
Upper row: CA IX expression, cleaved caspase 3 expression and TP53 mutations in control samples versus tumor samples. Other rows: associations between CA IX expression, cleaved caspase 3 expression or TP53 mutations in tumor samples and clinicopathological parameters of NSCLC patients. For CA IX staining: - negative, + weak/moderate positive, ++ strong positive. For cleaved caspase 3 staining: - < 5% positive cells, + > 5% positive cells. For TP53 status: WT wild type, MT mutant.
Cleaved caspase 3 was ubiquitously expressed in both NSCLC and control samples. No difference in expression level between normal versus malignant tissues was observed for this apoptotic marker (P = 0.427) (Table 3).
In order to detect mutations in the TP53 gene, next generation sequencing was successfully performed on 69 NSCLC samples. A total of 33 mutations, consisting of 29 missense mutations and 4 nonsense mutations, were detected in 29 patients (40.0%). One patient harbored both a nonsense and missense mutation (R196X/R110L), one patient showed 2 missense mutations (V157F/V172D) and one patient had three missense mutations (G245C/G266V/R280G) in the TP53 gene. In addition, one insertion (c.1162_1163insT) was identified. For statistical analysis, samples harboring a TP53 nonsense or missense mutation, affecting p53's normal function, were classified as TP53 mutant using the MUT-TP53 2.0 tool.
Association between TP53 status, apoptotic cell death, hypoxia and clinicopathological parameters
The patients' clinicopathological parameters were associated with CA IX expression, cleaved caspase 3 expression and the TP53 mutation status (Table 3). A trend towards an association between CA IX immunostaining and differentiation grade was observed (P = 0.074). Well differentiated tumors expressed higher levels of CA IX compared to well differentiated tumor tissues. No associations were found between the hypoxic marker and age, gender, smoking behavior, clinical stage, pathological stage, lymph node invasion and metastasis (P > 0.124).
Concerning cleaved caspase 3 expression, a trend for an association could only be established with clinical stage (P = 0.064). Apoptotic cell death was not associated with age, gender, smoking behavior, TNM stage, metastasis or differentiation status (P > 0.111).
No associations were found between clinicopathological features and TP53 status (P > 0.367).
Correlation between Plk1 expression, hypoxia, apoptotic cell death and TP53 status
As previous studies reported that Plk1 phosphorylates p53, resulting in the inhibition of its pro-apoptotic function, we investigated the relationship between (i) Plk1 expression, (ii) TP53 mutations and (iii) induction of apoptotic cell death in NSCLC samples. Plk1 was significantly upregulated at both the mRNA and protein level in TP53 mutated samples compared to TP53 wild type NSCLC tissues (P = 0.050 and P = 0.049 for Plk1 mRNA and protein expression, respectively). The mean Plk1 mRNA expression level was 1.47-fold higher in TP53 mutated samples compared to TP53 wild type samples. For Plk1 protein expression, samples with mutant TP53 showed a mean IRS score of 5.97, while in TP53 wild type samples the mean IRS value was 4.25. As such, elevated Plk1 expression levels could be, at least in part, due to a loss of p53 function. More apoptosis was induced in NSCLC samples with higher Plk1 mRNA expression levels compared to weak Plk1 mRNA expressing tissues (P = 0.015). No association was found between Plk1 protein expression and cleaved caspase 3 staining (P = 0.959).
In our study population, no correlation was found between Plk1 mRNA/protein expression and CA IX expression (P > 0.602) (R2 = 0.029 and 0.054, respectively). In addition, oxygen deficiency was not correlated with the presence of TP53 mutations or cleaved caspase 3 staining (P > 0.455).
Correlation between Plk1, CA IX, apoptotic cell death, TP53 mutation status and survival
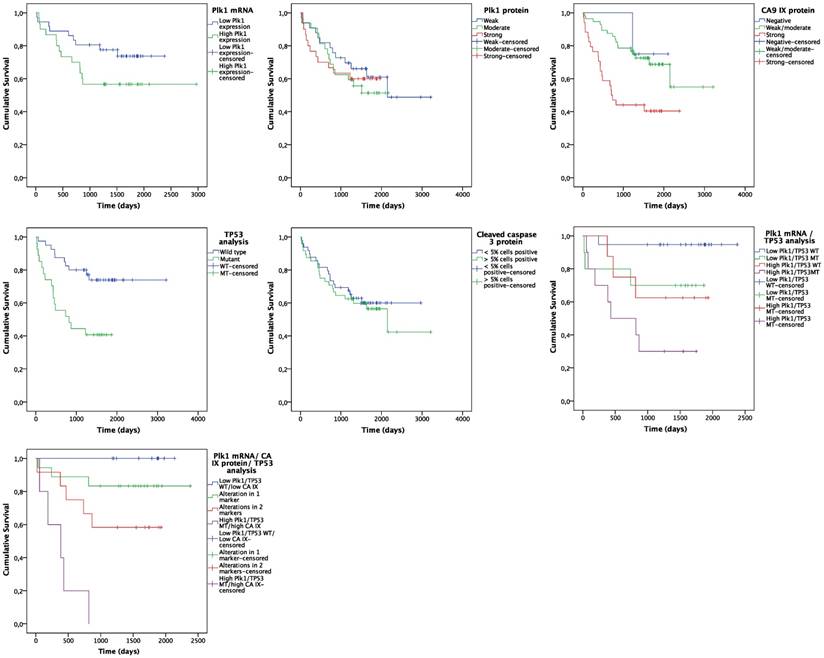
Follow up data were available for all 98 NSCLC patients. At the end of the observation period, 41 patients (41.8%) were deceased and 34 patients (34.7%) showed disease progression. Kaplan-Meier analysis was used to assess OS and PFS probability for Plk1 expression, CA IX expression (i.e. hypoxia), cleaved caspase 3 expression (i.e. apoptosis induction) and TP53 mutation status (Figure 2). For the Kaplan-Meier plot, NSCLC tissues were divided into a low Plk1 mRNA expression group (n = 35, 53.0%) and a high Plk1 mRNA expression group (n = 31, 47.0%), based on the median Plk1 mRNA expression in tumor samples (i.e. 4.55-fold overexpression). The mean OS was reduced from 1942 ± 139 days in the low positive Plk1 mRNA group to 1861 ± 223 days in the high positive Plk1 mRNA group (Figure 2A). As such, Plk1 mRNA expression was a significant predictor of worse OS (P = 0.001, HR = 1.150) (Table 4). No statistically significant difference in OS was observed between NSCLC patients with and without Plk1 protein overexpression (P = 0.616, HR = 1.024) (Figure 2B). Interestingly, our data also demonstrated that both hypoxia and TP53 mutations are correlated with OS of NSCLC patients (Figure 2C and 2E). Patients with strong CA IX scores lived significantly shorter than patients with negative or low CA IX expression levels in their tumor samples (P = 0.002, HR = 2.560) and TP53 mutations were also clearly correlated with a significantly worse OS (P = 0.004, HR = 3.240) (Table 4). Cleaved caspase 3 expression levels had no impact on OS of NSCLC patients (P = 0.667, HR = 1.146) (Figure 2D).
Kaplan-Meier curves for OS. Curves are based on (A) Plk1 mRNA expression, (B) Plk1 protein expression, (C) CA IX protein expression, (D) TP53 mutations, (E) cleaved caspase 3 expression, (F) combination of Plk1 mRNA expression and TP53 mutations and (G) combination of Plk1 mRNA expression, CA IX protein expression and TP53 mutations.
Survival analysis of NSCLC patients.
| Univariate survival analysis | Multivariate Cox regression | |||||
|---|---|---|---|---|---|---|
| HR | P-value | 95% CI | HR | P-value | 95% CI | |
| Plk1 mRNA expression | 1.150 | 0.001 | 1.055 - 1.253 | 1.126 | 0.075 | 0.988 - 1.283 |
| CA IX expression | 2.560 | 0.002 | 1.396 - 4.675 | 6.484 | 0.010 | 1.566 - 26.838 |
| TP53 status | 3.240 | 0.004 | 1.456 - 7.098 | 5.766 | 0.011 | 1.506 - 22.079 |
| Clinical stage | 2.470 | 0.006 | 1.263 - 4.879 | 5.680 | 0.038 | 1.104 - 29.225 |
| Lymph node metastasis | 1.466 | 0.050 | 1.000 - 2.140 | |||
| Distant metastasis | 3.635 | 0.002 | 1.521 - 7.866 | |||
HR: Hazard Ratio, 95% CI: 95% confidence interval.
Univariate analysis indicated that, besides Plk1 mRNA expression, CA IX protein expression and TP53 mutations, clinical stage (P = 0.006, HR = 2.470), lymph node metastasis (P = 0.050, HR = 1.466) and distant metastasis (P = 0.002, HR = 3.635) were also significant predictors of worse OS (Table 4). In addition to univariate analysis, we fitted a Cox proportional hazard model with Plk1 mRNA expression as predictor for OS and accounting for potential confounders (i.e. CA IX expression, TP53 status, clinical stage, lymph node metastasis and distant metastasis). Using the stepwise backward model, CA IX expression (P = 0.010, HR = 6.484), TP53 mutations (P = 0.011, HR = 5.766) and clinical tumor stage (P = 0.038, HR = 5.680) were assigned as independent prognostic markers for OS (Table 4). A strong trend was observed for the effect of Plk1 mRNA expression on OS in NSCLC patients, with a HR of 1.126 (P = 0.075) (Table 4).
Interestingly, patients harboring a TP53 mutation together with a Plk1 mRNA overexpression showed a significantly shorter OS time compared to patients with a TP53 mutation or Plk1 overexpression alone (P = 0.003) (Figure 2F). This effect was further enhanced when CA IX positivity was also taken into account.
In addition, we investigated the predictive value of Plk1 expression in combination with hypoxia and the TP53 status in our study population. Treatment data showed that 54.1% of the NSCLC patients received neo-adjuvant and/or adjuvant therapy (i.e. plantinum-based chemotherapy and/or radiotherapy). In both the non-treated and treated group, overall survival was negatively influenced by the biomarker panel (P < 0.030).
No significant effect on PFS was observed according to the patients' Plk1 mRNA/protein expression level, oxygen deficiency, apoptotic cell death or TP53 status, not even when the parameters were combined (P > 0.199).
Discussion
Currently, prognosis of patients with NSCLC is based on specific clinicopathological factors, including histologic tumor type, differentiation status and the presence of metastases. Although TNM stage is being considered as the most important prognostic parameter, there are considerable differences in patient outcome within a similar staging group, even when patients received identical treatments [10, 29]. In order to improve prognostic predictions and to guide treatment options, the identification of additional parameters influencing outcome is required. In recent years, a growing spectrum of proteins that are related to cell proliferation, apoptosis and genomic instability (e.g. KRAS, EGFR, p53, CDKs) have been studied as new potential biomarkers for tumor progression [29, 30]. Nevertheless, inconsistent results were reported in literature and not a single protein marker has been validated for clinical use. Therefore, in the present study, we investigated Plk1 expression levels in relation to TP53 mutations, apoptosis (cleaved caspase 3 expression) and the presence of hypoxic tumor regions (CA IX protein expression) to determine their prognostic potential in NSCLC.
As Plk1 plays a crucial role in cell cycle progression and the cellular stress response, Plk1 overexpression is considered as a prognostic marker and potential target for anti-cancer therapy in various human malignancies [11, 17, 19, 31-34]. To the best of our knowledge, we are the first to investigate the Plk1 expression level in combination with TP53 mutations and hypoxia in NSCLC. Plk1 upregulation was reported at both the mRNA and protein level in the majority of NSCLC adenocarcinoma samples. The mean Plk1 mRNA expression level was 5.73-fold higher (range 0.742-18.846) in tumor samples compared to healthy lung tissue and was significantly more frequent observed in poorly differentiated neoplasms. Interestingly, the group of non-smokers showed higher Plk1 mRNA levels compared to the non-smokers in our study population. In the study of Wolf et al., the normalized Plk1 mRNA expression after Northern blot analysis ranged between 0.08 and 0.11 density units for normal lung tissues, while in NSCLC adenocarcinoma samples this range was between 0.02 and 7.10 [10]. In addition, immunostaining showed Plk1 protein overexpression in 64% of the NSCLC patients. This result is in line with the study of Wang et al., who also reported elevated Plk1 protein levels in 58% of the NSCLC patients [11]. In our study, Plk1 positivity was mainly located in the nucleus and showed high inter-and intratumor variability in both % of positive cells and staining intensity. This heterogeneity could reflect, at least in part, different proliferation rates of the cells. It is also plausible that the most intensely stained cells are those in the G2/M phase or that Plk1 upregulation is caused by different mechanisms [12, 17].
No significant relationship between Plk1 protein levels and clinicopathological factors could be established. In contrast, Wang et al. showed correlations between Plk1 protein expression and poor tumor differentiation, advanced clinical stage and lymph node metastases. They included NSCLC samples of different histological types, while we only investigated adenocarcinomas [11]. Plk1 overexpression is also reported in a variety of other human malignancies, including head and neck carcinoma, melanoma, colorectal cancer, hepatocellular carcinoma, bladder carcinoma, ovarian cancer and glioblastoma. In these studies, high Plk1 expression levels were mainly correlated with clinical stage, histological grade and (lymph node) metastasis [14, 16, 19, 31, 34-36]. However, other research groups were not able to reproduce these correlations [10, 12, 13, 37, 38]. These conflicting data suggest that Plk1 plays critical roles in tumor development and progression, but that Plk1 expression should not be considered as the sole prognostic factor. As such, a prognostic panel, consisting of Plk1 and additional molecular biomarkers, might further improve prediction of prognosis.
In order to define this 'golden' combination, it is crucial to understand the exact mechanism by which deregulated Plk1 levels contribute to carcinogenesis. At first, it was thought that Plk1 overexpression was a consequence of enhanced mitotic activity in neoplastic cells, rather than a cause of oncogenic transformation. However, Plk1 positivity was observed in much more tumor cells than those expected to be in G2/M phase. Subsequently, amplification of region 16p12, situated at the locus of the human Plk1 gene, was described in gastric, breast, colorectal and esophageal cancer. However, not all Plk1 overexpressing tumors showed Plk1 gene amplification, indicating alternative mechanisms [14, 17]. Furthermore, it was reported that the Plk1 pathway and p53 signaling are highly cross-linked. P53 is regarded as the guardian of the genome and represses transcription and activity of Plk1 in a cell cycle specific manner and in response to DNA damage. Meanwhile, it has also been proven that p53 is a target of Plk1, with Plk1 inhibiting its tumorsuppressor function [21]. Since TP53 is the most frequently altered gene in human cancer, it was hypothesized that the majority of Plk1 overexpression might be due to the loss of functional p53. Indeed, in women with breast cancer, it was demonstrated that there was a 3.5 greater likelihood of having detectable Plk1 immunostaining if breast tumor samples harbor a mutation in the TP53 gene [12]. In agreement with these observations, our results also indicated more Plk1 overexpression in TP53 mutated samples compared to wild type NSCLC tissues. Plk1 expression has also been reported to be significantly associated with detectable p53 protein expression, which is associated with mutant TP53 [39, 40].
Next, we investigated the relationship between Plk1, the TP53 status and induction of apoptosis. Our results showed more cleaved caspase 3 immunostaining in tumor samples with higher Plk1 mRNA levels, possibly due to p53 independent pathways, since no correlation was found between the TP53 status and apoptosis. Intuitively, less apoptosis would be expected in cancer cells with high Plk1 expression levels, so additional experiments are warranted to further elucidate the underlying molecular mechanisms.
Concerning the link between Plk1 and hypoxia, Ward et al. recently reported a p53 dependent epigenetic modification of Plk1 under hypoxic conditions in hepatocellular and osteocarcinoma cell lines. They proposed a model in which wild type p53 leads to downregulation of Plk1 transcription under hypoxia by recruiting DNA methyltransferases (DNMTs) and/or histone deacetylases (HDACs). Consequently, absence of functional p53 led to Plk1 upregulation under reduced oxygen conditions [26]. In our immunohistochemical study, normal lung tissues stained negative to moderate for the hypoxic marker CA IX, while weak to very strong positivity was observed in NSCLC samples. These results are in accordance with other studies, reporting CA IX overexpression in NSCLC [41-45].
It has been shown in a variety of cancer types that quantification of Plk1 expression, CA IX expression, cleaved caspase 3 expression or the occurrence of TP53 mutations had a prognostic value as single biomarker [41, 42, 44-49]. In agreement with these data, our study demonstrated that Plk1 mRNA expression, the presence of hypoxic tumor regions and mutant TP53 were significant predictors of worse overall survival in the univariate analysis. However, no significant difference in overall survival between NSCLC patients with and without Plk1 protein overexpression was found. Contrarily, a significant correlation was demonstrated between Plk1 mRNA and protein expression, although this was not absolute as indicated by the correlation coefficient (R2 = 0.479). As described above, strong intratumor heterogeneity in Plk1 protein expression was observed. For mRNA expression analysis, only tumor regions with a minimum of 80% tumor cells were included. As such, a global view of Plk1 mRNA expression was obtained. Using multivariate analysis, correcting for CA IX expression, TP53 mutations, clinical stage, lymph node metastasis and distant metastasis, hypoxic regions, TP53 mutations and clinical tumor stage were assigned as independent prognostic markers for overall survival. Furthermore, a strong trend towards Plk1 mRNA expression as independent prognostic marker for NSCLC adenocarcinoma patients was detected.
Interestingly, elevated Plk1 mRNA levels combined with a TP53 mutation were associated with worse patient outcome, much more so than in patients harboring either one. This is in line with the studies of Kanjai et al. and King et al., who reported a significantly worse prognosis of patients with both Plk1- and p53-positive tumors, compared to Plk1- and p53- negative or Plk1 negative and p53 positive tumors [12, 39, 40]. Interestingly, this effect was even stronger when CA IX positivity was also taken into account. Patients with high Plk1 mRNA and CA IX protein expression levels and harboring a mutation in the TP53 gene had a significantly shorter survival time than those with aberrant expression patterns in only one or two of these parameters. When patients were stratified by treatment strategy, overall survival was also negatively influenced by Plk1 mRNA overexpression in combination with hypoxia and the presence of a TP53 mutation. This result suggests that patients with aberrant expression of the three markers would not benefit from standard (neo)adjuvant therapy.
As a result, our study paves the way for new combination strategies with Plk1 inhibitors. The observed Plk1 overexpression could be, at least partially, the result of loss of functional p53. Mutant TP53 cells are able to evade apoptosis and progress into more malignant variants that are resistant to conventional treatments. Previous studies reported that reactivation of mutant p53, using small molecules (such as APR-246 (PRIMA-1MET)) that restore p53's wild-type conformation, results in the induction of the p53 dependent apoptotic pathway [50]. Moreover, it has been published that the efficacy of PRIMA-1MET is enhanced under hypoxic conditions [51]. Combination treatments between Plk1 inhibitors and reactivators of p53 could therefore result in Plk1 downregulation and activation of the apoptotic pathway under both normal and reduced oxygen conditions.
In conclusion, we found that Plk1 and CA IX levels were frequently upregulated in NSCLC adenocarcinoma samples when compared to normal lung tissue. Moreover, the combined evaluation of Plk1 mRNA expression, CA IX protein expression and TP53 mutations shows promise as a prognostic panel in NSCLC adenocarcinoma patients. Importantly, these results will have to be confirmed in a larger study population in order to assess the true potential and applicability of this biomarkerpanel.
Abbreviations
Plk1: Polo-like kinase 1; CA IX: Carbonic anhydrase IX; NSCLC: Non-small cell lung cancer; HIF-1: Hypoxia inducible factor 1α; FFPE: Formaldehyde fixed-paraffin embedded; IRS: Immunoreactivity scoring system; OS: Overall survival; PFS: Progression free survival; HR: Hazard ratio; CI: Confidence interval; DNMTs: DNA methyltransferases; HDACs: Histone deacetylases.
Acknowledgements
C. Deben and J. Jacobs are funded by the Agency for Innovation by Science and Technology, Flanders, Grant Nos. 111063 (C. Deben) and 120822 (J. Jacobs), IWT (http://www.iwt.be). A. Wouters is funded by Research Foundation Flanders (FWO-Vlaanderen, Belgium; Grant No. 1297813N) as a postdoctoral fellow. The authors would like to thank Multiplicom (Niel, Belgium) for funding the TP53 MASTRTM kit and technical assistance, the Tumorbank of the Antwerp University Hospital for providing tissue specimens. Mr. Willy Floren (Wijnegem, Belgium) is greatly acknowledged for his private funding of some of the equipment used in this study.
This work was supported by the University Foundation.
Competing Interests
The authors have declared that no competing interest exists.
References
1. Siegel RL, Miller KD, Jemal A. Cancer statistics, 2016. CA: a cancer journal for clinicians. 2016;66:7-30
2. Zhou C, Wu YL, Chen G, Feng J, Liu XQ, Wang C. et al. Erlotinib versus chemotherapy as first-line treatment for patients with advanced EGFR mutation-positive non-small-cell lung cancer (OPTIMAL, CTONG-0802): a multicentre, open-label, randomised, phase 3 study. The Lancet Oncology. 2011;12:735-42
3. Lapenna S, Giordano A. Cell cycle kinases as therapeutic targets for cancer. Nature reviews Drug discovery. 2009;8:547-66
4. Strebhardt K, Holtrich U, Brauninger A, Karn T, Bohme B, Doermer A. et al. Oncogenic alterations in primary human lung-tumors (review). Oncology reports. 1994;1:195-201
5. Strebhardt K. Multifaceted polo-like kinases: drug targets and antitargets for cancer therapy. Nature reviews Drug discovery. 2010;9:643-60
6. Zitouni S, Nabais C, Jana SC, Guerrero A, Bettencourt-Dias M. Polo-like kinases: structural variations lead to multiple functions. Nature reviews Molecular cell biology. 2014;15:433-52
7. Van den Bossche J, Lardon F, Deschoolmeester V, De Pauw I, Vermorken JB, Specenier P. et al. Spotlight on Volasertib: Preclinical and Clinical Evaluation of a Promising Plk1 Inhibitor. Medicinal research reviews. 2016;36:749-86
8. Hyun SY, Hwang HI, Jang YJ. Polo-like kinase-1 in DNA damage response. BMB reports. 2014;47:249-55
9. Eckerdt F, Yuan J, Strebhardt K. Polo-like kinases and oncogenesis. Oncogene. 2005;24:267-76
10. Wolf G, Elez R, Doermer A, Holtrich U, Ackermann H, Stutte HJ. et al. Prognostic significance of polo-like kinase (PLK) expression in non-small cell lung cancer. Oncogene. 1997;14:543-9
11. Wang ZX, Xue D, Liu ZL, Lu BB, Bian HB, Pan X. et al. Overexpression of polo-like kinase 1 and its clinical significance in human non-small cell lung cancer. The international journal of biochemistry & cell biology. 2012;44:200-10
12. King SI, Purdie CA, Bray SE, Quinlan PR, Jordan LB, Thompson AM. et al. Immunohistochemical detection of Polo-like kinase-1 (PLK1) in primary breast cancer is associated with TP53 mutation and poor clinical outcom. Breast cancer research: BCR. 2012;14:R40
13. Weichert W, Denkert C, Schmidt M, Gekeler V, Wolf G, Kobel M. et al. Polo-like kinase isoform expression is a prognostic factor in ovarian carcinoma. British journal of cancer. 2004;90:815-21
14. Feng YB, Lin DC, Shi ZZ, Wang XC, Shen XM, Zhang Y. et al. Overexpression of PLK1 is associated with poor survival by inhibiting apoptosis via enhancement of survivin level in esophageal squamous cell carcinoma. International journal of cancer Journal international du cancer. 2009;124:578-88
15. Knecht R, Oberhauser C, Strebhardt K. PLK (polo-like kinase), a new prognostic marker for oropharyngeal carcinomas. International journal of cancer Journal international du cancer. 2000;89:535-6
16. Kneisel L, Strebhardt K, Bernd A, Wolter M, Binder A, Kaufmann R. Expression of polo-like kinase (PLK1) in thin melanomas: a novel marker of metastatic disease. Journal of cutaneous pathology. 2002;29:354-8
17. Gray PJ Jr, Bearss DJ, Han H, Nagle R, Tsao MS, Dean N. et al. Identification of human polo-like kinase 1 as a potential therapeutic target in pancreatic cancer. Molecular cancer therapeutics. 2004;3:641-6
18. Weichert W, Kristiansen G, Schmidt M, Gekeler V, Noske A, Niesporek S. et al. Polo-like kinase 1 expression is a prognostic factor in human colon cancer. World journal of gastroenterology. 2005;11:5644-50
19. Han DP, Zhu QL, Cui JT, Wang PX, Qu S, Cao QF. et al. Polo-like kinase 1 is overexpressed in colorectal cancer and participates in the migration and invasion of colorectal cancer cells. Medical science monitor: international medical journal of experimental and clinical research. 2012;18:BR237-46
20. Medema RH, Lin CC, Yang JC. Polo-like kinase 1 inhibitors and their potential role in anticancer therapy, with a focus on NSCLC. Clinical cancer research: an official journal of the American Association for Cancer Research. 2011;17:6459-66
21. Louwen F, Yuan J. Battle of the eternal rivals: restoring functional p53 and inhibiting Polo-like kinase 1 as cancer therapy. Oncotarget. 2013;4:958-71
22. Sur S, Pagliarini R, Bunz F, Rago C, Diaz LA Jr, Kinzler KW. et al. A panel of isogenic human cancer cells suggests a therapeutic approach for cancers with inactivated p53. Proceedings of the National Academy of Sciences of the United States of America. 2009;106:3964-9
23. Brown JM. The hypoxic cell: a target for selective cancer therapy-eighteenth Bruce F. Cain Memorial Award lecture. Cancer research. 1999;59:5863-70
24. Wouters A, Pauwels B, Lardon F, Vermorken JB. Review: implications of in vitro research on the effect of radiotherapy and chemotherapy under hypoxic conditions. The oncologist. 2007;12:690-712
25. Wouters A, Pauwels B, Lambrechts HA, Pattyn GG, Ides J, Baay M. et al. Retention of the in vitro radiosensitizing potential of gemcitabine under anoxic conditions, in p53 wild-type and p53-deficient non-small-cell lung carcinoma cells. International journal of radiation oncology, biology, physics. 2011;80:558-66
26. Ward A, Hudson JW. p53-Dependent and cell specific epigenetic regulation of the polo-like kinases under oxidative stress. PloS one. 2014;9:e87918
27. Deben C, Op de Beeck K, Van den Bossche J, Jacobs J, Wouters A, Van Camp G. et al. MDM2 SNP309 and SNP285 acts as negative prognostic markers for non-small cell lung cancer patients. Submitted.
28. Soussi T, Hamroun D, Hjortsberg L, Rubio-Nevado JM, Fournier JL, Beroud C. MUT-TP53 2.0: a novel versatile matrix for statistical analysis of TP53 mutations in human cancer. Human mutation. 2010;31:1020-5
29. Zhu CQ, Tsao MS. Prognostic markers in lung cancer: is it ready for prime time? Translational lung cancer research. 2014;3:149-58
30. Singhal S, Vachani A, Antin-Ozerkis D, Kaiser LR, Albelda SM. Prognostic implications of cell cycle, apoptosis, and angiogenesis biomarkers in non-small cell lung cancer: a review. Clinical cancer research: an official journal of the American Association for Cancer Research. 2005;11:3974-86
31. Zhang Z, Zhang G, Kong C. High expression of polo-like kinase 1 is associated with the metastasis and recurrence in urothelial carcinoma of bladder. Urologic oncology. 2013;31:1222-30
32. Sun W, Su Q, Cao X, Shang B, Chen A, Yin H. et al. High expression of polo-like kinase 1 is associated with early development of hepatocellular carcinoma. International journal of genomics. 2014;2014:312130
33. Dietzmann K, Kirches E, von B, Jachau K, Mawrin C. Increased human polo-like kinase-1 expression in gliomas. Journal of neuro-oncology. 2001;53:1-11
34. Cheng MW, Wang BC, Weng ZQ, Zhu XW. Clinicopathological significance of Polo-like kinase 1 (PLK1) expression in human malignant glioma. Acta histochemica. 2012;114:503-9
35. Weichert W, Schmidt M, Gekeler V, Denkert C, Stephan C, Jung K. et al. Polo-like kinase 1 is overexpressed in prostate cancer and linked to higher tumor grades. The Prostate. 2004;60:240-5
36. Takai N, Miyazaki T, Fujisawa K, Nasu K, Hamanaka R, Miyakawa I. Expression of polo-like kinase in ovarian cancer is associated with histological grade and clinical stage. Cancer letters. 2001;164:41-9
37. Yamada S, Ohira M, Horie H, Ando K, Takayasu H, Suzuki Y. et al. Expression profiling and differential screening between hepatoblastomas and the corresponding normal livers: identification of high expression of the PLK1 oncogene as a poor-prognostic indicator of hepatoblastomas. Oncogene. 2004;23:5901-11
38. Weichert W, Kristiansen G, Winzer KJ, Schmidt M, Gekeler V, Noske A. et al. Polo-like kinase isoforms in breast cancer: expression patterns and prognostic implications. Virchows Archiv: an international journal of pathology. 2005;446:442-50
39. Jang YJ, Kim YS, Kim WH. Oncogenic effect of Polo-like kinase 1 expression in human gastric carcinomas. International journal of oncology. 2006;29:589-94
40. Takahashi T, Sano B, Nagata T, Kato H, Sugiyama Y, Kunieda K. et al. Polo-like kinase 1 (PLK1) is overexpressed in primary colorectal cancers. Cancer science. 2003;94:148-52
41. Ilie M, Mazure NM, Hofman V, Ammadi RE, Ortholan C, Bonnetaud C. et al. High levels of carbonic anhydrase IX in tumour tissue and plasma are biomarkers of poor prognostic in patients with non-small cell lung cancer. British journal of cancer. 2010;102:1627-35
42. Kon-no H, Ishii G, Nagai K, Yoshida J, Nishimura M, Nara M. et al. Carbonic anhydrase IX expression is associated with tumor progression and a poor prognosis of lung adenocarcinoma. Lung cancer. 2006;54:409-18
43. Kim SJ, Rabbani ZN, Vollmer RT, Schreiber EG, Oosterwijk E, Dewhirst MW. et al. Carbonic anhydrase IX in early-stage non-small cell lung cancer. Clinical cancer research: an official journal of the American Association for Cancer Research. 2004;10:7925-33
44. Kim SJ, Rabbani ZN, Dewhirst MW, Vujaskovic Z, Vollmer RT, Schreiber EG. et al. Expression of HIF-1alpha, CA IX, VEGF, and MMP-9 in surgically resected non-small cell lung cancer. Lung cancer. 2005;49:325-35
45. Giatromanolaki A, Koukourakis MI, Sivridis E, Pastorek J, Wykoff CC, Gatter KC. et al. Expression of hypoxia-inducible carbonic anhydrase-9 relates to angiogenic pathways and independently to poor outcome in non-small cell lung cancer. Cancer research. 2001;61:7992-8
46. Choschzick M, Oosterwijk E, Muller V, Woelber L, Simon R, Moch H. et al. Overexpression of carbonic anhydrase IX (CAIX) is an independent unfavorable prognostic marker in endometrioid ovarian cancer. Virchows Archiv: an international journal of pathology. 2011;459:193-200
47. Liu Z, Yang Z, Jiang S, Zou Q, Yuan Y, Li J. et al. Paxillin and carbonic anhydrase IX are prognostic markers in gallbladder squamous cell/adenosquamous carcinomas and adenocarcinomas. Histopathology. 2014;64:921-34
48. Hu Q, Peng J, Liu W, He X, Cui L, Chen X. et al. Elevated cleaved caspase-3 is associated with shortened overall survival in several cancer types. International journal of clinical and experimental pathology. 2014;7:5057-70
49. Jakubowska K, Guzinska-Ustymowicz K, Famulski W, Cepowicz D, Jagodzinska D, Pryczynicz A. Reduced expression of caspase-8 and cleaved caspase-3 in pancreatic ductal adenocarcinoma cells. Oncology letters. 2016;11:1879-84
50. Bykov VJ, Wiman KG. Mutant p53 reactivation by small molecules makes its way to the clinic. FEBS letters. 2014;588:2622-7
51. Rieber M, Strasberg-Rieber M. Hypoxia, Mn-SOD and H(2)O(2) regulate p53 reactivation and PRIMA-1 toxicity irrespective of p53 status in human breast cancer cells. Biochemical pharmacology. 2012;84:1563-70
Author contact
![]() Corresponding author: Jolien Van den Bossche, Universiteitsplein 1, 2610 Wilrijk, Belgium +32 3 265 25 33 Jolien.VandenBosschebe
Corresponding author: Jolien Van den Bossche, Universiteitsplein 1, 2610 Wilrijk, Belgium +32 3 265 25 33 Jolien.VandenBosschebe