Impact Factor ISSN: 1837-9664

 Global reach, higher impact
J Cancer 2017; 8(9):1507-1516. doi:10.7150/jca.19175 This issue Cite
Research Paper
Implication of Psoas Muscle Index on Survival for Hepatocellular Carcinoma Undergoing Radiofrequency Ablation Therapy
Yukihisa Yuri, Hiroki Nishikawa, Hirayuki Enomoto ![]() , Akio Ishii, Yoshinori Iwata, Yuho Miyamoto, Noriko Ishii, Kunihiro Hasegawa, Chikage Nakano, Takashi Nishimura, Kazunori Yoh, Nobuhiro Aizawa, Yoshiyuki Sakai, Naoto Ikeda, Tomoyuki Takashima, Ryo Takata, Hiroko Iijima, Shuhei Nishiguchi
, Akio Ishii, Yoshinori Iwata, Yuho Miyamoto, Noriko Ishii, Kunihiro Hasegawa, Chikage Nakano, Takashi Nishimura, Kazunori Yoh, Nobuhiro Aizawa, Yoshiyuki Sakai, Naoto Ikeda, Tomoyuki Takashima, Ryo Takata, Hiroko Iijima, Shuhei Nishiguchi
Division of Hepatobiliary and Pancreatic disease, Department of Internal Medicine, Hyogo College of Medicine, Hyogo, Japan
Received 2017-1-14; Accepted 2017-3-26; Published 2017-6-1
Abstract
Aims We aimed to retrospectively examine the impact of pretreatment psoas muscle index (PMI) as determined by computed tomography on survival for treatment naïve hepatocellular carcinoma (HCC) patients who underwent percutaneous radiofrequency ablation (RFA) therapy (n=182; 111 males and 71 females with median age of 70 years).
Patients and methods Optimal cut-off points of PMI in male and female were calculated by receiver operating characteristic analysis for survival. We investigated parameters associated with overall survival (OS) in the univariate and multivariate analyses.
Results The median follow-up period in this study was 4.28 years. For all cases, the 5-year cumulative OS rate after initial RFA was 69.2%. The median (range) value in PMI for male was 6.03 (1.63-9.90) cm2/m2 whereas that for female was 4.06 (1.21-7.32) cm2/m2. Maximum tumor size ranged from 0.7 cm to 3.5 cm (median, 1.5cm). There were 145 patients with single nodule and 37 with multiple nodules. The optimal cut-off point for PMI was 6.31 cm2/m2 in male and 3.91 cm2/m2 in female. The 5-year cumulative OS rates were 51.5% in the decreased PMI group (n=90) and 86.5% in the non-decreased PMI group (n=92) (P<0.0001). In patients with Child-Pugh A (n=137) and Child-Pugh B or C (n=45), similar results were obtained. In the multivariate analysis, presence of decreased PMI (P<0.0001), total bilirubin ≥1.2 mg/dl (P=0.0015) and des-γ-carboxy prothrombin ≥34 mAU/ml (P=0.0089) were found to be significant adverse predictors related to OS.
Conclusion PMI can be useful for predicting outcomes in HCC patients undergoing percutaneous RFA therapy.
Keywords: Hepatocellular carcinoma, Radiofrequency ablation, Psoas muscle index, Prognosis.
Introduction
Hepatocellular carcinoma (HCC) is the second and sixth most deadly malignancy occurring in men and women worldwide. [1] Percutaneous radiofrequency ablation (RFA) therapy, which was introduced in our country in 1999, has shown superior local tumor control efficacies and greater survival benefit and is currently well established as the standard ablative therapy for early-stage HCC. [2-8] Over the past decade, numerous clinical and biochemical predictors have been established in an attempt to more accurately predict clinical outcomes for HCC patients undergoing RFA and assess their survival correctly. [2-8]
Sarcopenia is a clinical entity that is associated with decline of skeletal muscle mass and muscle strength. [9-13] Sarcopenia is closely linked to aging, which is called primary sarcopenia, and it has recently drawn much caution in the clinical settings owing to its significant adverse effect on outcomes. [9-13] Cirrhosis can cause secondary sarcopenia due to dysfunction of protein and energy metabolism in the liver. [10, 12, 13] In daily clinical practice, skeletal muscle mass can be evaluated using bioimpedance analysis, dual energy X-ray absorptiometry, computed tomography (CT) and magnetic resonance imaging (MRI), which are accurate and consistent assessment modalities. [12-16] In the field of liver diseases, CT has been frequently used for assessing the severity of liver diseases such as liver deformity, HCC development and presence of ascites and skeletal muscle mass loss has been demonstrated to be an adverse predictor for HCC patients undergoing surgery in numerous Japanese studies. [12, 14, 17-19] In addition, not only muscle mass but also intramuscular adipose tissue content has been reported to be associated with clinical outcomes after liver transplantation. [20]
However, the effect of skeletal muscle mass on survival for HCC patients undergoing RFA therapy remains unclear. Addressing these clinical problems may be of importance. The aims of this study were therefore to examine the impact of skeletal muscle mass on survival for HCC patients undergoing percutaneous RFA therapy.
Patients and Methods
Patients
Between January 2007 and July 2015, a total of 182 consecutive treatment naïve HCC patients undergoing percutaneous RFA therapy with curative intent were admitted at our department and they were analyzed. In our department, indication for RFA was determined through discussion with surgeons and oncologists and in principal, percutaneous RFA therapy was recommended for HCC patients with the following characteristics as determined by radiologic findings including dynamic CT and MRI and laboratory data after sufficient informed consent: (1) patients with Child-Pugh A or Child-Pugh B (2) tumor size up to 3 cm and tumor number up to 3; (3) the absence of uncontrollable ascites; (4) no obvious tumor invasion into the portal vein or the biliary tract; (5) no extrahepatic metastases and (6) no obvious evidence of bleeding tendency. In cases with maximum tumor size >3 cm, when the patient was ineligible for surgery or did not agree to surgery, RFA therapy was considered. In cases with Child-Pugh C, RFA was performed after full explanation for risk and benefit in RFA therapy. Follow-up observation after initial RFA included periodical blood testing, radiological assessments by ultrasonography (US), CT or MRI for detecting HCC recurrence every 3-6 months. In cases of HCC recurrence, most appropriate therapy was selected for each patient.
For patients with lower serum albumin level (<3.5 g/dl), branched-chain amino acid (BCAA) treatment or late evening snack with BCAA enriched snacks were in consideration after sufficient evaluation of nutritional status. [21-25] For patients with hepatitis virus-related chronic liver injury, antiviral treatments including direct acting antivirals (DAAs), interferon (IFN)-based regimens or nucleoside analogues were also in consideration. [23, 24] Evaluation for muscle mass was conducted using pretreatment psoas muscle index (PMI, cm2/m2) on the CT images. PMI indicates sum of bilateral psoas muscle mass calculated by manual trace at the lumber three level on the CT images divided by height squared. [26] The primary outcome measure was overall survival (OS). We retrospectively investigated the impact of pretreatment PMI after initial RFA therapy on survival. We also investigated parameters associated with OS in the univariate and multivariate analyses. Diagnosis for HCC was as reported previously. [27-29]
The ethical committee meeting in our hospital approved our study protocol and this study strictly followed all regulations of the Declaration of Helsinki.
Percutaneous RFA procedure
Preoperative careful US examination was performed to identify the targeted nodules and to determine the access routes. In most cases, we performed RFA using a cool-tip needle (Radionics Corp., Burlington, MA, USA). RFA was performed under real-time US guidance by well experienced operators for all patients. In some cases, contrast enhanced US was performed for the tumor visibility while performing RFA. In cases with poor visibility of the tip of RFA needle on US, the real-time electromagnetic virtual needle tracking system was used for guidance. [30] A 17-gauge, 2- or 3-cm cooled-tip electrode was inserted with caution by the intercostal or subcostal approach. The ablation time of a single ablation session in RFA was 12 min for the 3-cm electrode and 6 min for the 2-cm electrode in general. We used the artificial ascites technique to prevent collateral thermal injury when the anticipated ablated area for RFA was adjacent to a critical organ such as the hepatic flexure of the colon or the stomach. We also used this technique for ameliorating tumor visibility in cases with targeted nodule located in the hepatic dome area. [2] The ablated lesions were assessed by dynamic CT or MRI 1 and 8 weeks after RFA. Complete ablation of targeted nodule was defined as hypoattenuation of the ablated area including the surrounding liver parenchyma. Complete ablation was confirmed on radiologic findings for all analyzed subjects. No RFA procedure related death was observed.
Definition of recurrent HCC
We defined LTP as the presence of a recurrent HCC nodule adjacent to the ablated lesion after RFA using radiologic findings. HCC recurrence that occurred distantly from the ablated lesion in the same segment was defined as intrahepatic distant recurrence. [2, 29] Extrahepatic HCC recurrence was determined using chest CT scan, whole abdominal CT scan, bone scintigraphy and positron-emission tomography.
Statistical analyses
We compared categorical parameters by Fisher's exact test and continuous parameters by unpaired t-test or Mann-Whitney U test as appropriate. In continuous parameters, receiver operating characteristics (ROC) curve for survival was created with the aim of selecting the optimal cut-off point that is linked to maximal sum of specificity and sensitivity and we classified them into two groups using these cut-off points, which was then considered as dichotomous variants in the analysis. Survival curves were created using the Kaplan-Meier method and compared in the log-rank test. Variables with P value <0.05 in the univariate analysis were finally entered into the multivariate analysis in the logistic regression analysis or the Cox proportional hazards model as appropriate. OS was defined as the interval from the date of initial RFA therapy until death from any cause or the last follow-up visit. Recurrence free survival (RFS) was defined as the interval from the date of initial RFA therapy until the first confirmed HCC recurrence or the last follow-up date in radiological evaluation. Data are shown as the median value (range) unless otherwise mentioned. The significant threshold value was set at P<0.05. Statistical analysis was performed with the JMP 11 (SAS Institute Inc., Cary, NC).
Results
Baseline characteristics
The baseline characteristics of the analyzed subjects (n=182) are presented in table 1. They included 111 males and 71 females with median age (range) of 70 (41-93) years. The median follow-up periods were 4.28 years (range: 0.38-9.81 years). The median (range) value in PMI for male was 6.03 (1.63-9.90) cm2/m2 whereas that for female was 4.06 (1.21-7.32) cm2/m2 (P<0.0001). Maximum tumor size ranged from 0.7 cm to 3.5 cm (median, 1.5cm). In 26 patients (14.3%), small ascites was found on CT images. There were 145 patients with single nodule and 37 with multiple nodules (2 or 3 nodules). As for cause of liver disease, patients were predominantly hepatitis C virus (HCV) (73.6%, 134/182). As for Child-Pugh classification, Child-Pugh A was in the majority (75.3%, 137/182).
Baseline characteristics (n=182).
| Variables | Number or median value (range) |
|---|---|
| Age (years) | 70 (41-93) |
| Gender, male / female | 111 / 71 |
| Cause of liver diseases | |
| HBV / HCV / others | 12 / 134 / 36 |
| Child-Pugh, A / B / C | 137 / 42 / 3 |
| Tumor number, single / multiple | 145 / 37 |
| Maximum tumor size (cm) | 1.5 (0.7-3.5) |
| Body mass index (kg/m2) | 22.5 (14.7-33.1) |
| Presence of ascites, yes / no | 26 / 156 |
| Total bilirubin (mg/dL) | 0.9 (0.3-5.5) |
| Serum albumin (g/dL) | 3.7 (1.8-4.7) |
| Prothrombin time (%) | 80.9 (50.4-108.4) |
| Platelet count (×104/mm3) | 10.2 (2.5-25.3) |
| AST (IU/L) | 43 (16-140) |
| ALT (IU/L) | 35 (10-151) |
| Total cholesterol (mg/dl) † | 150 (74-274) |
| Triglyceride (mg/dl) ‡ | 89 (30-656) |
| Fasting blood glucose (mg/dl) | 100 (65-296) |
| Serum sodium (mmol/l) | 140 (131-145) |
| Serum creatinine (mg/dl) | 0.74 (0.38-6.60) |
| C reactive protein (mg/dl) | 0.1 (0-3.0) |
| Serum ammonia (μg/dl) § | 38 (5-149) |
| BTR ¶ | 4.56 (1.77-17.39) |
| Alpha fetoprotein (ng/ml) | 8.7 (0.6-2593) |
| DCP (mAU/ml) | 26 (5-3460) |
Data are expressed as number or median (range). HBV; hepatitis B virus, HCV; hepatitis C virus, AST; aspartate aminotransferase, ALT; alanine aminotransferase, BTR; branched-chain amino acid to tyrosine ratio, DCP; des-γ-carboxy prothrombin, †; missing data, n=1, ‡; missing data, n=1, §; missing data, n=1, ¶; missing data, n=4
Outcome based ROC analysis for selecting optimal cut-off point in PMI
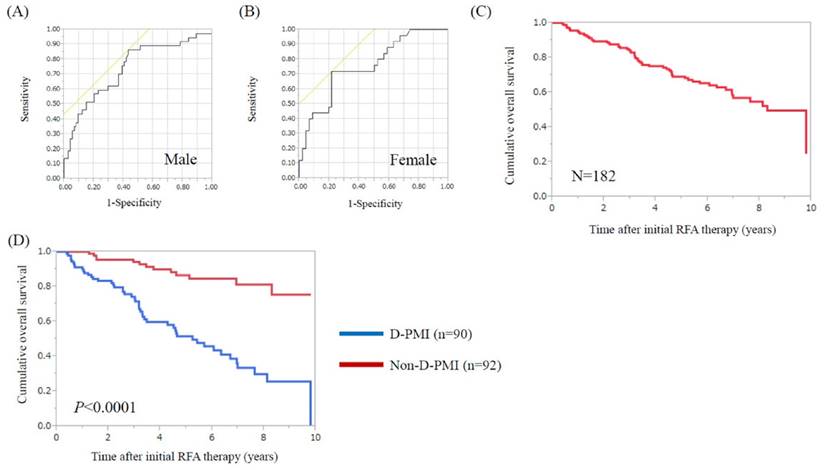
Using ROC analysis for survival, the optimal cut-off point for PMI was 6.31 cm2/m2 in male (area under the ROC (AUC) =0.74, sensitivity=86.5%, specificity=56.8%) and 3.91 cm2/m2 in female (AUC=0.76, sensitivity=72.0%, specificity=78.3%). (Fig. 1A and 1B) When these cut-off points were applied to our subjects, a total of 90 patients (49.5%) had decreased PMI (D-PMI) (63 in male and 27 in female).
ROC analysis of pretreatment PMI for survival in male and female. (A) The optimal cut-off point for PMI was 6.31 cm2/m2 in male (AUC=0.74, sensitivity=86.5%, specificity=56.8%) and (B) 3.91 cm2/m2 in female (AUC=0.76, sensitivity=72.0%, specificity=78.3%). (C) Cumulative OS rate for all cases (n=182). The 1-, 3-, 5- and 7-year cumulative OS rates were 95.0%, 84.3%, 69.2% and 56.9%, respectively. (D) Cumulative OS rates in the D-PMI (n=90) and non-D-PMI (n=92) groups. The 1-, 3-, 5- and 7-year cumulative OS rates were 90.0%, 74.3%, 51.5% and 33.5%, respectively, in the D-PMI group and 100%, 94.2%, 86.5% and 81.2%, respectively, in the non-D-PMI group (P<0.0001).
Comparison of baseline characteristics in patients with D-PMI and without D-PMI
As for comparison of baseline characteristics in patients with D-PMI and without D-PMI, the proportion of male in the D-PMI group was significantly higher than that in the non-D-PMI group (P=0.0134). Body mass index (BMI) (P=0.0020) and serum albumin level (P=0.0217) in the D-PMI group were significantly lower than those in the non-D-PMI group. Serum creatinine in the D-PMI group were significantly higher than those in the non-D-PMI group (P=0.0043) (Table 2).
Comparison of baseline characteristics between the D-PMI group and the non-D-PMI group.
| Variables | D-PMI group (n=90) Number or median value (range) | Non-D-PMI group (n=92) Number or median value (range) | P value |
|---|---|---|---|
| Age (years) | 71 (48-93) | 67 (41-85) | 0.2754 |
| Gender, male / female | 63 / 27 | 48 / 44 | 0.0134 |
| Body mass index (kg/m2) | 22.2 (14.7-33.1) | 23.3 (18.7-30.6) | 0.0020 |
| Tumor number, single / multiple | 75 / 15 | 70 / 22 | 0.2703 |
| Maximum tumor size (cm) | 1.5 (0.7-3.5) | 1.4 (0.7-3.0) | 0.1530 |
| Child-Pugh, A / B or C | 66 / 24 | 71 / 21 | 0.6078 |
| Presence of ascites, yes / no | 15 / 75 | 11 / 81 | 0.4024 |
| Total bilirubin (mg/dl) | 0.9 (0.3-5.5) | 0.9 (0.4-3.4) | 0.8818 |
| Serum albumin (g/dl) | 3.6 (1.8-4.7) | 3.7 (2.7-4.7) | 0.0217 |
| Prothrombin time (%) | 80.4 (50.9-108.4) | 81.1 (50.4-108) | 0.9769 |
| Platelet count (×104/mm3) | 10.0 (3.2-24.2) | 10.45 (2.5-25.3) | 0.4891 |
| Serum creatinine (mg/dl) | 0.79 (0.38-6.6) | 0.69 (0.39-4.6) | 0.0043 |
| C reactive protein (mg/dl) | 0.1 (0-3.0) | 0.1 (0-0.7) | 0.1161 |
| AST (IU/l) | 43.5 (16-140) | 42.5 (16-139) | 0.7447 |
| ALT (IU/l) | 34 (10-117) | 35.5 (12-151) | 0.3929 |
| Total cholesterol (mg/dl) | 149.5 (74-274) | 152 (93-229) | 0.6436 |
| Triglyceride (mg/dl) | 82.5 (30-656) | 96 (30-250) | 0.0698 |
| Fasting blood glucose (mg/dl) | 100 (72-296) | 99.5 (65-229) | 0.6261 |
| BTR | 4.3 (1.77-17.39) | 4.62 (1.8-10.53) | 0.8375 |
| Serum ammonia (μg/dl) | 37 (5-114) | 39 (10-149) | 0.2180 |
| Alpha fetoprotein (ng/ml) | 8.55 (0.6-1293) | 9.4 (1.2-2593) | 0.1804 |
| DCP (mAU/ml) | 31 (5-2700) | 23 (7-3460) | 0.8753 |
Data are expressed as number or median (range). D-PMI; decreased psoas muscle index, AST; aspartate aminotransferase, ALT; alanine aminotransferase, BTR; branched-chain amino acid to tyrosine ratio, DCP; des-γ-carboxy prothrombin
Multivariate analyses of factors linked to the presence of DPMM
Multivariate analyses (logistic regression analysis) using four above significant factors (i.e., gender, BMI, serum albumin and serum creatinine) revealed that gender (P=0.0325), BMI (P=0.0011) and serum albumin (P=0.0071) were independent factors associated with the presence of D-PMI. The Hazard ratios (HRs) and 95% confidence intervals (CIs) of these parameters are detailed in table 3.
Multivariate analyses of factors linked to the presence of D-PMI (n=182).
| Variables | Multivariate analysis | ||
|---|---|---|---|
| Hazard ratio | 95% CI | P value | |
| Gender | 2.036 | 1.061-3.962 | 0.0325 |
| Body mass index (per one kg/m2) | 1.186 | 1.069-1.328 | 0.0011 |
| Serum albumin (per one g/dl) | 2.388 | 1.261-4.728 | 0.0071 |
| Serum creatinine (per one mg/dl) | 0.680 | 0.318-1.120 | 0.1441 |
D-PMI; decreased psoas muscle index, CI; confidence interval.
Cumulative OS rates for all cases and for patients with and without DPMM
For all cases (n=182), the 1-, 3-, 5- and 7-year cumulative OS rates were 95.0%, 84.3%, 69.2% and 56.9%, respectively. (Fig. 1C) The 1-, 3-, 5- and 7-year cumulative OS rates were 90.0%, 74.3%, 51.5% and 33.5%, respectively, in the D-PMI group and 100%, 94.2%, 86.5% and 81.2%, respectively, in the non-D-PMI group (P<0.0001) (Fig. 1D).
Causes for death in the D-PMI group and the non-D-PMI group
In the D-PMI group, during the observation period, 49 patients (54.4%) died. The causes for death were liver failure in 22 patients, HCC progression in 16 patients and miscellaneous causes in 11 patients. In the non-D-PMI group, during the observation period, 13 patients (14.1%) died. The causes for death were liver failure in 2 patients, HCC progression in 8 patients and miscellaneous causes in 3 patients.
Univariate and multivariate analyses of parameters contributing to OS
Univariate analysis identified the following factors as significantly associated with OS for all cases: presence of D-PMI (P<0.0001); Child-Pugh classification (P<0.0001); presence of ascites (P<0.0001); total bilirubin ≥1.2 mg/dl (P<0.0001); serum albumin ≥3.3 g/dl (P=0.0014); prothrombin time ≥70.3 % (P=0.0018); platelet count ≥10.0 ×10⁴/mm3 (P=0.0058); serum creatinine ≥0.84 mg/dl (P=0.0075); C reactive protein ≥0.2 mg/dl (P=0.0120); total cholesterol ≥124 mg/dl (P=0.0017); triglyceride ≥89 mg/dl (P=0.0009); branched-chain amino acid to tyrosine ratio (BTR) ≥4.25 (P=0.0051); serum ammonia ≥24 μg/dl (P=0.0446); and des-γ-carboxy prothrombin (DCP) ≥34 mAU/ml (P=0.0003). (Table 4) The HRs and 95% CIs calculated by using multivariate analysis for the fourteen significant variables (P<0.05) in the univariate analysis are presented in table 4. Presence of D-PMI (P<0.0001), total bilirubin ≥1.2 mg/dl (P=0.0015) and DCP ≥34 mAU/ml (P=0.0089) were found to be significant predictors related to OS in the multivariate analysis.
Univariate and multivariate analyses of factors linked to overall survival (n=182).
| Variables | Number | Univariate analysis | Multivariate analysis | ||
|---|---|---|---|---|---|
| Hazard ratio | 95% CI | P value | |||
| Age ≥61 years, yes / no | 143 / 39 | 0.2300 | |||
| Gender, male / female | 111 / 71 | 0.5297 | |||
| Cause of liver disease, B / C / others | 12 / 134 / 36 | 0.1405 | |||
| Body mass index ≥21.6 kg/m2, yes / no | 120 / 62 | 0.2152 | |||
| Tumor number, single / multiple | 145 / 37 | 0.6351 | |||
| Maximum tumor size ≥1.1 cm, yes / no | 139 / 43 | 0.1511 | |||
| D-PMI, yes / no | 90 / 92 | <0.0001 | 6.867 | 3.498-14.425 | <0.0001 |
| Child-Pugh, A / B or C | 137 / 45 | <0.0001 | 0.810 | 0.236-2.745 | 0.7350 |
| Presence of ascites, yes / no | 26 / 156 | <0.0001 | 2.629 | 0.972-7.457 | 0.0570 |
| Total bilirubin ≥1.2 mg/dl, yes / no | 50 / 132 | <0.0001 | 3.083 | 1.551-6.106 | 0.0015 |
| Serum albumin ≥3.3 g/dl, yes / no | 137 / 45 | 0.0014 | 0.858 | 0.366-1.970 | 0.7200 |
| Prothrombin time ≥70.3 %, yes / no | 136 / 46 | 0.0018 | 0.826 | 0.382-1.837 | 0.6349 |
| Platelet count ≥10.0 ×10⁴/mm3, yes / no | 98 / 84 | 0.0058 | 0.859 | 0.455-1.615 | 0.6369 |
| Serum creatinine ≥0.84 mg/dl, yes / no | 58 / 124 | 0.0075 | 1.325 | 0.731-2.386 | 0.3506 |
| Serum sodium ≥142 mmol/l, yes / no | 43 / 139 | 0.4428 | |||
| C reactive protein ≥0.2 mg/dl, yes / no | 43 / 139 | 0.0120 | 1.312 | 0.677-2.443 | 0.4115 |
| AST ≥51 IU/L, yes / no | 69 / 113 | 0.3546 | |||
| ALT ≥36 IU/L, yes / no | 89 / 93 | 0.2068 | |||
| Total cholesterol ≥124 mg/dl, yes / no | 139 / 42 | 0.0017 | 0.549 | 0.269-1.145 | 0.1081 |
| Triglyceride ≥89 mg/dl, yes / no | 92 / 89 | 0.0009 | 0.734 | 0.400-1.315 | 0.3012 |
| Fasting blood glucose ≥88 mg/dl, yes / no | 164 / 18 | 0.1095 | |||
| BTR ≥4.25, yes / no | 102 / 76 | 0.0051 | 0.981 | 0.515-1.859 | 0.9532 |
| Serum ammonia ≥24 μg/dl, yes / no | 149 / 32 | 0.0446 | 1.946 | 0.827-5.168 | 0.1317 |
| Alpha fetoprotein ≥243 ng/ml, yes / no | 15 / 167 | 0.0546 | |||
| DCP ≥34 mAU/ml, yes / no | 80 / 102 | 0.0003 | 2.194 | 1.215-4.062 | 0.0089 |
Data are expressed as number or median (range). In each continuous parameter, cut-off point was determined by ROC analysis for survival. D-PMI; decreased psoas muscle index. AST; aspartate aminotransferase, ALT; alanine aminotransferase, BTR; branched-chain amino acid to tyrosine ratio, DCP; des-γ-carboxy prothrombin, CI; confidence interval.
Subgroup analysis for OS according to Child-Pugh classification
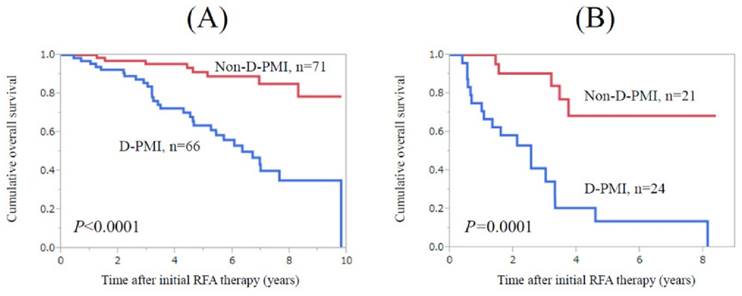
In patients with Child-Pugh A (n=137), patients in the D-PMI group (n=66) survived significantly shorter than those in the non-D-PMI group (n=71) (P<0.0001) (Fig. 2A). Similarly, in patients with Child-Pugh B or C (n=45), patients in the D-PMI group (n=24) survived significantly shorter than those in the non-D-PMI group (n=21) (P=0.0001) (Fig. 2B).
Subgroup analysis for OS according to Child-Pugh classification. (A) In patients with Child-Pugh A (n=137), patients in the D-PMI group (n=66) survived significantly shorter than those in the non-D-PMI group (n=71) (P<0.0001). (B) In patients with Child-Pugh B or C (n=45), patients in the D-PMI group (n=24) survived significantly shorter than those in the non-D-PMI group (n=21). (P=0.0001)
Sustained virological response (SVR) after RFA therapy in HCV-related HCC patients
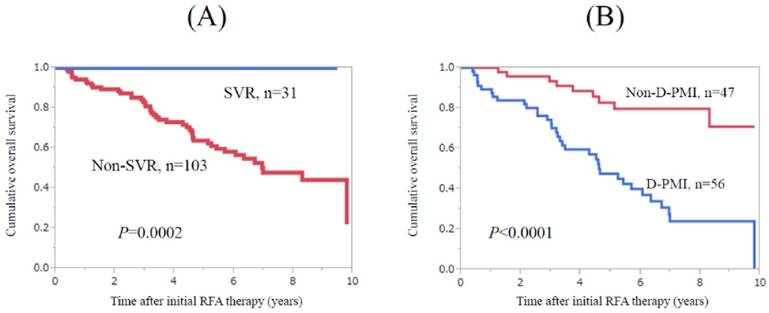
During follow-up period, 31 patients with HCV-related HCC patients (10 in the D-PMI group and 21 in the non-D-PMI group) achieved SVR after RFA therapy. Twelve patients were treated with IFN-based therapies and 19 patients were treated with DAA therapies. No patients with SVR died during follow-up period. Patients with SVR survived significantly longer than those without (n=103) (P=0.0002) (Fig. 3A). In patients without SVR, patients in the D-PMI group (n=56) survived significantly shorter than those in the non-D-PMI group (n=47) (P<0.0001) (Fig. 3B).
Subgroup analyses in HCV-related HCC patients (n=134). (A) Patients with SVR (n=31) survived significantly longer than those without (n=103) (P=0.0002). (B) In patients without SVR (n=103), patients in the D-PMI group (n=56) survived significantly shorter than those in the non-D-PMI group (n=47) (P<0.0001).
Cumulative LTP rate, intrahepatic distant recurrence rate and recurrence free survival
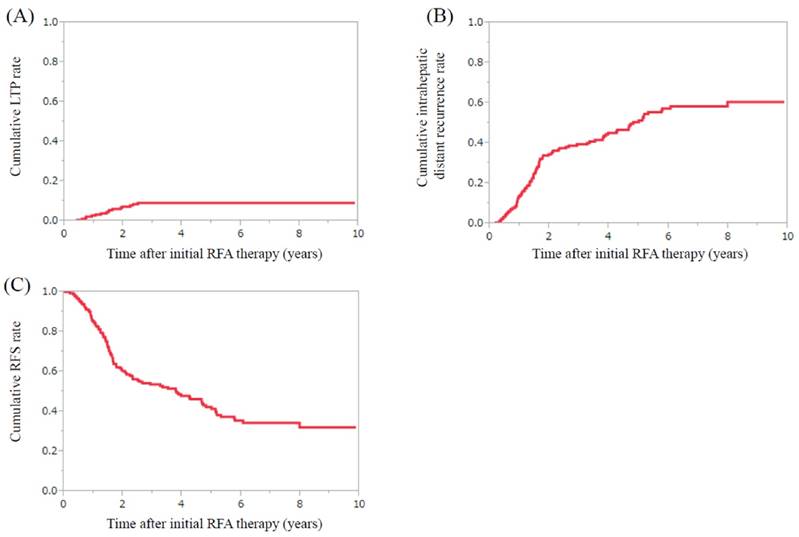
For all cases (n=182), the 1-, 3-, 5- and 7-year cumulative LTP rates were 2.8%, 9.1%, 9.1% and 9.1%, respectively (Fig. 4A). The 1-, 3-, 5- and 7-year cumulative intrahepatic distant recurrence rates were 13.8%, 39.5%, 51.3% and 58.4%, respectively. (Fig. 4B) The 1-, 3-, 5- and 7-year cumulative RFS rates were 85.1%, 53.6%, 41.5% and 34.5%, respectively. (Fig. 4C) The difference of cumulative RFS rates in the D-PMI and non-D-PMI groups did not reach significance. (P=0.5077)
HCC recurrence after initial RFA therapy. (A) The 1-, 3-, 5- and 7-year cumulative local tumor progression rates were 2.8%, 9.1%, 9.1% and 9.1%, respectively. (B) The 1-, 3-, 5- and 7-year cumulative intrahepatic distant recurrence rates were 13.8%, 39.5%, 51.3% and 58.4%, respectively. (C) The 1-, 3-, 5- and 7-year cumulative recurrence free survival rates were 85.1%, 53.6%, 41.5% and 34.5%, respectively.
Japanese reports of the effect of muscle mass evaluated by CT on clinical outcome for HCC patients
Japanese reports (including our current study) of the effect of muscle mass evaluated by CT on clinical outcome for HCC patients are listed in table 5.
Japanese reports of the effect of muscle mass evaluated by CT on clinical outcome for hepatocellular carcinoma patients.
| Author | Year | No. of cases | HCC therapy | Evaluation method for muscle mass | Prevalence of muscle mass loss | Outcome |
|---|---|---|---|---|---|---|
| Our study | 2017 | 182 | RFA | CT (L3, PMI) | 49.5% | P<0.05 (OS) |
| Hiraoka, et al. [31] | 2016 | 93 | Sorafenib | CT (L3, PMI) | 21.5% | P=0.042 (OS) |
| Kamachi, et al. [18] | 2016 | 92 | Surgery or RFA | CT (L3, SMI) | 66.3% | P<0.05 (RFS) |
| Iritani, et al. [32] | 2015 | 217 | Any | CT (L3, SMI) | 11.1% | P<0.05 (OS) |
| Fujiwara, et al. [15] | 2015 | 1257 | RFA or TACE | CT (L3, SMI) | 11.1% | P<0.05 (OS) |
| Hamaguchi, et al. [20] | 2014 | 200 | LT | CT (L3, PMI) | 44.0% | P<0.05 (OS) |
| Ito, et al. [14] | 2014 | 190 | Surgery | CT (L3, SMI) | 40.5% | P<0.05 (OS) |
| Harimoto, et al. [17] | 2013 | 186 | Surgery | CT (L3, SMI) | 40.3% | P<0.05 (OS) |
CT; computed tomography, RFA; radiofrequency ablation, L3; the third lumber, PMI; psoas muscle index, SMI; skeletal muscle index, TACE; transcatheter arterial chemoembolization, LT; liver transplantation, OS; overall survival, RFS; recurrence free survival.
Discussion
To the best of our knowledge, there have been few reports regarding the effect of muscle mass on survival in HCC patients treated with percutaneous RFA therapy. [15, 32] More than ten years have passed since approval for health insurance in RFA therapy for HCC patients in our country. In those years, numerous clinical evidence for RFA therapy have been accumulated. [2-6] However, few investigators have addressed these critical clinical issues.
In our data, patients with D-PMI survived significantly shorter than those without and it revealed to be an independent predictor with a HR of 6.867 (the highest among analyzed variables) for survival in the multivariate analysis. In addition, this is true irrespective of Child-Pugh status and in HCV-related HCC patients without SVR, similar results were obtained. These results imply the usefulness of PMI for predicting clinical outcomes in HCC patients undergoing RFA therapy. Skeletal muscle mass appears to play a crucial role in the outcomes of RFA therapy for HCC. In daily clinical practice, clinicians should be aware of skeletal muscle mass for not only HCC patients receiving surgery but also HCC patients receiving RFA therapy. [12, 14, 17-20] Equilibrium of muscle synthesis (anabolism) and muscle break down (catabolism) is essential to maintain skeletal muscle mass. [11] The insulin growth factor 1 (IGF-1) is synthesized in the liver and myocytes in response to stimulation for exercise and IGF-1 signaling pathway significantly contributes to the maintenance of the balance between muscle synthesis and muscle break down. [11] The impairment of these molecular pathways seen in patients with lower muscle mass may be associated with our current results. On the other hand, in terms of HCC recurrence, PMI was not a significant predictor. Tumor related factors may be essential for predicting HCC recurrence. [2-6]
In terms of comparison of baseline characteristics in the D-PMI group and the non-D-PMI group, gender, BMI and serum albumin were independent factors associated with the presence of D-PMI and unexpectedly aging did not reach significance despite of the fact that with the increasing age in humans, physical function begins to decline and skeletal muscle mass begins to decrease. [10, 13] One potential reason for these results is that underlying liver diseases can strongly affect the development of muscle mass decline irrespective of age. [9, 11, 33] As for cut-off value for PMI on CT in liver diseases, current Japanese guidelines recommend 6.36 cm2/m2 for male and 3.92 cm2/m2 for female. These data were calculated by below two standard deviations from the mean PMI values in a Japanese large cohort and were not based on outcome based analysis [12, 16] While in our outcome based ROC analysis, the optimal cut-off points for survival were 6.31 cm2/m2 for male and 3.91 cm2/m2 for female, which were quite identical to recommendations in Japanese guidelines and support the validity of current guidelines. [12, 16] In the viewpoint of outcome based data, our results are worth reporting. On the other hand, out of 49 patients who died during follow-up period in the D-PMI group, 22 patients (44.9%) died of liver failure, while in the non-D-PMI group, only 2 (15.4%) out 13 patients died of liver failure. Considering that similar baseline characteristics were observed in terms of Child-Pugh classification in the two groups (P=0.6078), these data may reflect the difference of underlying liver disease progression after initial RFA in these two groups.
Shiina et al. reported in their large cohort study (n=1170) that 5-year OS rate was 60.2%, which was lower than our data (5-year OS rate, 69.2%). [7] These differences may be attributed to the treatment strategies for underlying liver diseases. As described earlier, in our department, almost all patients with serum albumin level <3.5 g/dl received BCAA treatment or late evening snack with BCAA enriched snacks after sufficient evaluation of nutritional status including muscle mass measurement or energy metabolism using indirect calorimetry. [34-36] Even in patients with early stage of cirrhosis, BCAA therapy was considered for patients with BTR <4. [37, 38] Antiviral therapy was performed for all patients eligible for antiviral therapies. We have also recommended adequate exercise for cirrhotic patients with lower muscle mass. [39] These treatment strategies for underlying liver disease may lead to our current results.
HCV therapy has markedly improved in recent years. [23, 40-42] In our data, irrespective of the presence or absence of D-PMI, no patients with SVR died during follow-up period. In a recent study for patients with HCV related cirrhotic patients (n=165), an achievement of SVR during follow-up period was demonstrated to be the strongest favorable predictor associated with OS with a HR of more than 20. [43] Thus, antiviral therapies for HCV can be strongly recommended for patients eligible for these therapies for ameliorating clinical outcomes. On the other hand, in our multivariate analysis, DCP was found to be an independent predictor for OS, while AFP was not. Elevated DCP level may be associated with the malignant potential for HCC such as the development of portal vein tumor invasion, which may be linked to our current results. [44, 45]
Several limitations require to be acknowledged in this analysis. Firstly, this study was a single center retrospective observational study and parameters reflecting muscle function such as hang grip strength or intramuscular fat accumulation were not evaluated in this study. In future studies, two critical markers (i.e., muscle mass and muscle function) should be both assessed in outcome based analyses. Secondly, only 62 patients died during observation period in this study, which may not have sufficient statistical power for survival analysis, potentially creating bias. However, our study results denoted that PMI as determined by CT images had higher predictive ability for clinical outcomes in HCC patients receiving RFA therapy.
In conclusion, PMI can be useful for predicting outcomes in HCC patients undergoing percutaneous RFA therapy.
Abbreviations
HCC: hepatocellular carcinoma; RFA: radiofrequency ablation; CT: computed tomography; MRI: magnetic resonance imaging; US: ultrasonography; BCAA: branched-chain amino acid; DAA: direct acting antiviral; IFN: interferon; PMI: psoas muscle mass index; OS: overall survival; LTP: local tumor progression; ROC: receiver operating characteristic; RFS: recurrence free survival; HCV: hepatitis C virus; AUC: area under the ROC curve; D-PMI: decreased PMI; BMI: body mass index; HR: hazard ratios; CI: confidence interval; BTR: branched-chain amino acid to tyrosine ratio; DCP: des-γ-carboxy prothrombin; SVR: sustained virological response; IGF-1: insulin growth factor 1.
Acknowledgements
The authors would like to thank all medical staff in our hospital for data collection.
Competing Interests
The authors have declared that no competing interest exists.
References
1. Torre LA, Bray F, Siegel RL, Ferlay J, Lortet-Tieulent J, Jemal A. Global cancer statistics, 2012. CA Cancer J Clin. 2015;65(2):87-108
2. Nishikawa H, Kimura T, Kita R, Osaki Y. Radiofrequency ablation for hepatocellular carcinoma. Int J Hyperthermia. 2013;29(6):558-568
3. Donadon M, Solbiati L, Dawson L, Barry A. et al. Hepatocellular Carcinoma: The Role of Interventional Oncology. Liver Cancer. 2016;6(1):34-43
4. Toshikuni N, Tsutsumi M, Takuma Y, Arisawa T. Real-time image fusion for successful percutaneous radiofrequency ablation of hepatocellular carcinoma. J Ultrasound Med. 2014;33(11):2005-2010
5. Izumi N. Recent advances of radiofrequency ablation for early hepatocellular carcinoma. J Gastroenterol Hepatol. 2011;26(Suppl 1):115-122
6. Facciorusso A, Serviddio G, Muscatiello N. Local ablative treatments for hepatocellular carcinoma: An updated review. World J Gastrointest Pharmacol Ther. 2016;7(4):477-489
7. Shiina S, Tateishi R, Arano T. et al. Radiofrequency ablation for hepatocellular carcinoma: 10-year outcome and prognostic factors. Am J Gastroenterol. 2012;107(4):569-577
8. Osaki Y, Nishikawa H. Treatment for hepatocellular carcinoma in Japan over the last three decades: Our experience and published work review. Hepatol Res. 2015;45(1):59-74
9. Periyalwar P, Dasarathy S. Malnutrition in cirrhosis: contribution and consequences of sarcopenia on metabolic and clinical responses. Clin Liver Dis. 2012;16(1):95-131
10. Cruz-Jentoft AJ, Landi F, Schneider SM. et al. Prevalence of and interventions for sarcopenia in ageing adults: a systematic review. Report of the International Sarcopenia Initiative (EWGSOP and IWGS). Age Ageing. 2014;43(6):748-759
11. Sinclair M, Gow PJ, Grossmann M, Angus PW. Review article: sarcopenia in cirrhosis - aetiology, implications and potential therapeutic interventions. Aliment Pharmacol Ther. 2016;43(7):765-777
12. Nishikawa H, Shiraki M, Hiramatsu A, Moriya K, Hino K, Nishiguchi S. JSH guidelines for sarcopenia in liver disease (first edition): Recommendation from the working group for creation of sarcopenia assessment criteria in the JSH. Hepatol Res. 2016;46(10):951-963
13. Santilli V, Bernetti A, Mangone M, Paoloni M. Clinical definition of sarcopenia. Clin Cases Miner Bone Metab. 2014;11(3):177-180
14. Itoh S, Shirabe K, Matsumoto Y. et al. Effect of body composition on outcomes after hepatic resection for hepatocellular carcinoma. Ann Surg Oncol. 2014;21(9):3063-3068
15. Fujiwara N, Nakagawa H, Kudo Y. et al. Sarcopenia, intramuscular fat deposition, and visceral adiposity independently predict the outcomes of hepatocellular carcinoma. J Hepatol. 2015;63(1):131-140
16. Hamaguchi Y, Kaido T, Okumura S. et al. Proposal for new diagnostic criteria for low skeletal muscle mass based on computed tomography imaging in Asian adults. Nutrition. 2016;32(11-12):1200-1205
17. Harimoto N, Shirabe K, Yamashita YI. et al. Sarcopenia as a predictor of prognosis in patients following hepatectomy for hepatocellular carcinoma. Br J Surg. 2013;100(11):1523-1530
18. Kamachi S, Mizuta T, Otsuka T. et al. Sarcopenia is a risk factor for the recurrence of hepatocellular carcinoma after curative treatment. Hepatol Res. 2016;46(2):201-208
19. Harimoto N, Yoshizumi T, Shimokawa M. et al. Sarcopenia is a poor prognostic factor following hepatic resection in patients 70 years of age and older with hepatocellular carcinoma. Hepatol Res. 2016 Feb 15. doi: 10.1111/hepr.12674. [Epub ahead of print]
20. Hamaguchi Y, Kaido T, Okumura S. et al. Impact of quality as well as quantity of skeletal muscle on outcomes after liver transplantation. Liver Transpl. 2014;20(11):1413-1419
21. Charlton MR. Branched-chain amino acid enriched supplements as therapy for liver disease. J Nutr. 2006;136(1 Suppl):295S-298S
22. Kawaguchi T, Izumi N, Charlton MR, Sata M. Branched-chain amino acids as pharmacological nutrients in chronic liver disease. Hepatology. 2011;54(3):1063-1070
23. Fukui H, Saito H, Ueno Y. et al. Evidence-based clinical practice guidelines for liver cirrhosis 2015. J Gastroenterol. 2016;51(7):629-650
24. Kumada H, Okanoue T, Onji M. et al. Study Group for the Standardization of Treatment of Viral Hepatitis Including Cirrhosis, Ministry of Health, Labour and Welfare of Japan. Guidelines for the treatment of chronic hepatitis and cirrhosis due to hepatitis C virus infection for the fiscal year 2008 in Japan. Hepatol Res. 2010;40(1):8-13
25. Kappus MR, Mendoza MS, Nguyen D, Medici V, McClave SA. Sarcopenia in Patients with Chronic Liver Disease: Can It Be Altered by Diet and Exercise? Curr Gastroenterol Rep. 2016;18(8):43
26. Nishikawa H, Enomoto H, Ishii A. et al. Prognostic significance of low skeletal muscle mass as compared with protein-energy malnutrition in liver cirrhosis. Hepatol Res. 2016 Nov 15. doi: 10.1111/hepr.12843. [Epub ahead of print]
27. European Association For The Study Of The Liver; European Organisation For Research And Treatment Of Cancer. EASL-EORTC Clinical Practice guidelines: Management of hepatocellular carcinoma. J Hepatol. 2012;56:908-943
28. Kudo M, Kitano M, Sakurai T, Nishida N. General Rules for the Clinical and Pathological Study of Primary Liver Cancer, Nationwide Follow-Up Survey and Clinical Practice Guidelines: The Outstanding Achievements of the Liver Cancer Study Group of Japan. Dig Dis. 2015;33(6):765-770
29. Nishikawa H, Osaki Y, Iguchi E. et al. Radiofrequency ablation for hepatocellular carcinoma: the relationship between a new grading system for the ablative margin and clinical outcomes. J Gastroenterol. 2013;48(8):951-965
30. Tomonari A, Tsuji K, Yamazaki H. et al. Feasibility of the virtual needle tracking system for percutaneous radiofrequency ablation of hepatocellular carcinoma. Hepatol Res. 2013;43(12):1352-1355
31. Hiraoka A, Hirooka M, Koizumi Y. et al. Muscle volume loss as a prognostic marker in hepatocellular carcinoma patients treated with sorafenib. Hepatol Res. 2016 Aug 1. doi: 10.1111/hepr.12780. [Epub ahead of print]
32. Iritani S, Imai K, Takai K. et al. Skeletal muscle depletion is an independent prognostic factor for hepatocellular carcinoma. J Gastroenterol. 2015;50(3):323-332
33. Dasarathy S. Cause and management of muscle wasting in chronic liver disease. Curr Opin Gastroenterol. 2016;32(3):159-165
34. Sakai Y, Nishikawa H, Enomoto H. et al. Effect of L-Carnitine in Patients With Liver Cirrhosis on Energy Metabolism Using Indirect Calorimetry: A Pilot Study. J Clin Med Res. 2016;8(12):863-869
35. Nishikawa H, Yoh K, Enomoto H. et al. Factors Associated With Protein-energy Malnutrition in Chronic Liver Disease: Analysis Using Indirect Calorimetry. Medicine (Baltimore). 2016;95(2):e2442
36. Suzuki K, Endo R, Kohgo Y, et al; Japanese Nutritional Study Group for Liver Cirrhosis 2008. Guidelines on nutritional management in Japanese patients with liver cirrhosis from the perspective of preventing hepatocellular carcinoma. Hepatol Res. 2012;42(7):621-626
37. Nishiguchi S, Habu D. Effect of oral supplementation with branched-chain amino acid granules in the early stage of cirrhosis. Hepatol Res. 2004:30 S: 36-41
38. Habu D, Nishiguchi S, Nakatani S. et al. Effect of oral supplementation with branched-chain amino acid granules on serum albumin level in the early stage of cirrhosis: a randomized pilot trial. Hepatol Res. 2003;25(3):312-318
39. Hayashi F, Matsumoto Y, Momoki C. et al. Physical inactivity and insufficient dietary intake are associated with the frequency of sarcopenia in patients with compensated viral liver cirrhosis. Hepatol Res. 2013;43(12):1264-1275
40. Smith-Palmer J, Cerri K, Valentine W. Achieving sustained virologic response in hepatitis C: A systematic review of the clinical, economic and quality of life benefits. BMC Infect. Dis. 2015;15:19
41. Hull MW, Yoshida EM, Montaner JS. Update on Current Evidence for Hepatitis C Therapeutic Options in HCV Mono-infected Patients. Curr Infect Dis Rep. 2016;18(7):22
42. Pawlotsky JM. Hepatitis C Virus Resistance to Direct-Acting Antiviral Drugs in Interferon-Free Regimens. Gastroenterology. 2016;151(1):70-86
43. Hasegawa K, Takata R, Nishikawa H. et al. Impact of Wisteria floribunda Agglutinin-Positive Mac-2-Binding Protein in Patients with Hepatitis C Virus-Related Compensated Liver Cirrhosis. Int J Mol Sci. 2016:17 (9). pii: E1500
44. Koike Y, Shiratori Y, Sato S. et al. Des-gamma-carboxy prothrombin as a useful predisposing factor for the development of portal venous invasion in patients with hepatocellular carcinoma: a prospective analysis of 227 patients. Cancer. 2001;91:561-569
45. Kobayashi M, Ikeda K, Kawamura Y. et al. High serum des-gamma-carboxy prothrombin level predicts poor prognosis after radiofrequency ablation of hepatocellular carcinoma. Cancer. 2009;115(3):571-580
Author contact
![]() Corresponding author: Hirayuki Enomoto, MD, PhD, Department of Hepatobiliary and Pancreatic disease, Department of Internal Medicine, Hyogo College of Medicine, Hyogo, Japan. 1-1, Mukogawacho, Nishinomiyashi, Hyogo, 663-8501, Japan. Tel: +81-798-45-6111; Fax: +81-798-45-6608 E-mail: enomotoac.jp
Corresponding author: Hirayuki Enomoto, MD, PhD, Department of Hepatobiliary and Pancreatic disease, Department of Internal Medicine, Hyogo College of Medicine, Hyogo, Japan. 1-1, Mukogawacho, Nishinomiyashi, Hyogo, 663-8501, Japan. Tel: +81-798-45-6111; Fax: +81-798-45-6608 E-mail: enomotoac.jp