Impact Factor ISSN: 1837-9664

 Global reach, higher impact
J Cancer 2017; 8(10):1849-1864. doi:10.7150/jca.19858 This issue Cite
Research Paper
Metformin Inhibits Tumorigenesis and Tumor Growth of Breast Cancer Cells by Upregulating miR-200c but Downregulating AKT2 Expression
Jiali Zhang1#, Gefei Li1#, Yuan Chen1, Lei Fang1, Chen Guan1, Fumao Bai1, Mengni Ma1, Jianxin Lyu1 ![]() , Qing H. Meng1,2
, Qing H. Meng1,2 ![]()
1. Key Laboratory of Laboratory Medicine, Ministry of Education of China, Zhejiang Provincial Key Laboratory of Medical Genetics, School of Laboratory Medicine and Life Sciences, Wenzhou Medical University, Wenzhou, Zhejiang 325035, China
2. Department of Laboratory Medicine, The University of Texas MD Anderson Cancer Center, Houston, TX 77030, USA
#These authors contributed equally to this work.
Received 2017-2-28; Accepted 2017-5-8; Published 2017-7-2
Abstract
Background: Metformin has been reported to inhibit the growth of various types of cancers, including breast cancer. Yet the mechanisms underlying the anticancer effects of metformin are not fully understood. Growing evidence suggests that metformin's anticancer effects are mediated at least in part by modulating microRNAs, including miR-200c, which has a tumor suppressive role in breast cancer. We hypothesized that miR-200c has a role in the antitumorigenic effects of metformin on breast cancer cells.
Methods: To delineate the role of miR-200c in the effects of metformin on breast cancer, plasmids containing pre-miR-200c or miR-200c inhibitor were transfected into breast cancer cell lines. The MDA-MB-231, BT549, MCF-7, and T-47-D cells' proliferation, apoptosis, migration, and invasion were assessed. The antitumor role of metformin in vivo was investigated in a MDA-MB-231 xenograft tumor model in SCID mice.
Results: Metformin significantly inhibited the growth, migration, and invasion of breast cancer cells, and induced their apoptosis; these effects were dependent on both dose and time. Metformin also suppressed MDA-MB-231 tumor growth in SCID mice in vivo. Metformin treatment was associated with increased miR-200c expression and decreased c-Myc and AKT2 protein expression in both breast cancer cells and tumor tissues. Overexpression of miR-200c exhibited effects on breast cancer cells similar to those of metformin treatment. In contrast, inhibiting the expression of miR-200c increased the growth, migration, and invasion of MCF-7 and MDA-MB-231 cells.
Conclusion: Metformin inhibits the growth and invasiveness of breast cancer cells by upregulation of miR-200c expression by targeting AKT2. These findings provide novel insight into the molecular functions of metformin that suggest its potential as an anticancer agent.
Keywords: Metformin, breast cancer cell, miR-200c, AKT2
Introduction
Metformin has been widely prescribed for the treatment of type 2 diabetes mellitus for more than 50 years. Emerging evidence suggests that patients with diabetes receiving metformin exhibit lower cancer incidence and cancer-related mortality than the general population [1-3]. Recent clinical studies have shown that metformin reduces the risk of cancer occurrence and prolongs the survival of patients with cancer, including breast cancer [3-5]. Diabetic patients with breast cancer receiving metformin and neoadjuvant chemotherapy have a higher pathologic complete response rate than similar patients who did not receive metformin [6, 7]. Yet, little is known about the mechanisms underlying the anticancer effects of metformin.
In vitro studies have demonstrated that metformin effectively inhibited proliferation and metastasis of breast cancer cells and induced their apoptosis by targeting multiple pathways [8, 9]. These effects are mediated through the activation of AMPK-mTOR by inhibiting the mitochondrial respiratory chain complex І [8]. Metformin may also influence the PI3K/Akt/mTOR MAPK signaling pathways and microRNA expression [9]. The PI3K /AKT pathway can be activated in tumor cells by a number of mechanisms. AKT serine/threonine kinase plays a crucial role in the regulation of cell growth, proliferation, and survival [10]. The kinases in the AKT family, are composed of three members, AKT1, AKT2, and AKT3. Stacey's data shows that AKT2 is most relevant to cell proliferation and survival among the three AKT isoforms in breast cancer cells [11]. Arboleda et al. found that AKT2 overexpression induced invasion and metastasis in breast and ovarian tumors [12]. The c-Myc plays a vital role in regulation of cell proliferation, apoptosis and metabolism [13]. Previous studies demonstrated that metformin downregulates c-Myc, causing cell cycle arrest and promoting apoptosis in prostate cancer cells [14]. As the founding member of the B-cell lymphoma 2 (Bcl-2) family, Bcl-2 can block cell death and Bcl-2-associated X protein (Bax) is a promoter of apoptosis [15].
MicroRNAs (miRNAs) are small, non-coding RNAs that modulate gene expression post-transcriptionally [16]. Increasing evidence reveals that miRNAs are key regulators of many biological processes, such as cell proliferation, differentiation, apoptosis, stress response, and angiogenesis, through their ability to bind the 3'-untranslated regions of multiple target mRNAs [17]. The miR-200 family of miRNAs consists of five members grouped in two independent transcriptional clusters: miR-200a, -200b, and -429, located on chromosome 1p36, and miR-200c and -141, located on 12p13 [18]. MiR-200c is the predominant member of the miR-200 family, which suppresses the epithelial-mesenchymal transition (EMT), and the downregulation of miR-200 family members in some tumors promotes invasion and metastasis [19-21]. Song and colleagues found that miR-200c inhibits breast cancer proliferation by targeting KRAS [22]. In another study, upregulation of miR-200c decreased the expression of the BMI-1 gene, inhibiting the metastatic process of bladder cancer [23]. These findings suggest that miR-200c has a significant role in cancer biologic processes.
Growing evidence shows that metformin can exert anticancer effects through miRNA modulation [24-26]. However, the effects of metformin on miRNA are different in various types of cancer [24-27]. In human prostate cancer cells, metformin stimulates increased expression of miR-708-5p to induce endoplasmic reticulum stress-dependent apoptosis [25]. Metformin inhibited cell growth by upregulating the expression of miR-26a, miR-192, and let-7c in pancreatic cancer cell lines [26]. In murine embryonic fibroblasts, metformin induced a stress-induced senescence response by upregulating anti-EMT miRNAs (i.e., miR-200s and miR-205) [27]. An early study suggested that metformin decreased the cell survival, clonogenicity, and wound-healing capacity and caused reexpression of miRNAs including miR-200c in pancreatic cancer cells [28]. But it did not discuss in any detail about the relationship between metformin and miR-200c. Given the potential capacity of metformin to broadly affect multiple pathways, we surmised that miRNA modulation is involved in the mechanism of action of metformin. We then hypothesized that the antitumorigenic effects of metformin are mediated through upregulation of miR-200c expression in breast cancer cells. In this study, we investigated the in vivo and in vitro effects of metformin on breast cancer cells and their underlying mechanisms, particularly the involvement of miR-200c.
Materials and Methods
Cell culture and reagents
The human breast cancer cell lines MCF-7 and T-47-D, representing estrogen receptor (ER)-positive tumors, and MDA-MB-231 and BT549, representing triple-negative tumors, were chosen for this study. All cells were purchased from the Institute of Biochemistry and Cell Biology, Chinese Academy of Sciences (Shanghai, China). All cell lines were cultured in Dulbecco modified essential medium (DMEM) (Gibco, shanghai, China) supplemented with 10% fetal bovine serum (FBS; Bioind, Beit-Haemek, Israel) and 100 U/mL penicillin-streptomycin (Solarbio, Beijing, China) in a humidified 37°C incubator supplemented with 5% CO2.
Metformin (1,1 -dimethylbiguanide hydrochloride), purchased from Sigma-Aldrich (Shanghai, China), was dissolved in phosphate-buffered saline solution (PBS) to make a 1 M stock solution and stored at -20°C.
Plasmid transfection
MDA-MB-231 and MCF-7 cells were transfected with EGFP plasmids (2 µg) containing hsa-miR-200c inhibitor, pre-miR-200c, or empty vector (negative control [NC]). The untransfected controls are designated MOCK. All plasmids were synthesized by GenePharma (Shanghai, China). The cells were grown to 80-90% confluence and then transfected with one of the three plasmids using Lipofectamine 2000 (Invitrogen, Shanghai, China; DNA/Lipofectamine 2000 ratio = 1/2) according to the manufacturer's instructions. Six hours after transfection, fresh DMEM containing 10% FBS was used to replace the culture medium. Cells with established stable transfectants were incubated in complete DMEM with blasticidin (12 mg/mL, MDA-MB-231; 40 mg/mL, MCF-7; Invitrogen, Carlsbad, CA, USA) for EGFP plasmids for 15 days. Clones were verified by real-time quantitative polymerase chain reaction (qPCR), and the successful clones were pooled for the subsequent investigations.
Cell proliferation assay
Cell proliferation was assessed by using the Cell Counter Kit-8 (CCK-8; Dojindo, Kumamoto, Japan) as described in our previous studies [29, 30]. In brief, cells were plated (6.0×10³ cells per well for MDA-MB-231 and MCF-7; 5.0×10³ cells per well for BT549; 4×10⁴ cells per well for T-47-D) in 96-well plates and allowed to adhere overnight. The cells were then treated with metformin at various concentrations (0, 2.5, 5, 10, 15, or 20 mM) for 12, 24, 36, or 48 h before CCK-8 assay reagent (10µL) was added to each well. After that the OD values were determined at 450 nm, which were used to evaluate the relative cell viability. Transfected MDA-MB-231 and MCF-7 cells stably expressing pre-miR-200c, miR-200c inhibitor or empty vector and untransfected cells were seeded at a density of 4.5×10³ cells in 96-well plates and incubated for various periods of time (0 to 5 days). Relative cell proliferation rate also was assessed by the OD values at 450 nm.
Colony formation assay
Cell growth was estimated by the colony formation assay. Cells were seeded (1.0×10³ cells per well) into 6-well plates (3.48cm diameter). After incubation for 3 days, cell culture medium with metformin at various concentrations (0, 5, 10, or 20 mM) was added to each well. After 11 days, colonies were fixed with 4% cold paraformaldehyde for 15 min and stained with crystal violet (Beyotime, Shanghai, China) for 15 min at room temperature. Only clearly visible colonies (diameter >50 mm) were counted.
Apoptosis assay
Cells were plated (1.5×10⁵ cells per well) and treated with metformin for 48 h. Subsequently, harvested and washed twice with cold PBS to remove floating cells before analysis by the Annexin V-APC Apoptosis Detection Kit (KeyGEN Biotech, Nanjing, China). Then cells were stained at room temperature with Annexin V- allophycocyanin (APC) and propidium iodide for 15 min in the dark. Apoptosis levels were quantified by a FASS-Calibur flow cytometry (BD Biosciences, San Jose, CA, USA) restricted 15 min to 1 h.
Wound healing assay
Wound healing assay was performed to determine T-47-D cells migration. Cells were seeded (5×10⁵ cells per well) into 12-well plates. After incubation for 24 h, several wound lines were scratched to the bottom of the well using a 10µL pipette tip. The cells were then washed three times with PBS and incubated in medium containing 2% FBS with metformin at indicated concentrations. The wound width was determined 96 h later under a microscope (Nikon, Tokyo, Japan). The percentage of wound closure was calculated as follows: percentage of wound closure = 1 - (width t/width 0) ×100%.
Cell migration and invasion assays
Migration of MDA-MB-231, MCF-7, and BT549 cells and stably transfected cell lines was quantified by the Boyden transwell chamber assay. Cells (1.5×10⁵ cells per well) were treated with metformin for 48 h, then were harvested, resuspended in 200µL serum-free DMEM, and seeded (2.5×10⁴ cells per chamber for MDA-MB-231 and BT549; 1×10⁵ cells per chamber for MCF-7) into each upper chambers of 24-well Boyden transwell units, while 600 µL DMEM with 20% FBS was placed into each lower chamber as a chemoattractant. After incubation for 24 h (MDA-MB-231 and BT549) or 48 h (MCF-7), cells that had penetrated through to the lower surface of the membrane were removed and fixed with 4% paraformaldehyde for 15 min, stained with crystal violet for 15 min at ambient temperature, photographed, and counted under a microscope (Nikon, Tokyo, Japan) at 200× magnification in five randomly chosen fields.
Cell invasion was evaluated by a transwell chamber system identical to that used for the cell migration assay except that the transwell filters in the 24-well upper plates were coated with diluted matrigel (5 µL in 45 µL serum-free medium; BD Biosciences, Bedford, MA, USA) for 12 h. The cells were seeded into the transwell plates, which were pre-hydrated with 100 µL serum-free medium at 37°C for 30 min. The rest of the procedures were the same as for the cell migration assay.
Gene chip analysis
Microarray data for the GSE19536 breast cancer cohort were downloaded from the Gene Expression Omnibus (http://www.ncbi.nlm.nih.gov/geo). MiR-200c levels in tumor tissues from 99 patients in the GSE19536 cohort for whom follow-up data were available were analyzed according to disease-free survival duration. The median miR-200c expression of the 99 patient samples was used as the threshold, and patients were categorized into groups with high (above median) or low (below median) miR-200c expression.
Isolation of RNA and quantitative polymerase chain reaction analysis
Total RNA was extracted from breast cancer cells or tumor tissues treated with metformin by using TRIzol (Invitrogen) according to the manufacturer's instructions. Total miR-200c RNA (500 ng) was reverse transcribed to cDNA with miR-200c specific RT primers (Invitrogen, Catalog number: 4427975, Carlsbad, CA, USA) and the Prime Script RT Reagent kit (Takara Biotechnology, Shiga, Japan). Gene expression was measured by qPCR using an Applied Biosystems 7500 Fast Sequence Detection System and Premix Ex Taq (Probe qPCR; Takara Biotechnology) under the following conditions: denaturation at 95°C for 5 min, followed by 40 cycles of denaturation at 95°C for 5 s and annealing and extension at 60°C for 30 s. The relative miR-200c level was normalized to U6 expression.
Western blotting analysis
Breast cancer cells or tumor tissues were lysed in the presence of a protease inhibitor cocktail and phosphatase inhibitor mixture (3 µL) and then homogenized. Protein concentration was measured by using a bicinchoninic acid protein assay kit (P0010, Beyotime). Separated proteins were transferred to nitrocellulose membranes and subsequently blocked in 5% nonfat milk solution and incubated with indicated primary antibodies at 4°C overnight (1:2000 dilution; Cell Signaling Technology, Danvers, MA, USA): anti-β-actin antibody, anti-c-Myc antibody, anti-Bax antibody, anti-Bcl-2 antibody, and anti-AKT2 antibody. The membranes then were incubated with the secondary antibody, rabbit horseradish peroxidase-conjugated anti-goat IgG (1:2000 dilution; Beyotime, Hangzhou, China), for 1 h at room temperature. Blotted membranes were detected by using the ChemiDoc XRST and processed by Image Lab Software (both, Bio-Rad, Inc., Hercules, CA, USA). The gray value of each band in the imaging data was analyzed by Quantity One software (Bio-Rad, Inc.).
Tumor xenograft model in mice
Four-week-old male SCID mice (Slack Laboratory Animal Company, Shanghai, China) received a subcutaneous injection of MDA-MB-231 cells (1×10⁷ cells per mouse) harvested from culture in logarithmic phase into the right flank. Fifteen days post injection, the animals were randomly allocated to the control and two experimental groups (n=5 mice/group) which were received different concentrations of metformin (125 mg/kg/dose [Met 125]) or 250 mg/kg/dose [Met 250], respectively). Physiological saline containing metformin was administered every 2 days via intraperitoneal injection. Simultaneously, the control group received physiological saline solution. Tumor volume and body weight were assessed every 6 days. Tumor volume was measured using a Vernier caliper along two perpendicular axes. The volume of the tumor was calculated using the formula: volume = (length × width2)/2. After 30 days of treatment, the mice were sacrificed by cervical vertebral dislocation and the tumors were excised immediately and weighed, and portions of tumor were frozen in liquid nitrogen or fixed in 4% paraformaldehyde for further analysis. All animal procedures and experimental protocols were approved by Laboratory Animal Ethics Committee of Wenzhou Medical University, and all experimental procedures were approved by the university's Laboratory Animal Ethics Committee.
Immunohistochemical analysis
Tumor tissues fixed in 4% paraformaldehyde were subjected to immunohistochemical analysis for c-Myc with a commercial kit (Boster, Wuhan, China) according to manufacturer's instructions. Briefly, formalin-fixed and paraffin-embedded tumor sections (5 µm) were deparaffinized in xylene and rehydrated rehydrated with PBS. Endogenous peroxidase present in the tissue sections was quenched with 3% H2O2 for 15 min in the dark. Nonspecific binding was blocked in 5% BSA for 30 min at 37 °C. Slides were steamed in 1× citrate buffer solution for 30 min to retrieve antigen followed by incubation with c-Myc primary antibody (1:100 diluted in goat serum) at 4°C overnight. Next day, the sections were incubated with corresponding secondary antibody at 37°C for 1 h. The slides were subsequently reacted with 3, 3-diaminobenzidine, followed by counter-stained with hematoxylin. The antigen signals on each slide were counted under a microscope (Nikon, Tokyo, Japan) at × 400 magnifications. The mean optical density (integrated optical density sum/area sum) of c-Myc-positive cells in the tumor tissue after immunohistochemical staining was determined by image Pro Plus (Media Cybernetics, Bethesda, MD, USA).
Statistical analyses
All the results in this study were analyzed with SPSS 17.0 software (IBM SPSS, Armonk, NY, USA) and carried out by Prism 5 software (GraphPad, La Jolla, CA, USA). Data were presented as mean ± standard deviation (SD). The differences between indicated groups were analyzed by one way analysis of variance (ANOVA) and two-tailed Student t-test. P-values <0.05 were considered statistically significant. Results were obtained by performing at least three independent experiments.
Results
Metformin reduces breast cancer cell proliferation and colony formation and induces apoptosis
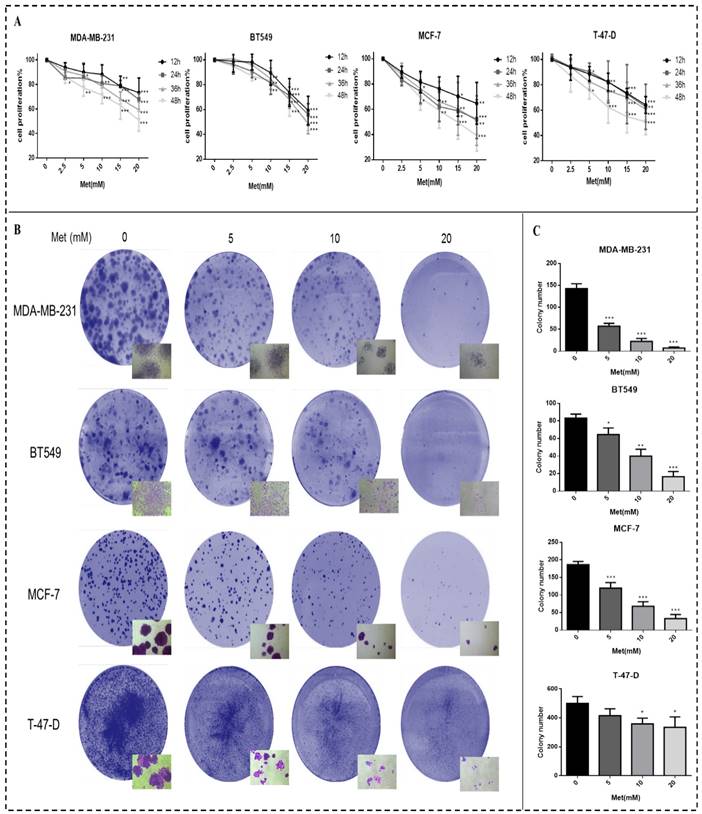
Breast cancer cell proliferation was reduced after treatment with metformin, an effect that was time- and dose-dependent (Fig. 1A). Cell proliferation was significantly inhibited 48h after treatment with 5, 10, 15, or 20 mM metformin compared to the controls (p<0.05-0.001). Similarly, colony formation by all cell lines was reduced by metformin in a dose-dependent manner compared with the control (p<0.05-0.001; Figs. 1B-C). The cell density of clones observed under inverted microscope (200× magnification) was also reduced by metformin treatment. The colony formation of cell line T-47-D was less responsive to metformin treatment, which could be attributed to its strong ability to proliferation.
Metformin reduces proliferation and colony formation in breast cancer cells. (A) Cell proliferation was gauged by the CCK-8 assay when Breast cancer cells (MDA-MB-231, BT549, MCF-7, and T-47-D) were treated with metformin (Met) at various concentrations (2.5, 5, 10, 15, or 20 mM) for up to 48 h. Same volume of culture medium without metformin was added in the control group. (B-C) Colony formation was quantified 11 days after treatment with metformin (5, 10, or 20 mM) by counting the colonies formed. The control group was not given metformin treatment. *p<0.05, **p<0.01, ***p<0.001 compared with the controls.
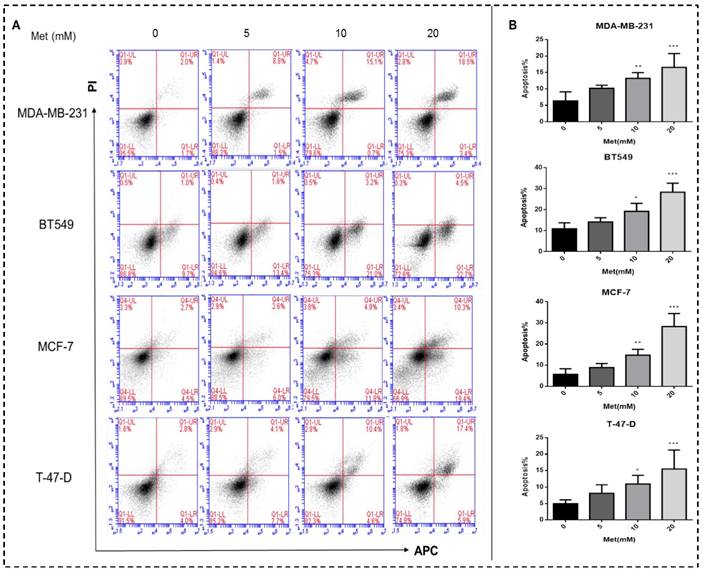
Metformin treatment for 48h increased both early and late apoptotic cell populations in a dose-dependent manner compared with the controls (p<0.05-0.001; Figs. 2A-B).
Metformin induces apoptosis of breast cancer cells. (A) Apoptosis was quantified by Annexin V-APC assay and propidium iodide (PI) staining in breast cancer cells (MDA-MB-231, BT549, MCF-7, and T-47-D) with metformin (5, 10, or 20 mM) treatment for 48 h. Same volume of culture medium without metformin was added in the control group. (A) Early apoptotic cells (lower right, LR) and late apoptotic cells (upper right, UR) are shown. (B) Histograms represent quantification of the rate of apoptosis. *p<0.05, **p<0.01, ***p<0.001 compared with the controls.
Metformin inhibits the migration and invasion of breast cancer cells
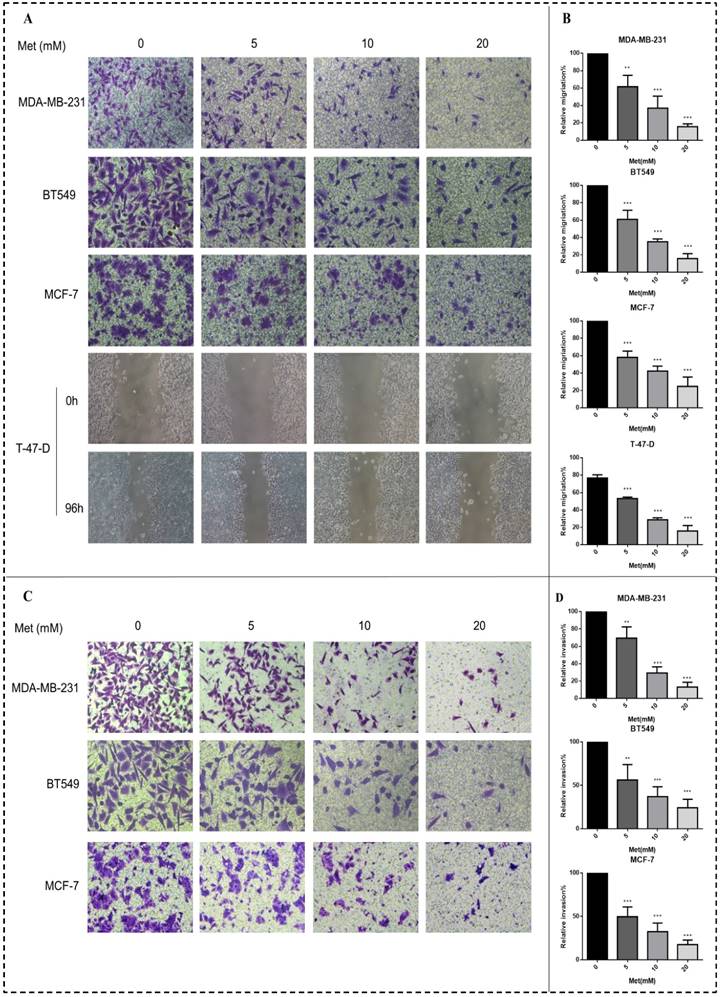
Metformin treatment for 48 h at a concentration of 5, 10, or 20 mM significantly inhibited the migration of all four breast cancer cell lines (p<0.01-0.001; Figs. 3A-B). Similarly, metformin treatment strongly inhibited the invasion of MDA-MB-231, MCF-7, and BT549 cells (p<0.01-0.001; Figs. 3C-D). T-47-D cells were not chosen for this experiment because of their low invasion capacity.
Metformin attenuates breast cancer cell migration and invasion. (A-B) Boyden transwell chamber assay (MDA-MB-231, BT549, MCF-7) or a wound healing assay (T-47-D) was used to determined cell migration in response to metformin (Met) (5, 10, or 20 mM) treatment for 48 h. The control group was not given metformin treatment. (C-D) The invasion assay (MDA-MB-231, BT549, MCF-7) also was performed in Boyden transwell chambers, in which the membranes were coated with diluted matrigel. After 48 h in the presence of various concentrations of metformin (0, 5, 10, or 20 mM), cells that passed through the membrane were counted. **p<0.01, ***p<0.001 compared with the controls.
Metformin increases miR-200c levels in breast cancer cells
Basal miR-200c expression in the four breast cancer cell lines was determined. The expression of miR-200c in the ER-positive breast cancer cells (MCF-7 and T-47-D) was higher than that in the triple-negative breast cancer cells (MDA-MB-231 and BT549) (p<0.001; Fig. 4A). Expression of miR-200c in these cells was significantly increased by treatment with various concentrations of metformin for 48 h, as demonstrated by qPCR assays. The effect was dose-dependent (p<0.01-0.001; Fig. 4B).
MiR-200c is expressed in breast cancer cells and patient tumors, and metformin increases miR-200c expression in breast cancer cells. (A) Expression of miR-200c in breast cancer cell lines. (B) Total RNA was isolated and reverse-transcribed for qPCR to estimate the expression of miR-200c in cells following treatment with metformin (Met) for 48 h at the indicated concentrations (5, 10, or 20 mM). The control group was not given metformin treatment. (C) miR-200c overexpression was significantly associated with longer survival in a cohort of patients with breast cancer (GSE19536). *p<0.05, **p<0.01, ***p<0.001 compared with the controls.
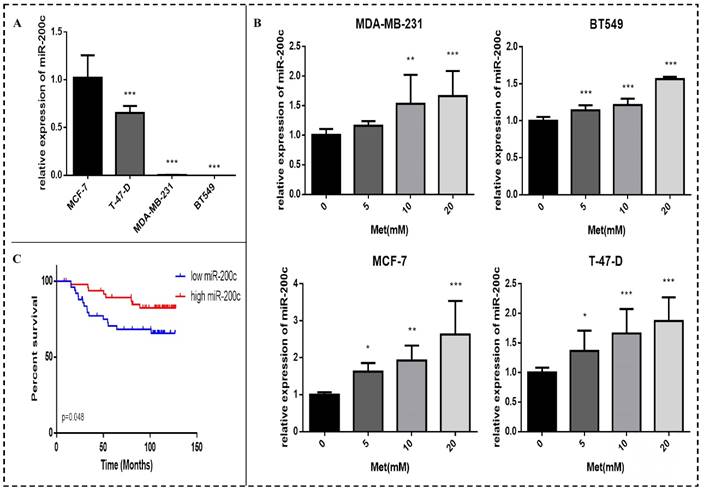
Analysis of publicly available microarray and associated clinical data showed that miR-200c overexpression in breast cancer tissue is significantly associated with longer survival in patients with breast cancer (p<0.05; Fig. 4C).
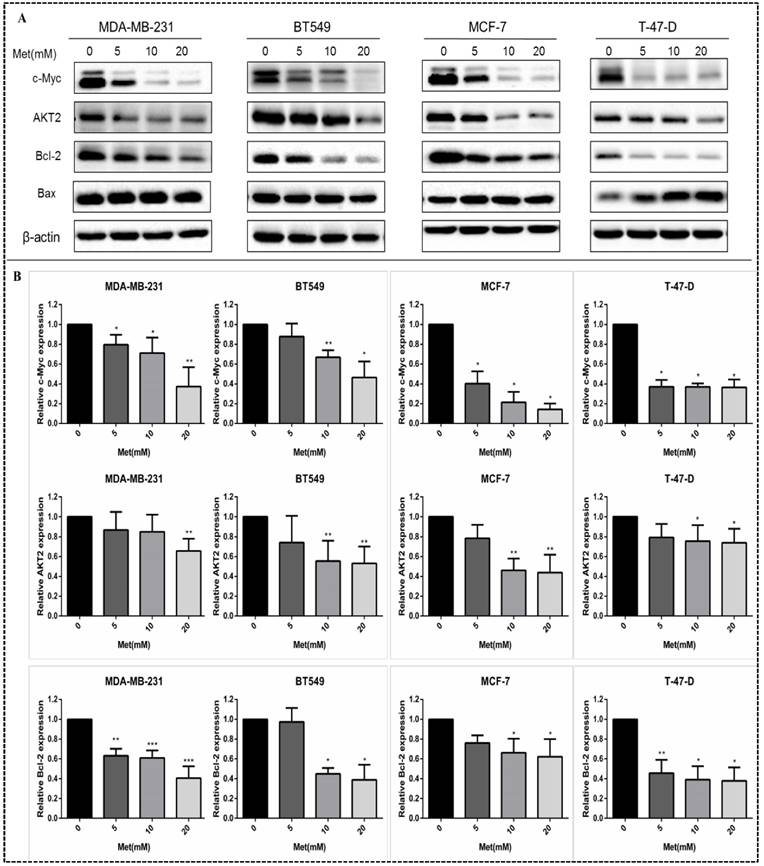
Metformin reduces c-Myc, AKT2, and Bcl-2 protein levels in breast cancer cells
Western blot analysis revealed that the levels of c-Myc, AKT2, Bcl-2 and Bax in MDA-MB-231, MCF-7, BT549, and T-47-D cells were decreased by treatment with metformin at various concentrations. The effects of metformin on c-Myc, AKT2, and Bcl-2 protein levels were dose-dependent (all panels, p<0.05-0.001; Figs. 5A-B). Metformin had no significant effect on the expression of Bax protein. However, the ratio of pro-apoptotic protein-Bax to anti-apoptotic protein-Bcl-2 increased following metformin treatment.
Metformin suppresses the expression of c-Myc, Bcl-2, and AKT2 proteins in breast cancer cells. (A) The levels of c-Myc, AKT2, Bcl-2 and Bax proteins were determined in breast cancer cells (MDA-MB-231, BT549, MCF-7 and T-47-D) by western blot following treatment with metformin (Met) for 48 h at the indicated concentrations (5, 10, or 20 mM). Same volume of culture medium without metformin was added in the control group. (B) Histograms represent quantification of the relative expression of c-Myc, Bcl-2, and AKT2 proteins. Metformin had no significant effect on the expression of Bax protein. *p<0.05, **p<0.01, ***p<0.001 compared with the controls.
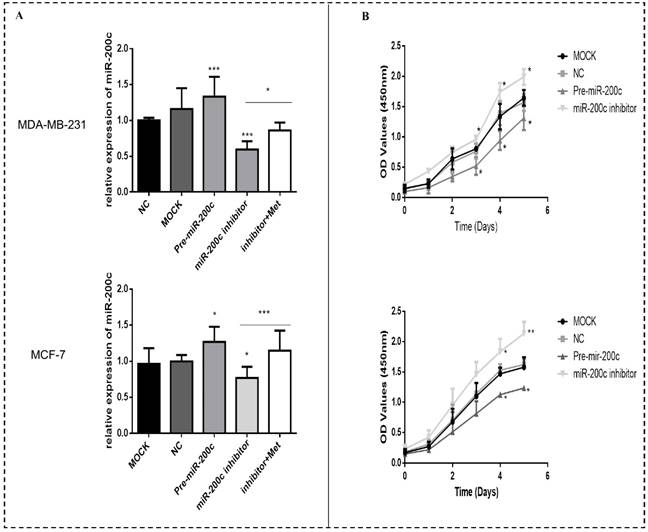
Overexpression of miR-200c in MDA-MB-231 and MCF-7 breast cancer cells reduces proliferation and induces apoptosis
In order to investigate the effect of miR-200c on the biological functions of breast cancer cells, two representative cells: MDA-MB-231, representing estrogen receptor (ER)-positive tumors and MCF-7 representing triple-negative tumors were selected. The expression of miR-200c was significantly suppressed in MDA-MB-231 and MCF-7 cells transfected with miR-200c inhibitor compared with negative controls (Fig. 6A). The suppression of miR-200c expression was reversed after treatment with metformin (Fig. 6A). In contrast, transfection of pre-miR-200c into these cells significantly increased the expression of miR-200c compared with negative controls (p<0.5-0.001; Fig. 6A). Overexpression of miR-200c in MDA-MB-231 and MCF-7 cells resulted in decreased proliferation compared with the controls (p<0.05-0.01; Fig. 6B). In contrast, downregulation of miR-200c resulted in markedly increased cell proliferation compared with the controls (p<0.05-0.01; Fig. 6B).
MiR-200c overexpression reduces proliferation of breast cancer cells. (A) The expression of miR-200c was measured in MDA-MB-231 and MCF-7 cells after transfection with pre-miR-200c, miR-200c inhibitor, or negative control (NC) and transfected (MOCK) cells. The suppressive effect of miR-200c inhibitor on miR-200c expression was reversed by treatment with metformin (Met, 10 mM) for 48 h. (B) Upregulation of miR-200c in MDA-MB-231 and MCF-7 cells by Pre-miR-200c reduced cell proliferation while inhibition of miR-200c by miR-200c inhibitor increased cell proliferation relative to negative control (NC) and mock-treated (MOCK) cells. The OD values (450nm) represent relative cell proliferation rate. *p<0.05, **p<0.01, ***p<0.001 compared with the controls.
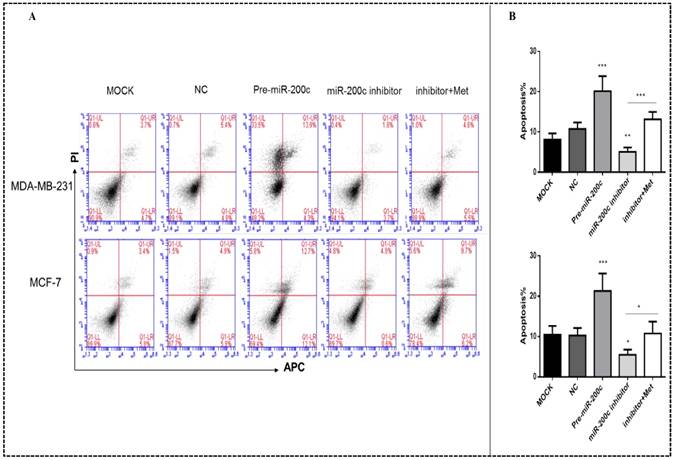
Upregulation of miR-200c enhanced apoptosis in MDA-MB-231 and MCF-7 cells (p<0.01-0.001; Figs. 7A-B). Downregulation of miR-200c protected cells from apoptosis, but treatment with metformin reversed this effect (p<0.05; Figs. 7A-B).
MiR-200c overexpression induces apoptosis of breast cancer cells. (A) Upregulation of miR-200c in MDA-MB-231 and MCF-7 cells by pre-miR-200c transfection induced cell apoptosis, while inhibition of miR-200c by miR-200c inhibitor reduced cell apoptosis relative to that in negative control (NC) and mock-treated (MOCK) cells. The suppressive effect of miR-200c inhibitor on apoptosis was reversed by treatment with metformin (Met, 10 mM) for 48 h. (B) Histograms represent quantification of the apoptosis rate. *p<0.05, **p<0.01, ***p<0.001 compared with the controls.
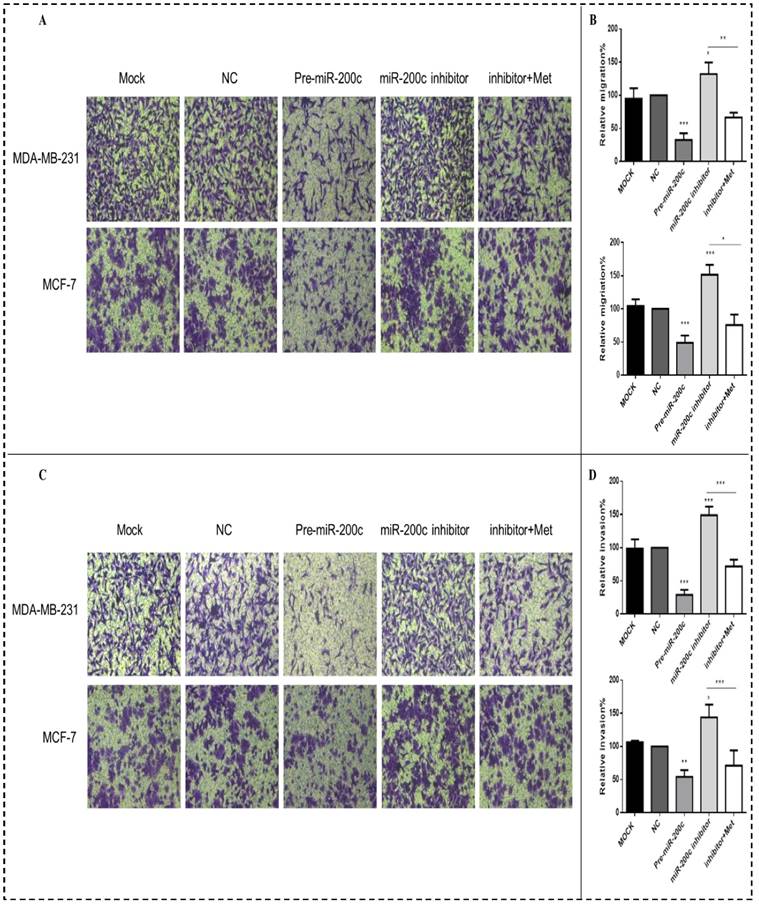
MiR-200c inhibits migration and invasion of MDA-MB-231 and MCF-7 cells
Increased expression of miR-200c inhibited the migration and invasion of the MDA-MB-231 and MCF-7 breast cancer cells compared with the NC transfectants (all panels, p<0.01-0.001; Figs. 8A-D). In contrast, downregulation of miR-200c by the miR-200c inhibitor enhanced the migration and invasion of these cells, while after treatment with 10 mM metformin for 48h reversed this effect, suppressing migration and invasion (all panels, p<0.01-0.001; Fig. 8A-D).
MiR-200c overexpression inhibits breast cancer cell migration and invasion. Upregulation of miR-200c in MDA-MB-231 and MCF-7 cells by transfection of pre-miR-200c decreased cell migration (A-B) and invasion (C-D), while inhibition of miR-200c by miR-200c inhibitor increased cell migration (A-B) and invasion (C-D) relative to negative control (NC) and mock-treated cells (MOCK). The stimulating effects of miR-200c inhibitor on migration and invasion were reversed by treatment with metformin (Met, 10 mM) for 48 h. *p<0.05, **p<0.01, ***p<0.001 compared with the controls.
MiR-200c inhibits expression of AKT2 and Bcl-2 in MDA-MB-231 and MCF-7 cells
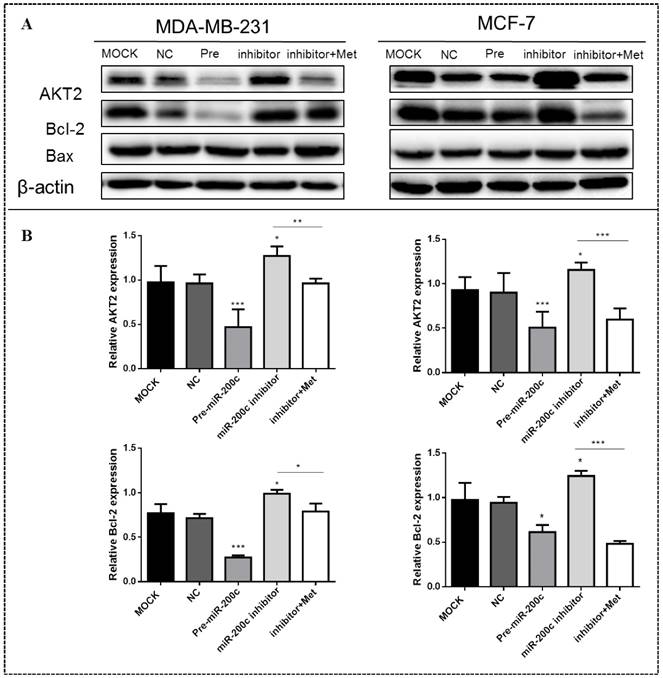
MiR-200c overexpression significantly suppressed the expression of AKT2 and Bcl-2 proteins in MDA-MB-231 (p<0.01) and MCF-7 (p<0.05) cells compared with the controls (Figs. 9A-B). In contrast, inhibition of miR-200c expression significantly increased the expression of these proteins in both MDA-MB-231and MCF-7 cells (p<0.01; Figs. 9A-B), but this effect was reversed by treatment with 10 mM metformin for 48h, suppressing expression of both proteins. Expression of the Bax protein did not differ significantly between cells transfected with miR-200c inhibitor and the controls.
MiR-200c inhibits expression of Bcl-2 and AKT2 protein in breast cancer cells. (A) Upregulation of miR-200c in MDA-MB-231 and MCF-7 by transfection of pre-miR-200c reduced expression of Bcl-2 and AKT2 proteins, while inhibition of miR-200c by miR-200c inhibitor increased expression of Bcl-2 and AKT2 protein relative to negative control (NC) and untransfected (MOCK) cells. The stimulating effect of miR-200c inhibition on AKT2 and Blc-2 proteins was reversed by treatment with metformin (Met, 10 mM) for 48 h. (B) Histograms represent quantification of the relative expression of each protein in the two cell types. *p<0.05, **p<0.01, ***p<0.001 compared with controls.
Metformin inhibits MDA-MB-231 tumor growth in SCID mice
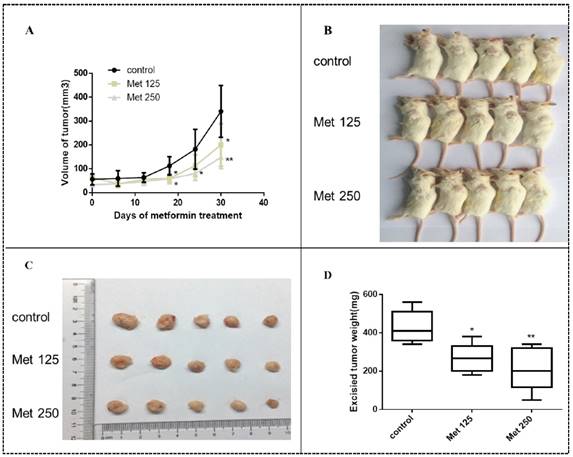
MDA-MB-231 cells were injected into SCID mice to develop tumors. Treatment with metformin at two different doses by intraperitoneal injection began 15 days later. Metformin inhibited tumor growth in vivo, resulting in smaller tumor volumes and lower tumor weights in the treated groups than in the untreated group (all, p<0.05-0.01; Figs. 10A-D). The significant effect of metformin on tumor growth was observed after 12 days of treatment (27 days after implantation; all panels, p<0.05; Fig. 10A). During the course of treatment, metformin did not cause noticeable side effects or changes in mouse body weight (Fig. S1).
Metformin inhibits breast cancer xenograft growth in SCID mice. Xenograft tumors were generated by subcutaneous implantation of MDA-MB-231 cells (5 mice/group). Fifteen days post injection, the animals were received metformin treatment (125 mg/kg/dose [Met 125]) or 250 mg/kg/dose [Met 250], respectively) every 2 days and continued for 30 days. (A) MDA-MB-231 xenograft tumors were assessed every 6 days during treatment; mean tumor volumes over time are shown. The xenograft tumor-bearing mice (B) and dissected tumors (C) are shown. (D) Average weights of the excised tumors by treatment group were determined.*p<0.05, **p<0.01, compared with the controls.
Metformin increases the expression of miR-200c and decreases the expression of c-Myc and AKT2 in vivo
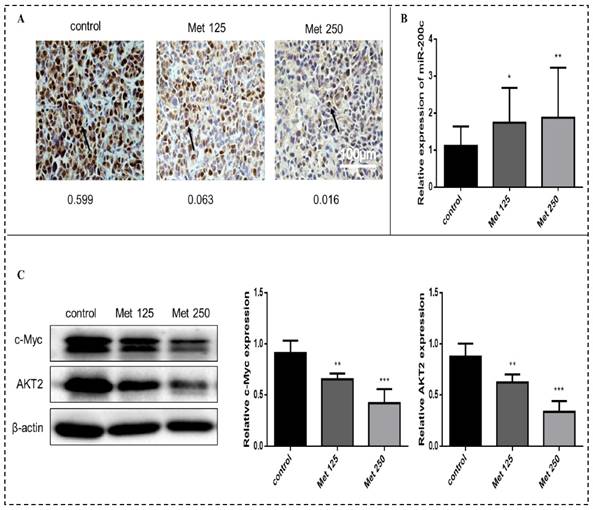
Immunohistochemical analysis revealed substantially fewer c-Myc-positive cells in tumor tissue sections from the metformin treatment groups than in tumor sections from the control group (Fig. 11A). The expression of miR-200c (quantitated by qPCR) was upregulated in the tumors after metformin treatment (p<0.05-0.01; Fig. 11B). Metformin treatment downregulated c-Myc and AKT2 protein levels (Fig. 11C). Bcl-2 expression did not differ significantly between the treatment groups and the control group.
Metformin increases miR-200c and reduces expression of c-Myc and AKT2 proteins in breast cancer xenografts in vivo. (A) The expression of c-Myc in tumor tissues from mice treated with vehicle (control), metformin 125 mg/kg [Met 125], or metformin 250 mg/kg [Met 250] was determined by immunohistochemical staining; representative images are shown (400× magnification). The arrow is pointing at c-Myc positive cells. The mean optical density (integrated optical density sum/area sum) of c-Myc positive cells was determined in the breast cancer tumor tissue and indicated under each image. (B) Expression of miR-200c was quantified by qPCR in tumor samples from each treatment group. (C) c-Myc and AKT2 protein levels were quantified by Western blot in tumor samples from each treatment group. *p<0.05, **p<0.01, ***p<0.001 compared with the controls.
Discussion
In this study, we demonstrated that metformin treatment significantly inhibited the proliferation, colony formation, migration, and invasion of MDA-MB-231, MCF-7, T-47-D, and BT549 breast cancer cells and induced their apoptosis. Metformin decreased expression of the c-Myc, AKT2, and Bcl-2 proteins and increased miR-200c expression in these cells. Moreover, metformin reduced breast tumor growth in SCID mice and increased the expression of miR-200c in the tumors.
The antineoplastic activity of metformin and its possible use as an adjuvant to traditional cancer therapies have been highlighted in numerous types of cancer [4, 31, 32]. Previous studies demonstrated that metformin restrained breast cancer cell proliferation, migration, and invasion and enhanced apoptosis [8, 24]. These findings are consistent with our results. Published in vitro and in vivo studies have shown that metformin could exert its antitumor effect by targeting multiple pathways, such as AMPK/mTOR, the inflammation pathway via inactivation of NF-κB, cell cycle/apoptosis, insulin/IGF-1R, and angiogenesis [32-34]. However, the mechanisms underlying metformin's effect on breast cancer and the miRNA pathways involved are still poorly understood. Our findings suggest that miR-200c plays a key role in the effect of metformin on breast cancer development and progression.
Data analysis has demonstrated that miR-200c over-expression in breast cancer tissue is significantly associated with improved survival in patients with breast cancer. MiR-200c may have a protective effect against breast cancer development and thus prolong the survival time of cancer patients. Sergio et al. suggested that patients with high expression levels of miR-200c had a better prognosis and a longer progression-free survival than those with low levels in stage I epithelial ovarian cancer [35]. Additionally, one study indicated that the expression of miR-200c was significantly decreased in the colorectal cancer tissue samples, and the miR-200c expression level was reversely correlated to tumor size, serosal invasion, lymph metastasis, and tumor-node-metastasis (TNM) [36]. These findings indicate that miR-200c possesses protective effects against cancer.
A great deal of evidence suggests that miR-200c is a tumor suppressor [22, 35, 36]. Previous studies showed miR-200c inhibited the clonogenicity of breast cancer cells and suppressed the growth of embryonal carcinoma cells in vitro, and was down-regulated in human breast cancer stem cells [37]. Overexpression of miR-200c and miR-141 in PC-3 cells impaired proliferation and survival [38]. A lower level of miR-200c is significantly associated with the growth and metastasis of colorectal carcinoma as well as a more advanced stage [36]. Our data show that metformin increased the miR-200c expression in both breast cancer cells and tumor tissue. Our results are consistent with those previous findings discussed above. However, Liu and colleagues reported that high expression of miR-200c has been found to be correlated with bigger tumor size and worse overall survival in non-small cell lung cancer patients [39]. The contrary findings may be due, in part, to the different tumor types and empirical method models. In the context of tumor development and progression, tumor cells display phenotypic and functional heterogeneity that might result in differential expression of some genes in different types of tumors or indifferent areas even in the same tumor. Our findings along with others prompted us to hypothesize that the antitumorigenic effects of metformin are mediated through upregulation of miR-200c expression, and our data show that metformin increased miR-200c expression in both breast cancer cells and tumor tissues.
Our findings showed that overexpression of miR-200c inhibited proliferation, colony formation, migration, and invasion of MDA-MB-231 and MCF-7 breast cancer cells and induced their apoptosis are similar to our findings on the effects of metformin treatment. Metformin also increased the expression of miR-200c directly in these breast cancer cells, reversing the carcinogenic effect of miR-200c knockdown. Experimental upregulation of miR-200c in breast cancer cells led to suppression of AKT2 and Bcl-2, whereas downregulation of miR-200c further upregulated AKT2 and Bcl-2 and promoted breast cancer progression. Using a miRNA target prediction website (Targetscan), we predicted two miR-200c bindings site in the AKT2 and Bcl-2 3'UTR, respectively. A recent study demonstrated that Bcl-2 is a direct target of miR-200c [40]. This data are consistent with our results. Another study suggested that one target of the inhibitory activity of AKT2 in prostate cancer is miR-200 family expression [41]. Yet there is no study to prove the direct relationship between miR-200c and AKT2. Several lines of evidence indicate that metformin inhibits the PI3K/Akt/mTOR signaling pathway independent of AMPK [8, 33]. The AKT family of kinases includes three members, AKT1, AKT2, and AKT3, which share a high degree of homology [42]. Arboleda and colleagues showed that AKT2 is an apoptosis suppressor and cell survival factor in breast cancer [12]. Our data suggest that altering the expression of AKT2 might be at least contributing part of the mechanism underlying the antitumor activity of metformin. However, the exact mechanisms of this association and the regulation between miR-200c and AKT2 need further in-depth investigation.
A previous study demonstrated that c-Myc-dependent transcriptional and posttranscriptional control of miRNAs and the resultant effects are involved in the Myc oncogenic program [41, 44]. We found that metformin not only increased miR-200c but also decreased c-Myc expression. Bai et al. suggested that c-Myc represses expression of the miR-200 family by direct binding to its promoter and showed that c-Myc negatively regulated miR-200 in endometrial carcinoma cell lines [45]. This is consistent with our findings, suggesting that c-Myc may participate in the metformin-induced upregulation of miR-200c.
Together, our data suggest that the altered expression of miR-200c induced by metformin might be involved in its antitumor activity and that miR-200c plays a key role in metformin-induced antitumor effects via targeting AKT2 and Bcl-2 in breast cancer cells.
Conclusions
The observed antitumor effects of metformin on breast cancer cells in vitro and in vivo are mediated by upregulation of miR-200c expression via targeting of AKT2 and Bcl-2. We propose that a metformin/c-Myc/miR-200c/AKT2/Bcl-2 axis contributes to the antitumorigenic effects of metformin in breast cancer and that miR-200c is a potential therapeutic target in breast cancers.
Supplementary Material
Fig. S1.
Competing Interests
The authors have declared that no competing interests exist.
References
1. Gonzalez N, Prieto I, Del Puerto-Nevado L. et al. 2017 update on the relationship between diabetes and colorectal cancer: epidemiology, potential molecular mechanisms and therapeutic implications. Oncotarget. 2017 doi: 10.18632/oncotarget.14472
2. Yu X, Mao W, Zhai Y. et al. Anti-tumor activity of metformin: from metabolic and epigenetic perspectives. Oncotarget. 2016 doi: 10.18632/oncotarget.13639
3. Tseng CH. Rosiglitazone reduces breast cancer risk in Taiwanese female patients with type 2 diabetes mellitus. Oncotarget. 2016 doi: 10.18632/oncotarget.13824
4. Chae YK, Arya A, Malecek MK. et al. Repurposing metformin for cancer treatment: current clinical studies. Oncotarget. 2016;7(26):40767-80
5. Coyle C, Cafferty FH, Vale C. et al. Metformin as an adjuvant treatment for cancer: a systematic review and meta-analysis. Ann Oncol. 2016;27(12):2184-95
6. Jiralerspong S, Palla SL, Giordano SH. et al. Metformin and pathologic complete responses to neoadjuvant chemotherapy in diabetic patients with breast cancer. J Clin Oncol. 2009;27(20):3297-302
7. Morales DR, Morris AD. Metformin in cancer treatment and prevention. Annu Rev Med. 2015;66:17-29
8. Cai H, Zhang Y, Han TK. et al. Cation-selective transporters are critical to the AMPK-mediated antiproliferative effects of metformin in human breast cancer cells. Int J Cancer. 2016;138(9):2281-92
9. Pulito C, Donzelli S, Muti P. et al. MicroRNAs and cancer metabolism reprogramming: the paradigm of metformin. Ann Transl Med. 2014;2(6):58
10. Gdowski A, Panchoo M, Treuren TV. et al. Emerging therapeutics for targeting Akt in cancer. Front Biosci (Landmark Ed). 2016;21:757-68
11. Santi SA, Lee H. Ablation of Akt2 induces autophagy through cell cycle arrest, the downregulation of p70S6K, and the deregulation of mitochondria in MDA-MB231 cells. PLoS One. 2011;6(1):e14614
12. Arboleda MJ, Lyons JF, Kabbinavar FF. et al. Overexpression of AKT2/protein kinase Bbeta leads to up-regulation of beta1 integrins, increased invasion, and metastasis of human breast and ovarian cancer cells. Cancer Res. 2003;63(1):196-206
13. Blandino G, Valerio M, Cioce M. et al. Metformin elicits anticancer effects through the sequential modulation of DICER and c-MYC. Nat Commun. 2012;3:865
14. Akinyeke T, Matsumura S, Wang X. et al. Metformin targets c-MYC oncogene to prevent prostate cancer. Carcinogenesis. 2013;34(12):2823-32
15. Souers AJ, Leverson JD, Boghaert ER. et al. ABT-199, a potent and selective BCL-2 inhibitor, achieves antitumor activity while sparing platelets. Nat Med. 2013;19(2):202-8
16. Lin Q, Ma L, Liu Z. et al. Targeting microRNAs: a new action mechanism of natural compounds. Oncotarget. 2016 doi: 10.18632/oncotarget.14392
17. Ji W, Sun B, Su C. Targeting microRNAs in cancer gene therapy. Genes (Basel). 2017:8 (1). doi: 10.3390/genes8010021
18. Bracken CP, Khew-Goodall Y, Goodall GJ. Network-based approaches to understand the roles of miR-200 and other microRNAs in Cancer. Cancer Res. 2015;75(13):2594-9
19. Haraguchi T, Kondo M, Uchikawa R. et al. Dynamics and plasticity of the epithelial to mesenchymal transition induced by miR-200 family inhibition. Sci Rep. 2016;6:21117
20. Sulaiman SA, Ab Mutalib NS, Jamal R. MiR-200c regulation of metastases in ovarian cancer: potential role in epithelial and mesenchymal transition. Front Pharmacol. 2016;7:271
21. Damiano V, Brisotto G, Borgna S. et al. Epigenetic silencing of miR-200c in breast cancer is associated with aggressiveness and is modulated by ZEB1. Genes Chromosomes Cancer. 2017;56(2):147-58
22. Song C, Liu LZ, Pei XQ. et al. MiR-200c inhibits breast cancer proliferation by targeting KRAS. Oncotarget. 2015;6(33):34968-78
23. Liu L, Qiu M, Tan G. et al. MiR-200c inhibits invasion, migration and proliferation of bladder cancer cells through down-regulation of BMI-1 and E2F3. J Transl Med. 2014;12:305
24. Wahdan-Alaswad RS, Cochrane DR, Spoelstra NS. et al. Metformin-induced killing of triple-negative breast cancer cells is mediated by reduction in fatty acid synthase via miRNA-193b. Horm Cancer. 2014;5(6):374-89
25. Yang J, Wei J, Wu Y. et al. Metformin induces ER stress-dependent apoptosis through miR-708-5p/NNAT pathway in prostate cancer. Oncogenesis. 2015;4:e158
26. Li W, Yuan Y, Huang L. et al. Metformin alters the expression profiles of microRNAs in human pancreatic cancer cells. Diabetes Res Clin Pract. 2012;96(2):187-95
27. Cufi S, Vazquez-Martin A, Oliveras-Ferraros C. et al. Metformin lowers the threshold for stress-induced senescence: a role for the microRNA-200 family and miR-205. Cell Cycle. 2012;11(6):1235-46
28. Bao B, Wang Z, Ali S. et al. Metformin inhibits cell proliferation, migration and invasion by attenuating CSC function mediated by deregulating miRNAs in pancreatic cancer cells. Cancer Prev Res (Phila). 2012;5(3):355-64
29. Yang X, Yang Y, Gan R. et al. Down-regulation of mir-221 and mir-222 restrain prostate cancer cell proliferation and migration that is partly mediated by activation of SIRT1. PLoS One. 2014;9(6):e98833
30. Chen X, Li C, He T. et al. Metformin inhibits prostate cancer cell proliferation, migration, and tumor growth through upregulation of PEDF expression. Cancer Biol Ther. 2016;17(5):507-14
31. Lee H, Park HJ, Park CS. et al. Response of breast cancer cells and cancer stem cells to metformin and hyperthermia alone or combined. PLoS One. 2014;9(2):e87979
32. Wahdan-Alaswad R, Harrell JC, Fan Z. et al. Metformin attenuates transforming growth factor beta (TGF-beta) mediated oncogenesis in mesenchymal stem-like/claudin-low triple negative breast cancer. Cell Cycle. 2016;15(8):1046-59
33. Alalem M, Ray A, Ray BK. Metformin induces degradation of mTOR protein in breast cancer cells. Cancer Med. 2016;5(11):3194-204
34. Picone P, Nuzzo D, Caruana L. et al. Metformin increases APP expression and processing via oxidative stress, mitochondrial dysfunction and NF-kappaB activation: Use of insulin to attenuate metformin's effect. Biochim Biophys Acta. 2015;1853(5):1046-59
35. Marchini S, Cavalieri D, Fruscio R. et al. Association between miR-200c and the survival of patients with stage I epithelial ovarian cancer: a retrospective study of two independent tumour tissue collections. Lancet Oncol. 2011;12(3):273-85
36. Lu YX, Yuan L, Xue XL. et al. Regulation of colorectal carcinoma stemness, growth, and metastasis by an miR-200c-Sox2-negative feedback loop mechanism. Clin Cancer Res. 2014;20(10):2631-42
37. Shimono Y, Zabala M, Cho RW. et al. Downregulation of miRNA-200c links breast cancer stem cells with normal stem cells. Cell. 2009;138(3):592-603
38. Vallejo DM, Caparros E, Dominguez M. Targeting Notch signalling by the conserved miR-8/200 microRNA family in development and cancer cells. EMBO J. 2011;30(4):756-69
39. Liu XG, Zhu WY, Huang YY. et al. High expression of serum miR-21 and tumor miR-200c associated with poor prognosis in patients with lung cancer. Med Oncol. 2012;29(2):618-26
40. Zhong X, Zheng L, Shen J. et al. Suppression of microRNA 200 family expression by oncogenic KRAS activation promotes cell survival and epithelial-mesenchymal transition in KRAS-Driven Cancer. Mol Cell Biol. 2016;36(21):2742-54
41. Virtakoivu R, Pellinen T, Rantala JK. et al. Distinct roles of AKT isoforms in regulating beta1-integrin activity, migration, and invasion in prostate cancer. Mol Biol Cell. 2012;23(17):3357-69
42. Haggblad Sahlberg S, Mortensen AC, Haglof J. et al. Different functions of AKT1 and AKT2 in molecular pathways, cell migration and metabolism in colon cancer cells. Int J Oncol. 2017;50(1):5-14
43. Mao A, Zhao Q, Zhou X. et al. MicroRNA-449a enhances radiosensitivity by downregulation of c-Myc in prostate cancer cells. Sci Rep. 2016;6:27346
44. Psathas JN, Thomas-Tikhonenko A. MYC and the art of microRNA maintenance. Cold Spring Harb Perspect Med. 2014:4 (8). doi: 10.1101/cshperspect.a014175
45. Bai JX, Yan B, Zhao ZN. et al. Tamoxifen represses miR-200 microRNAs and promotes epithelial-to-mesenchymal transition by up-regulating c-Myc in endometrial carcinoma cell lines. Endocrinology. 2013;154(2):635-45
Author contact
![]() Corresponding author: JianxinLyu, jxlu313com; or Qing HMeng, qhmengorg
Corresponding author: JianxinLyu, jxlu313com; or Qing HMeng, qhmengorg