3.2
Impact Factor
ISSN: 1837-9664
J Cancer 2017; 8(14):2740-2755. doi:10.7150/jca.18073 This issue Cite
Research Paper
Microarray Analysis of the Expression Profile of Long Non-Coding RNAs Indicates lncRNA RP11-263F15.1 as a Biomarker for Diagnosis and Prognostic Prediction of Pancreatic Ductal Adenocarcinoma
Department of Pathology, Changhai Hospital, Second Military Medical University, Shanghai 200433, China
* Xiaoyi Huang, Na Ta and Yunshuo Zhang contributed equally to this work.
Received 2016-10-25; Accepted 2017-3-16; Published 2017-8-22
Abstract
Pancreatic ductal adenocarcinoma (PDAC) is a devastating malignancy with poor prognostic outcomes. Accumulating evidence has demonstrated that long non-coding RNAs (lncRNAs) play an important role in the development and progression of carcinogenesis. Nevertheless, little is known about the role of lncRNAs in PDAC. The aim of the current study was to find differentially expressed lncRNAs and related mRNAs in human PDAC tissues and adjacent normal tissues by microarray analysis, and investigate the relationship between lncRNA RP11-263F15.1 levels and the clinicaopathological features of PDAC patients. It was found that 4364 lncRNAs and 4862 related mRNAs were significantly dysregulated in PDAC tissues as compared with adjacent normal tissues with a fold change ≥2.0 (P<0.05). GO and pathway analyses showed that the up-regulated gene profiles were related to several pathways associated with carcinogenesis, while the down-regulated gene profiles were closely correlated with nutrient metabolism. RP11-263F15.1 levels were associated with histologic differentiation (P=0.001). Besides, Kaplan-Meier analysis showed that high expression of RP11-263F15.1 was associated with poor outcomes, but multivariate analysis suggested that RP11-263F15.1 was not an independent factor for predicting prognosis of PDAC. In conclusion, these data indicate that differentially expressed lncRNAs and mRNAs were involved in the carcinogenesis of PDAC, and RP11-263F15.1 may prove to be a potential biomarker for the diagnosis and prognostic prediction of PDAC.
Keywords: Microarray, lncRNA, pancreatic ductal adenocarcinoma, diagnosis, prognosis.
Introduction
Pancreatic ductal adenocarcinoma (PDAC) remains one of the most devastating malignancies with a 5-year survival rate less than 5% [1]. Early diagnosis in combination with comprehensive therapies including surgical resection, adjuvant chemotherapy and radiotherapy can increase the 5-year survival rate significantly [2]. The clinical symptoms of PDAC are usually insidious due to the concealed location. When the PDAC tumor is large enough to affect the adjacent organs or nerves, it is often too advanced to be treated radically. Currently, carbohydrate antigen 19-9 (CA 19-9) is widely acknowledged as a marker of PDAC diagnosis [3], but it is not an ideal tumor biomarker for early diagnosis of PDAC due to its low sensitivity [4]. Thus, it is necessary to search novel biomarkers for early diagnosis of PDAC for the sake of reducing the high morbidity and mortality of PDAC.
Long non-coding RNA (lncRNA) generally refers to any non-coding RNA with a length of more than 200bp and without protein coding potential [5]. Although IncRNA was suggested as “junk” in the human genome, increasing evidence has revealed that lncRNA has multiple biological functions in gene expression including epigenetic regulation, transcriptional interference and post-transcriptional regulation [6-8]. Over the past few years, comprehensive studies have demonstrated that lncRNA is closely related to the progression of a variety of diseases including autoimmune diseases, cardiovascular diseases and cancers [9-12]. Notably, previous studies showed that some lncRNAs aberrantly expressed in the process of tumorigenesis and cancer progression, suggesting that they may be potential biomarkers for the diagnosis and prognostic prediction of cancer patients [13]. Zhou et al. [14] reported that the expression level of H19 in the plasma of gastric cancer patients was significantly higher than that in healthy controls. Li and colleagues reported that lncRNA ZFAS1 functioned as an oncogene in hepatocellular carcinoma (HCC) and was associated with poor prognosis and metastasis [15]. Several lncRNAs (AFAP1-AS1, ENST00000480739 and BC008363) also showed a potential diagnostic or prognostic value in patients with PDAC [16-18]. However, the role of lncRNA involvement in carcinogenesis and cancer progression remains unknown entirely.
In the present study, we analyzed and compared lncRNA and mRNA expression profiles between PDAC tissues and paired adjacent noncancerous tissues by microarray, and consequently validated them by RT-qPCR, hoping that the obtained results would provide further insights into the pathogenesis of PDAC.
Materials and Methods
Patients and tissue collection
Included in this study were 71 cancer tissues and 71 adjacent normal tissues obtained from PDAC patients who underwent radical or partial resection of the pancreas at Changhai Hospital (Shanghai, China) between April 2014 and March 2016. No patient had received chemotherapy or radiotherapy before sample collection. The corresponding adjacent non-cancerous tissues were taken at least 5cm away from the tumor edge. All the specimens were stored with RNAlater® Solution (life technologies, Carlsbad, CA) at 4°C overnight, and then transferred to -80°C for long-term storage after removing the supernatant. The diagnosis of PDAC in all patients was confirmed by histopathology by two experienced pathologists (Hui Jiang and Jianming Zheng). Clinicopathological data were obtained from the Department of Pathology, Changhai Hospital. Amongst these specimens, 10 (5 pairs) were used for lncRNA microarray analysis, and 66 pairs were analyzed to validate the microarray results by RT-qPCR.
RNA extraction and reverse transcription
Total RNA was extracted from the frozen PDAC tissues and corresponding adjacent normal tissues by RNAiso Plus (TAKARA, Dalian, China). Each specimen was quantified with the NanoDrop Lite spectrophotometer (Thermo Scientific, MA) and RNA integrity was assessed by standard denaturing agarose gel electrophoresis. Total-RNA (1000ng) was converted to cDNA by reverse-transcription with ReverTra Ace qPCR RT Kit (TOYOBO, Osaka, Japan). The reverse transcription procedure was performed at 65℃ for 5 min, 42℃ for 18 min, and 98℃ for 5min.
Microarray analysis
In total, 10 specimens (5 pairs) obtained from PDAC patients were included in human microarray analysis by using the Agilent Array platform (Agilent Technology) according to the manufacturer's standard protocols. After removal of rRNA, mRNA was purified from total RNA with mRNA-ONLY™ Eukaryotic mRNA Isolation Kit (Epicentre, WI). Then, each specimen was amplified and transcribed into fluorescent cRNA along the entire length of the transcripts without 3' bias by a random priming method. The labeled cRNAs were hybridized onto the Human LncRNA Array v2.0 (8 x 60K, Arraystar). The slices were washed and the arrays were scanned with Agilent Scanner (G2505B). The acquired array images were analyzed by using Agilent Feature Extraction software (version 10.7.3.1). Quantile normalization and subsequent data processing were performed using the GeneSpring GX v11.5.1 software package (Agilent Technologies). Differentially expressed LncRNAs and mRNAs with statistical significance between the two groups were identified through Volcano Plot filtering. Differentially expressed LncRNAs and mRNAs between two paired specimens were identified through Fold Change filtering.
Gene Ontology (GO) enrichment and KEGG pathway analysis
GO analysis is a functional analysis associating differentially expressed mRNAs with GO categories. The GO categories are derived from Gene Ontology (www.geneontology.org), which comprise three structured networks of defined terms that describe gene product attributes. The P-value denotes the significance of GO Term enrichment in the differentially expressed mRNA list. Besides, Base on the latest Kyoto Encyclopedia of Genes and Genomes (KEGG) database, we provided pathway analysis for differentially expressed mRNAs, knowing that this analysis allows users to determine whether the biological pathway has a significant enrichment of differentially expressed mRNAs. The P-value denotes the significance of the Pathway. The less the P-value is, the more significant the GO Term and the Pathway are (The P-value cut-off is 0.05).
Real-time polymerase chain reaction (PCR)
Subsequently, cDNA was subjected to a polymerase chain reaction (PCR) amplification step in triplicate using the Step One Plus™ System (Life Technologies, Waltham, MA). Real-time PCR was conducted by using SYBR Premix Ex Taq (TliRNaseH Plus) (TAKARA, Dalian, China) with ROX Reference Dye. All the ΔCt values of the specimens were normalized to the endogenous control U6 level. The details of primers used in PCR are shown in Table 1. The PCR amplification cycle was applied as follows: one cycle at 95℃ for min; 40 cycles of 95℃ for 5s, and 60℃ for 30 s.
Primers used for cDNA synthesis and real-time PCR of lncRNAs
| NAME | Prime Sequence | Length |
|---|---|---|
| U6 | F: 5' CTCGCTTCGGCAGCACA | 94bp |
| R: 5' AACGCTTCACGAATTTGCGT | ||
| CTD-2244C20.1 | F: 5' TCACTCACAGGATGCAGAAG | 100bp |
| R: 5' CCAATCCATTCCGAGTACTT | ||
| RP11-263F15.1 | F: 5' GGATGCTGAAGCCTGGTT | 150bp |
| R: 5' TTCATGCTCAGCCGTGACT | ||
| LOC541471 | F: 5' TGGGAGATGAAACAGGAAGCT | 120bp |
| R: 5' CTGCATTCCGGCTGTGATC | ||
| STK16 | F: 5' CGTTCAAGCTCATACATGGT | 120bp |
| R: 5' GGTTTGAAGCCCAGCTAAG | ||
| AF293366 | F: 5' AGTCAATGATAAACTCACAAGT | 129bp |
| R: 5' TCCTTCATTCTTTGACCGTG | ||
| BC031940 | F: 5' TCAGCGGAGGCACATTTCTA | 130bp |
| R: 5' CCAACTCTTGCCAACCATCA | ||
| BC047917 | F: 5' CGGTTGGGTCTGTTCTTG | 112bp |
| R: 5' AGGGTGGGTCTATGTCTG |
Statistical analysis
All the statistical analyses were conducted by SPSS 19.0 (SPSS, INC; Chicago, IL). Independent-samples t-test was used in differential expression levels of lncRNAs and mRNAs. GO and KEGG pathway analyses were evaluated by Fisher's exact test. χ2-test was used to estimate the differences between groups. Kaplan-Meier analysis (KM analysis), univariate and multivariate Cox regression were applied to evaluate the outcomes of patients with PDAC. Two-tailed P value was employed and P<0.05 was considered statistically significant.
Results
Microarray expression profiles
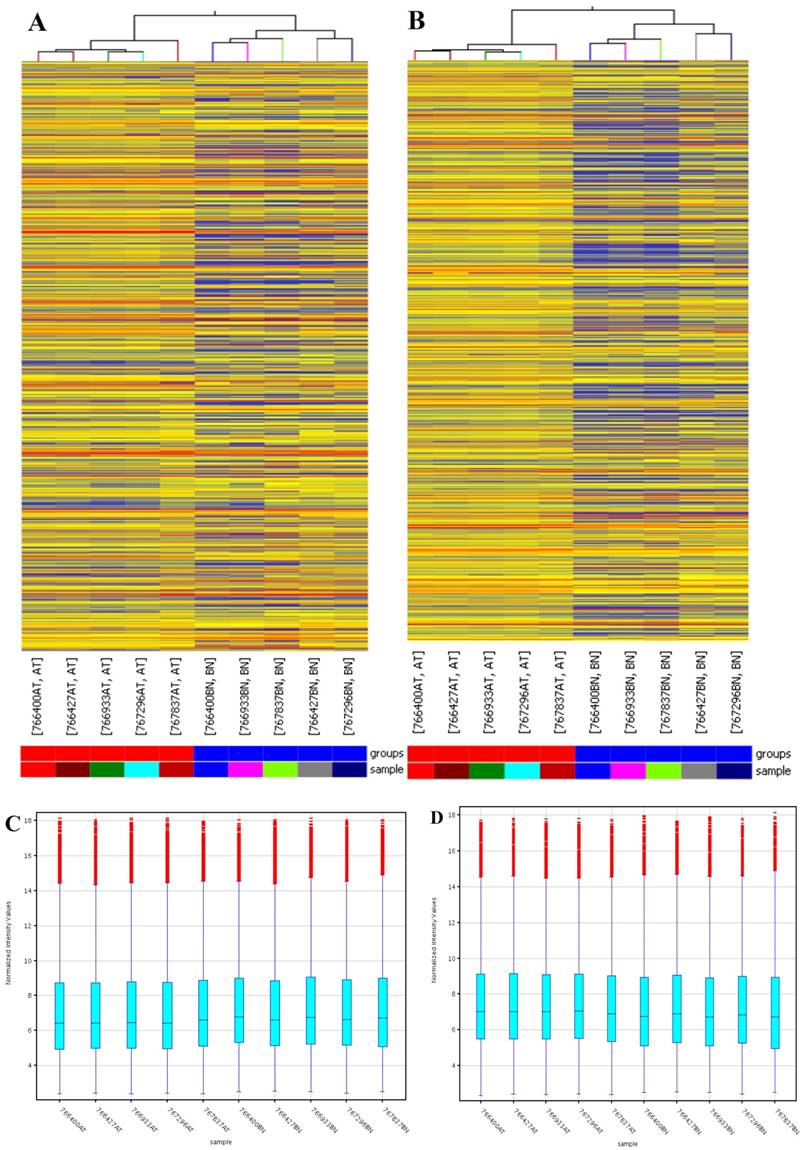
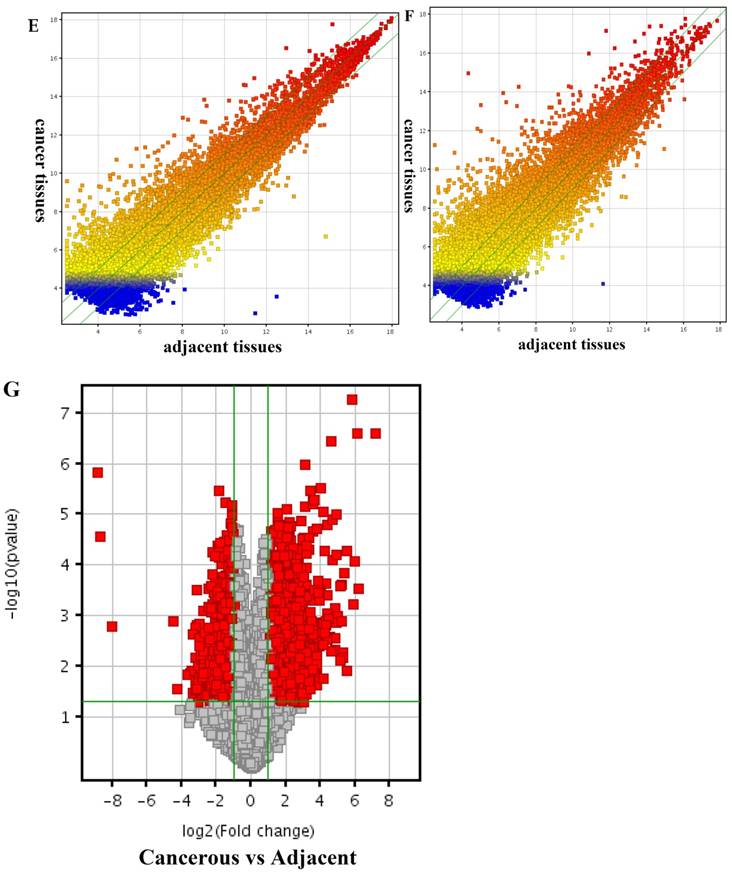
Arraystar (Rockville, MD) Human LncRNA Microarray v2.0 is designed for global profiling of human LncRNAs and protein-coding transcripts. 33,045 LncRNAs and 30,215 coding transcripts can be detected by the second-generation LncRNA microarray. According to microarray data, a total of 4364 significantly dysregulated lncRNAs (Fold Change ≥2.0, P<0.05) including 2365 up-regulated and 1999 down-regulated lncRNAs were found to be differentially expressed between the PDAC and corresponding adjacent normal tissues (Fig 1). In addition, 3857 up-regulated mRNAs and 1005 down-regulated mRNAs were determined between them (Fold Change ≥2.0, P<0.05).
GO and KEGG pathway analyses
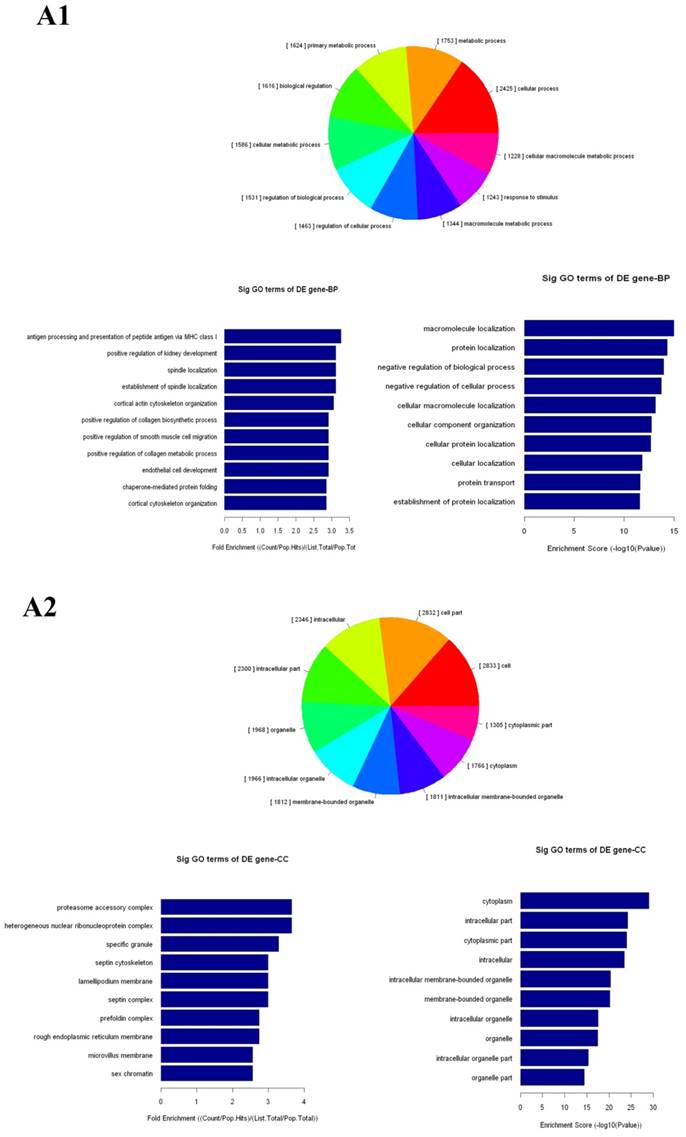
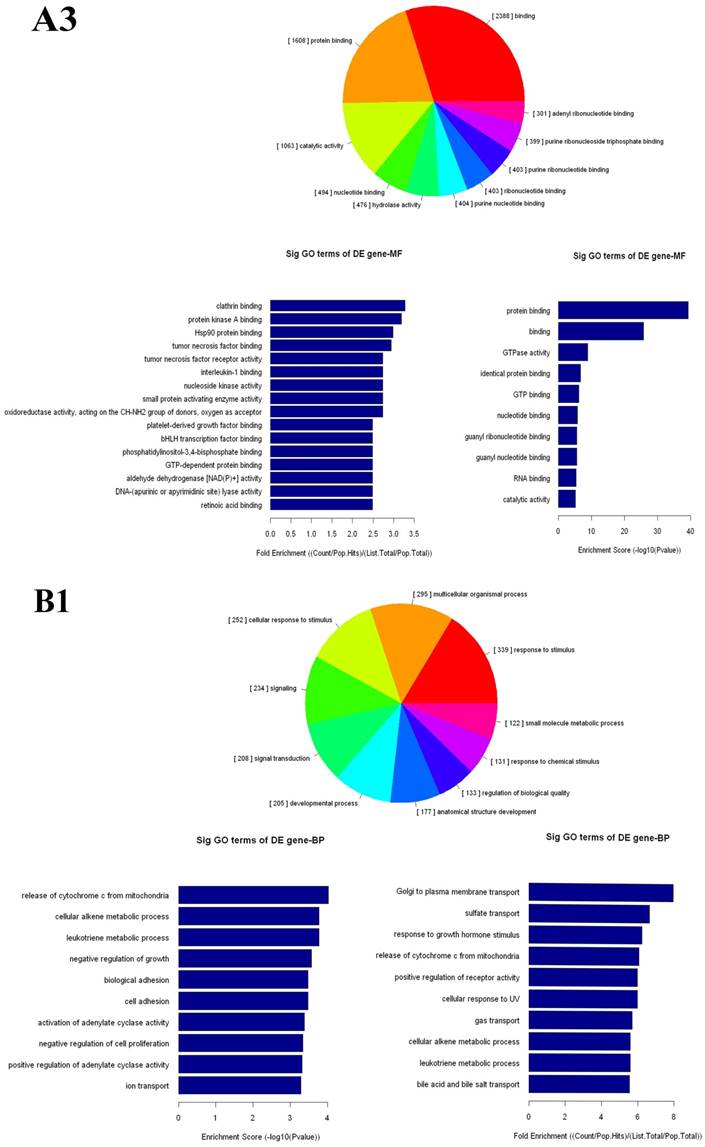
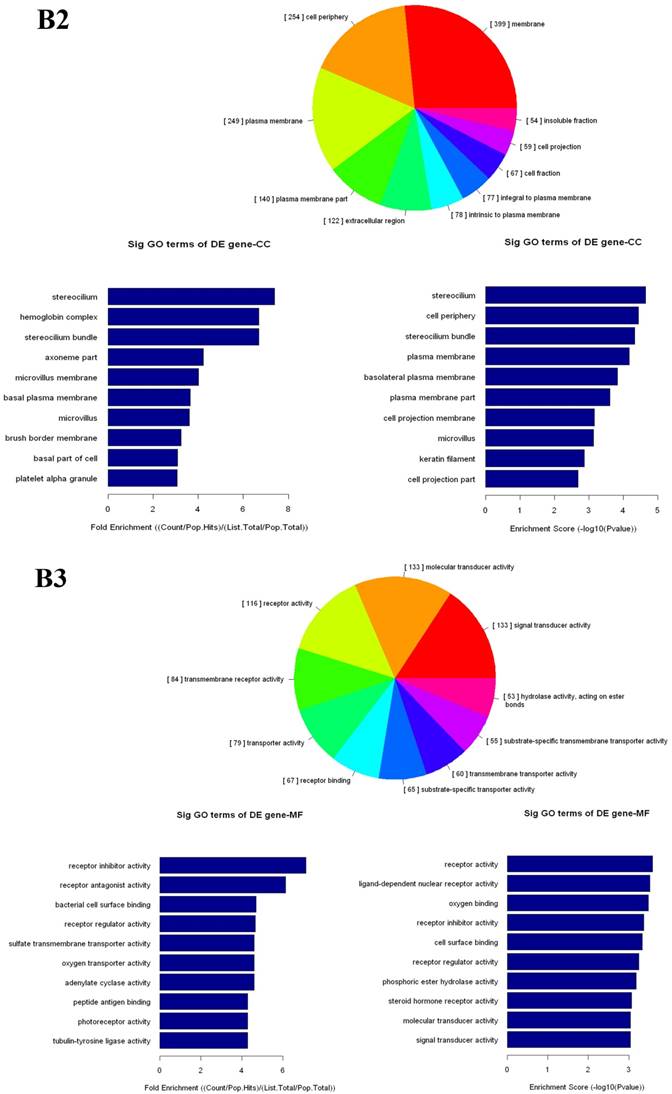
The up- and down-regulated mRNAs were analyzed in GO analysis (www.geneontology.org). Gene and gene product enrichment including biological processes, cellular components and molecular functions were determined in GO analysis. In the GO analysis, the highest enriched GO targeted by up-regulated transcripts was macromolecular localization (biological process [BP]), cytoplasm (cellular component [CC]) and protein binding (molecular function [MF]). Meanwhile, release of cytochrome c from mitochondria (BP), stereocilium (CC) and rector activity (MF) were the highest enriched GOs targeted by down-regulated transcripts (Fig 2).
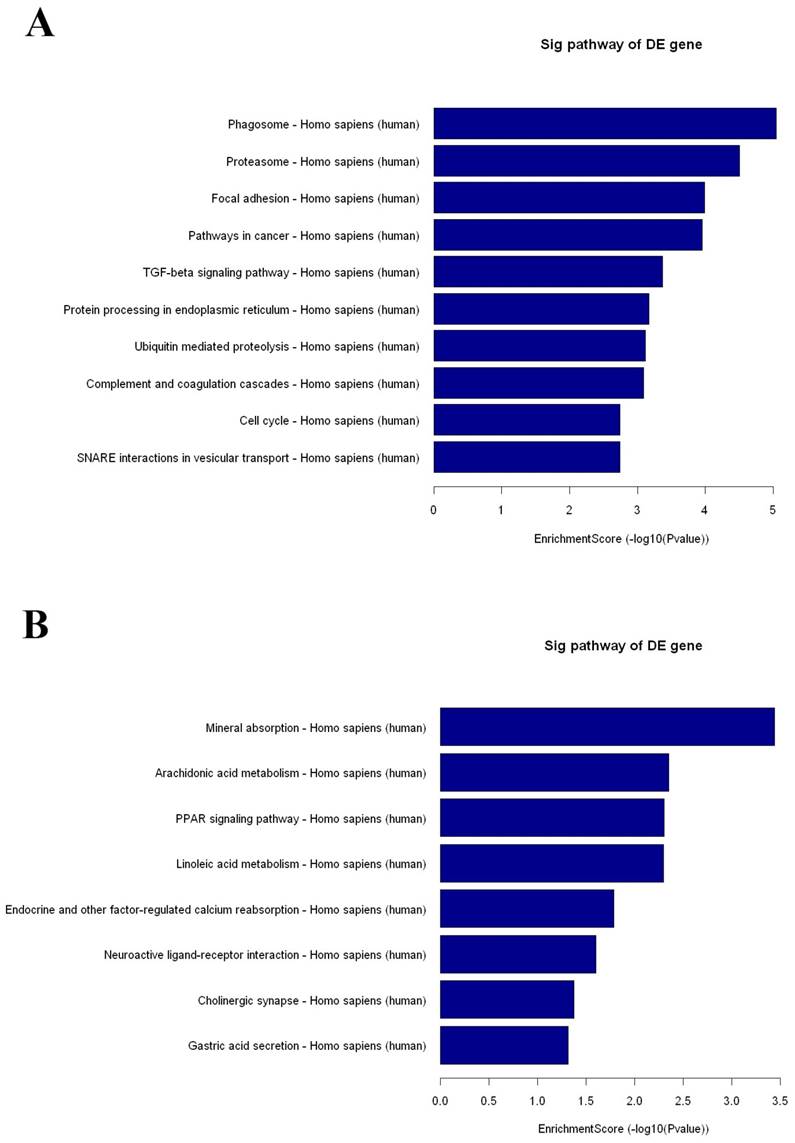
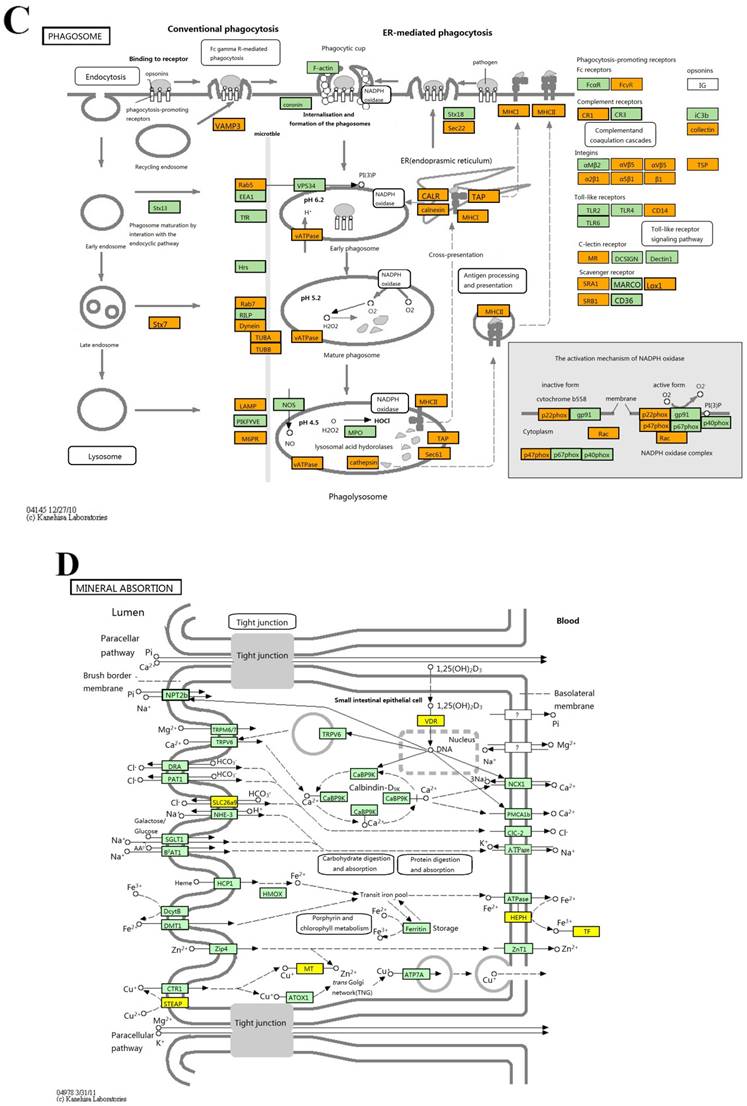
KEGG pathway analysis identified 42 and 8 gene pathways by up- and down regulated mRNAs, and the top 10 pathways related to up- and 8 pathways related to down-regulated mRNAs are shown in Fig 3. In KEGG analysis of the up-regulated transcripts, the most enriched network was “Phagosome-Homo sapiens (human)” (Fisher P value= 9.10703E-06). What is more, the pathway analysis was also proven to be related to PDAC-associated biological behaviors, such as pathways in cancer, TGF-beta signaling pathway and cell cycle (Fig 3A). As for pathway analysis of the down-regulated transcripts, the top pathways were Mineral absorption, Arachidonic acid metabolism and PPAR signaling pathway (Fig 3B).
Differentially expressed lncRNAs and mRNAs in pancreatic adenocarcinoma (PDAC) and adjacent normal tissues. Hierarchical cluster analysis of PDAC and adjacent normal tissues was performed to assess the significant expression of lncRNAs (A) and mRNAs (B). The Box Plot shows the distributions of the intensities from the cancerous and adjacent tissues in lncRNAs (C) and mRNAs (D). After normalization, the distributions of log2-ratios among all specimens were nearly the same. The Scatter-Plot shows differences in the expression of lncRNAs (E) and mRNAs (F) between the PDAC and adjacent normal tissues. The green lines are fold-change lines (The default fold-change value given is 2.0). The lncRNAs and mRNAs above the top green line and below the bottom green line indicate more than 2.0 fold change of lncRNAs and mRNAs between the PDAC and adjacent normal tissues. The volcano plot illustrates the distribution of the data in the lncRNA profile (G). The green line in the volcano plot shows the significant fold-hange in lncRNAs.
RT-PCR validation
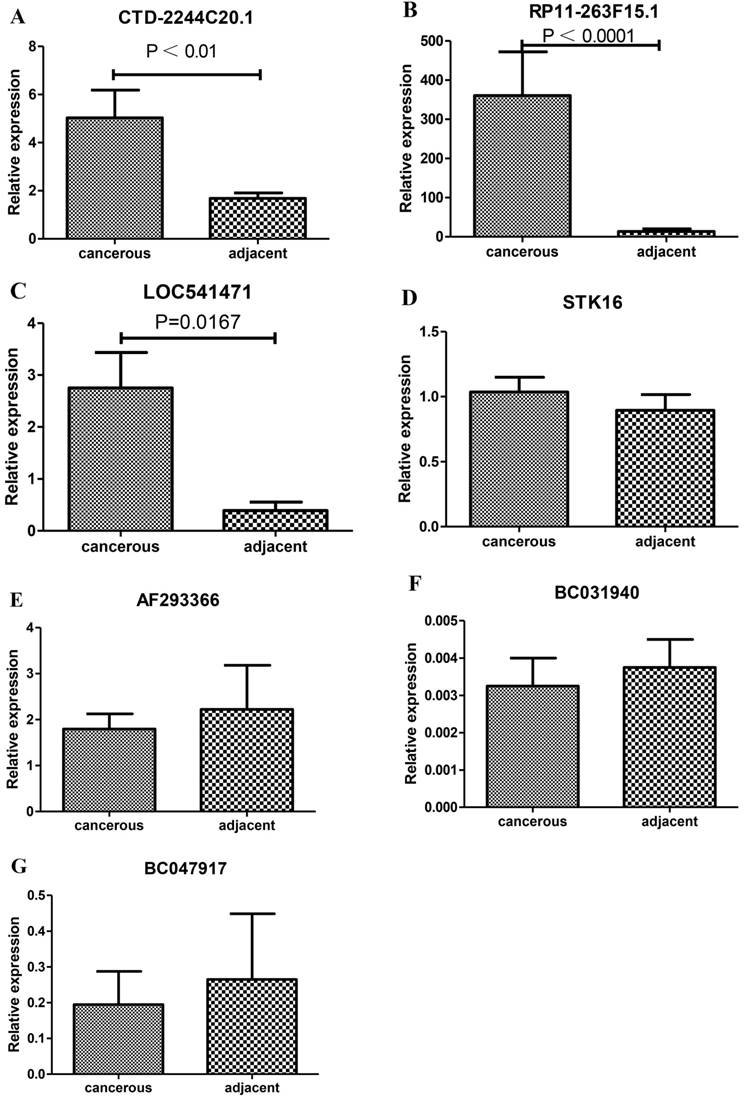
For further study, we selected 7 significantly differentially expressed lncRNAs (CTD-2244C20.1, RP11-263F15.1, LOC541471, STK16, AF293366, BC031940 and BC047917) to conduct RT-PCR for validating the expression levels of lncRNAs in 5 PDAC tissues and the corresponding adjacent tissues. As a result, CTD-2244C20.1, RP11-263F15.1 and LOC541471 were found to be significantly over-expressed in the cancer tissues, while the other lncRNAs did not undergo significant changes (Fig 4).
Gene Ontology (GO) analysis of mRNAs. A1-A3: The highest enriched GO targeted by up-regulated transcripts in the biological process (BP) (A1), cellular component (CC) (A2) and molecular function (MF) (A3). B1-B3: The highest enriched GO targeted by up-regulated transcripts in the BP (B1), CC (B2) and MF (B3).
The results of KEGG pathway analysis. The top 10 pathways of up-regulated mRNAs (A) and all the pathways of down-regulated mRNAs (B) are listed, showing the leading pathways associated with the up-regulated (C) and down-regulated (D) mRNAs.
Verification of the expression levels of selected lncRNAs between the PDAC and adjacent normal tissues by RT-PCR. A-G shows the expression levels of CTD-2244C20.1, RP11-263F15.1, LOC541471, STK16, AF293366, BC031940 and BC04791, respectively.
Clinicopathological features and diagnostic significance of lncRNA RP11-263F15.1
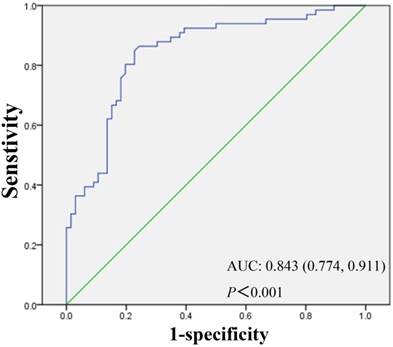
Knowing that lncRNA RP11-263F15.1 was over-expressed significantly in PDAC tissues compared with that in adjacent non-cancerous tissues (P<0.001), we then summarized the relationship between lncRNA RP11-263F15.1 expression and the clinicopathological characteristics of the other 66 PDAC patients by categorizing lncRNA RP11-263F15.1 expression as high or low versus the adjacent non-cancerous tissues. As shown in Table 2, lncRNA RP11-263F15.1 was association with histologic differentiation of PDAC cells (Table 2). No significant correlation was observed between RP11-263F15.1 expression level and age, gender, tumor diameter and location, lymph node metastasis, distant metastasis and perineural invasion. To determine whether RP11-263F15.1 could be identified as a novel biomarker to distinguish PDAC from non-cancerous tissues, receiver operating characteristic (ROC) curve was constructed by grouping all cancer and normal tissue specimens into a class. The expression level of RP11-263F15.1 was obtained from RT-PCR of a cohort of the 66 PDAC patients. The area under the curve (AUC) was 0.843 (95% confidence intervals [CI] =0.774-0.911, P<0.001) (Fig 5), indicating that RP11-263F15.1 may be a potential diagnostic biomarker of PDAC.
Assessment of the diagnostic value of RP11-263F15.1 by receiver operating characteristic (ROC) curve. AUC was 0.843 and 95% CI was 0.774-0.911.
Prognostic value of RP11-263F15.1 in PDAC patients
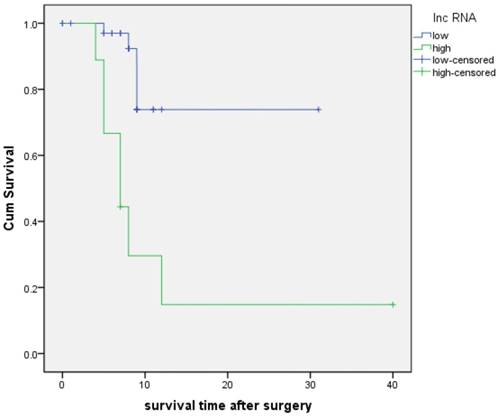
A follow-up study was conducted to assess the prognostic value of RP11-263F15.1. As shown in Fig 6, the KM analysis revealed that high expression of RP11-263F15.1 was associated with a shorter overall survival (OS) (median OS:12.0 months) as compared the low-expression group (median OS:25.1 months) (P<0.001). Besides, univariate Cox regression of OS revealed that high expression of RP11-263F15.1 (P=0.001) and poor histologic differentiation (P=0.021) were prognostic factors. However, the multivariate analysis suggested that RP11-263F15.1 expression and poor histologic differentiation were not independent prognostic indicators in patients with PDAC (Table 3).
Discussion
Pancreatic ductal adenocarcinoma is the commonest form of pancreatic cancer with a low survival rate due to its highly malignant behavior [18, 19]. Our current understanding about the pathogenesis of PDAC mainly depends on numerous protein-coding genes, knowing that some protein-coding genes play important roles in the initiation and progression of PDAC. It was reported [20] that KRAS mutation was detectable in 95% human PDAC cases, and the acquisition of mutant KRAS was an initial event in PDAC. Mutant KRAS gene was found to be a driver of PDAC development through promoting cell proliferation, differentiation and invasion [21, 22]. Nevertheless, the molecular mechanism underlying PDAC has not been clarified clearly, making PDAC a clinically challenging disease [23]. In recent years, emerging evidence has demonstrated that lncRNAs play important roles in multiple functions in PDAC, including cell growth, survival, invasion, metastasis, angiogenesis and apoptosis [24]. Identification of lncRNA involvement in the carcinogenesis of PDAC may provide new strategies for the diagnosis and treatment of PDAC.
The clinical characteristics of patients with pancreatic ductal adenocarcinoma
| Characteristics | Cases (N) | Lnc RP11-263F15.1 expression | P-value | |||
|---|---|---|---|---|---|---|
| High | % | Low | % | |||
| Age | ||||||
| <65 | 34 | 5 | 7.58 | 29 | 43.94 | 0.660 |
| ≥65 | 32 | 6 | 9.09 | 26 | 39.39 | |
| Gender | ||||||
| Male | 33 | 6 | 9.09 | 27 | 40.91 | 0.740 |
| Female | 33 | 5 | 7.58 | 28 | 42.42 | |
| Diameter | ||||||
| <3cm | 15 | 1 | 1.64 | 14 | 22.95 | 0.726 |
| ≥3cm | 46 | 7 | 11.48 | 39 | 63.93 | |
| Location | ||||||
| head | 35 | 5 | 8.06 | 30 | 48.39 | 0.226 |
| Body and tail | 27 | 6 | 9.68 | 21 | 33.87 | |
| Histologic differentiation | ||||||
| Well and moderately | 38 | 2 | 3.39 | 36 | 61.02 | 0.001* |
| Poorly | 21 | 9 | 15.25 | 12 | 20.34 | |
| pT stage | ||||||
| T1andT2 | 6 | 1 | 1.96 | 5 | 9.80 | 0.548 |
| T3 andT4 | 45 | 5 | 9.80 | 40 | 78.43 | |
| Lymph node metastasis | ||||||
| Present | 33 | 5 | 9.80 | 28 | 54.90 | 0.093 |
| Absent | 18 | 1 | 1.96 | 17 | 33.33 | |
| Metastasis | ||||||
| Present | 12 | 5 | 8.93 | 7 | 12.50 | 0.079 |
| Absent | 44 | 6 | 10.71 | 38 | 67.86 | |
| Perineural invasion | ||||||
| Yes | 48 | 7 | 12.28 | 41 | 71.93 | 0.379 |
| No | 9 | 3 | 5.26 | 6 | 10.53 | |
*Statistically significant (p<0.05)
In the present study, we conducted a microarray to explore the expression of lncRNA and mRNA in the PDAC tissues versus the corresponding adjacent non-cancerous tissues, and found 2365 up-regulated and 1999 down-regulated lncRNAs in PDAC tissues versus adjacent non-cancerous tissues. Meanwhile, 3857 up-regulated mRNAs and 1005 down-regulated mRNAs were detected in PDAC tissues versus adjacent non-cancerous tissues. Our microarray analysis suggested that lncRNAs may play functional roles in the process of PDAC tumorigenesis. Previous studies investigated the lncRNA expression profile of pancreatic cancer tissues by microarray. Fu et al. [25] analyzed PDAC microarray datasets and identified 34 differentially expressed lncRNAs in PDAC. In addition, they found that AFAP1-AS1, UCA1 and ENSG00000218510 were involved in PDAC carcinogenesis. Zhou and colleagues [26] investigated the lncRNA expression pattern in 3 pairs of PDAC versus adjacent non-cancerous tissues and found 2331 up-regulated and 1641 down-regulated lncRNAs in PDAC versus adjacent non-cancerous tissues. Consequently, the expression of HOTAIRM1 was confirmed in a small cohort of 12 PDAC patients by qRT-PCR. The lncRNA microarray provides a practical method to discover novel lncRNAs involved in PDAC tumorigenesis. The microarray studies on PDAC-related lncRNAs are summarized in Table 4.
The Kaplan-Meier analysis of patients with PDAC between higher (median: 12.0 months) and lower (median: 25.1 months) RP11-263F15.1 groups (P<0.001).
Univariate and multivariate survival analysis in patients with PDAC.
| Characteristics | Univariate analysis | Multivariate analysis | ||||
|---|---|---|---|---|---|---|
| HR | 95%CI | P | HR | 95%CI | P | |
| Age (≥65 vs.<65) | 0.499 | 0.132-1.892 | 0.286 | 0.775 | 0.108-5.545 | 0.800 |
| Gender (Male vs. Female) | 0.497 | 0.144-1.716 | 0.258 | 0.244 | 0.018-3.237 | 0.285 |
| Diameter (≥3cm vs.<3cm) | 0.551 | 0.160-1.898 | 0.345 | 1.906 | 0.242-14.984 | 0.540 |
| Location (head vs. distal) | 0.524 | 0.138-1.986 | 0.342 | 0.378 | 0.052-2.745 | 0.336 |
| Histologic differentiation (well vs. poorly) | 0.232 | 0.067-0.805 | 0.021* | 1.718 | 0.022-131.629 | 0.807 |
| Lymph node metastasis (Yes vs. No) | 0.297 | 0.077-1.146 | 0.060 | 0.043 | 0.001-2.238 | 0.119 |
| Metastasis (Yes vs. No) | 2.261 | 0.583-8.766 | 0.238 | 4.259 | 0.217-83.579 | 0.340 |
| Perineural invasion (Yes vs. No) | 0.470 | 0.123-1.804 | 0.271 | 1.904 | 0.061-59.226 | 0.713 |
| RP11-263F15.1 expression (high vs. low) | 7.580 | 2.169-26.494 | 0.001* | 2.646 | 0.772-710.534 | 0.076 |
* Statistically significant (p<0.05)
Summary of microarray studies on lncRNA related to PDAC.
| Author | Country | Publish year | Data source | Sample size in microarray | Differently expressed lncRNAs and mRNAs | Candidate lncRNAs and related mRNA | Utility |
|---|---|---|---|---|---|---|---|
| Tahira et al. | Brasil | 2011 | Sptted custom-cDNA microarray | 9 non-pancreatic tissue, 15 primary pancreatic adenocarcinoma, 6 metastases from primary panceatic tumors and 8 chronic pancreatitis | 1267 protein-coding mRNAs and 340 putative noncoding RNAs | PPP3CB, MAP3K14 and DAPK1 | Correlate in PDAC or metastasis |
| Li et al. | China | 2014 | LncRNA expression microarray | 3 pairs of PDAC patients | 3220 upregulated and 945 downregulated lncRNAs | lncRNA BC008363 | Independent prognostic factor |
| Ye et al. | China | 2014 | GSE30134 expression profiles | 18 pancreatic cancers and 9 normal pancreas | 21 lncRNAs | - | - |
| Li et al. | China | 2015 | Arraystar human lncRNA microarrays, V2 | 12 samples | 27 upregulated lncRNAs | HOTTIP | Promote cell proliferation, invasion, and chemoresistance |
| Wang et al. | China | 2015 | Agilent Array platform | PanIN cell line and PDAC cell line | 319 upregulated lncRNAs and 571 downregulated lncRNAs | 8 lncRNAs and 5 protein-coding genes | Wnt Pathway-Associated |
| Wang et al. | China | 2015 | Arraystar Human LncRNA Microarray, V3 | 12 samples | 36 upregulated and 78 downregulated lncRNAs | HOTTIP-005 and RP11-567G11.1 | prognostic and Diagnostic biomarker |
| Ye et al. | China | 2015 | Arraystar Human LncRNA Microarray, V3 | 12 samples | 3534 upregulated lncRNAs and 4751 downregulated lncRNAs | AFAP1-AS1 | Poor survival and short-term recurrence |
| fu et al. | China | 2016 | Affymetrix GeneChip Human Genome HG-U133 Plus 2.0 array | 84 samples | 20 upregulated and 15 downregulated lncRNAs | AFAP1-AS1, UCA1 and ENSG00000218510 | Diagnostic biomarker |
| hu et al. | China | 2016 | LncRNA Human Gene Expression Microarray V4.0 | PANC-1 cells treated with or without fenofibrate | 549 upregulated lncRNAs and 852 down regulated lncRNAs | LncRNA MEG3 | Promote pancreatic cancer cells proliferation |
| Li et al. | China | 2016 | Agilent Gene Expression Analysis | 6 samples | - | lncRNA-NUTF2P3-001 | Derepress the miR-3923/KRAS pathway |
Further GO and pathway analyses were utilized to study the biological functions of lncRNAs and relative mRNAs. The result of GO analysis showed that the up-regulated gene profile was closely correlated with the protein function such as protein localization, proteasome accessory complex and macromolecule localization. The down-regulated gene profile includes Golgi to plasma membrane transport, release of cytochrome C from mitochondria, plasma membrane and receptor periphery. This result supports the notion that although lncRNAs do not code protein sequence, they can regulate protein metabolism and functions to affect the biological process. Meanwhile, pathway analysis showed that the main up-regulated gene profile was associated with carcinogenesis such as phagosome, focal adhesion, pathways in cancer, transforming growth factor-beta (TGF-beta) signaling pathway and cell cycle. The result is consistent with previous studies in human PDAC tissues, reporting that the up-regulated genes in PDAC were associated with pathways in cancer [27]. Another study reported that TGF-beta receptor 1 and epidermal growth factor (EGF) played important roles in the pathogenesis of pancreatic cancer [28]. Surprisingly, pathway analysis showed that the main down-regulated gene profile was correlated with nutrition metabolism including mineral absorption, arachidonic acid metabolism, PPAR signaling pathway, endocrine and other factor-regulated calcium reabsorptions. This result suggests that metabolism is somehow changed during the procession of tumorigenesis in PDAC, supporting the notion that interplay between evolving PDAC and whole body metabolism contributes to disease pathogenesis [29].
To validate the expression of selected lncRNAs in PDAC, we conducted a qRT-PCR and the result showed that CTD-2244C20.1, RP11-263F15.1 and LOC541471 were significantly over-expressed in PDAC tissues compared with adjacent non-cancerous tissues, while STK16, AF293366, BC031940 and BC047917 were not differentially expressed between them. Among these lncRNAs, the expression level of RP11-263F15.1 was the most striking change between PDAC tissue and non-cancerous tissue, so RP11-263F15.1 was chosen to the further study. In the present study, we recruited a large cohort of 66 patients with PDAC to validate the expression of RP11-263F15.1. It was found that RP11-263F15.1 was significantly elevated in PDAC tissues to a greater extent than in adjacent tissues. Besides, a high expression level of RP11-263F15.1 was associated with poor histologic differentiation. The area under the ROC curve was 0.843 (P<0.001), suggesting that RP11-263F15.1 may play an important role in PDAC progression and could be a potential diagnostic biomarker for PDAC. In addition, our study showed that high expression of RP11-263F15.1 was associated with a shorter OS in PDAC patients, although it is not an independent indictor for predicting the prognosis of PDAC. Compared to mRNA, lncRNA has tissue-specific expression pattern which may provide new biomarker for clinical utility to distinguish the patient from heath individual. The expression level of RP11-263F15.1 increased in PDAC compared to non-cancerous tissue and high expression level of RP11-263F15.1 was associated with a shorter OS in PDAC patient, suggesting that RP11-263F15.1 may be an important factor in the progression of PDAC.
Previously, Ye et al. [30] predicted the regulation mechanism of pancreatic cancer by bioinformatics and found that 21 lncRNAs related to lncRNA-miRNA-mRNA pathway were differentially expressed in pancreatic cancer, suggesting that lncRNA dysfunction is a critical step in the progression in PDAC. Similar to our study, Müller and colleagues [31] found that 43 lncRNAs were differentially expressed in six pancreatic cancer tissues and five control tissues by next-generation sequencing. Wang et al. [32] found that lncRNA HOTTIP-005, XLOC_006390 and RP-567G11.1 were increased as shown by microarray, and they may prove to be diagnostic biomarkers for pancreatic cancer. Several other lncRNAs (lncRNA-ATB, LOC389641 and PVT1) have been proved to have diagnostic and prognostic values in PDAC [33-35]. All these studies and ours suggest that lncRNAs have potential diagnostic and prognostic values in PDAC. However, few lncRNAs have been functionally characterized, although thousands of lncRNAs are aberrantly expressed as shown by sequencing or microarray methods. Further study is needed to investigate the mechanism underlying the carcinogenesis of PDAC.
In summary, our study demonstrated that 4364 lncRNAs and 4862 related mRNAs were significantly dysregulated in PDAC tissues versus adjacent non-cancerous tissues. GO and pathway analyses showed that up-regulated lncRNAs that related to several pathways, especially TGF-beta signaling pathway, were associated with carcinogenesis, and phagosome and cell cycle were closely correlated with PDAC progression. Interestingly, almost all down-regulated lncRNAs were associated with metabolism, such as mineral absorption, arachidonic acid metabolism, PPAR signaling pathway, endocrine and other factor-regulated calcium reabsorption. In addition, we found that RP11-263F15.1 was significantly over-expressed in PDAC tissues, and that RP11-263F15.1 was associated with histologic differentiation. KM analysis showed that a higher expression of RP11-263F15.1 was associated with a shorter OS. However, RP11-263F15.1 was not an independent indictor of prognosis for patients with PDAC. Cumulatively, these findings indicate that RP11-263F15.1 plays an important role in the initiation and progression of PDAC and may prove to be a potential diagnostic or prognostic biomarker for PDAC.
Acknowledgements
This work was supported by the National Science Foundation of China (project NO.81172077), and Shanghai Municipal Commission of Health and Family Planning, Key Developing Disciplines (No.2015ZB0202). We thank Huile Zhong (Guangdong University of Foreign Studies, Guangzhou, China) for polishing and editing the manuscript and Jie Kong (Institute of Health Sciences, Shanghai Institutes for Biological Sciences, Chinese Academy of Sciences, Shanghai, China) for bioinformatics consultation.
Competing Interests
The authors have declared that no competing interest exists.
References
1. Kurahara H, Bohl C, Natsugoe S, Nishizono Y, Harihar S, Sharma R. et al. Suppression of pancreatic cancer growth and metastasis by HMP19 identified through genome-wide shRNA screen. International journal of cancer. 2016
2. Yeo CJ, Cameron JL, Lillemoe KD, Sitzmann JV, Hruban RH, Goodman SN. et al. Pancreaticoduodenectomy for cancer of the head of the pancreas. 201 patients. Annals of surgery. 1995;221:721-31 discussion 31-3
3. Parikh DA, Durbin-Johnson B, Urayama S. Utility of serum CA19-9 levels in the diagnosis of pancreatic ductal adenocarcinoma in an endoscopic ultrasound referral population. Journal of gastrointestinal cancer. 2014;45:74-9
4. Yuan W, Tang W, Xie Y, Wang S, Chen Y, Qi J. et al. New combined microRNA and protein plasmatic biomarker panel for pancreatic cancer. Oncotarget. 2016
5. Nie L, Wu HJ, Hsu JM, Chang SS, Labaff AM, Li CW. et al. Long non-coding RNAs: versatile master regulators of gene expression and crucial players in cancer. American journal of translational research. 2012;4:127-50
6. Kung JT, Colognori D, Lee JT. Long noncoding RNAs: past, present, and future. Genetics. 2013;193:651-69
7. Okugawa Y, Grady WM, Goel A. Epigenetic Alterations in Colorectal Cancer: Emerging Biomarkers. Gastroenterology. 2015;149:1204-25 e12
8. Westermann AJ, Forstner KU, Amman F, Barquist L, Chao Y, Schulte LN. et al. Dual RNA-seq unveils noncoding RNA functions in host-pathogen interactions. Nature. 2016;529:496-501
9. Hrdlickova B, Kumar V, Kanduri K, Zhernakova DV, Tripathi S, Karjalainen J. et al. Expression profiles of long non-coding RNAs located in autoimmune disease-associated regions reveal immune cell-type specificity. Genome medicine. 2014;6:88
10. Vausort M, Wagner DR, Devaux Y. Long noncoding RNAs in patients with acute myocardial infarction. Circulation research. 2014;115:668-77
11. Tsai MC, Spitale RC, Chang HY. Long intergenic noncoding RNAs: new links in cancer progression. Cancer research. 2011;71:3-7
12. Beermann J, Piccoli MT, Viereck J, Thum T. Non-coding RNAs in Development and Disease: Background, Mechanisms, and Therapeutic Approaches. Physiological reviews. 2016;96:1297-325
13. Evans JR, Feng FY, Chinnaiyan AM. The bright side of dark matter: lncRNAs in cancer. The Journal of clinical investigation. 2016;126:2775-82
14. Zhou X, Yin C, Dang Y, Ye F, Zhang G. Identification of the long non-coding RNA H19 in plasma as a novel biomarker for diagnosis of gastric cancer. Scientific reports. 2015;5:11516
15. Li T, Xie J, Shen C, Cheng D, Shi Y, Wu Z. et al. Amplification of Long Noncoding RNA ZFAS1 Promotes Metastasis in Hepatocellular Carcinoma. Cancer research. 2015;75:3181-91
16. Ye Y, Chen J, Zhou Y, Fu Z, Zhou Q, Wang Y. et al. High expression of AFAP1-AS1 is associated with poor survival and short-term recurrence in pancreatic ductal adenocarcinoma. Journal of translational medicine. 2015;13:137
17. Sun YW, Chen YF, Li J, Huo YM, Liu DJ, Hua R. et al. A novel long non-coding RNA ENST00000480739 suppresses tumour cell invasion by regulating OS-9 and HIF-1alpha in pancreatic ductal adenocarcinoma. British journal of cancer. 2014;111:2131-41
18. Li J, Liu D, Hua R, Zhang J, Liu W, Huo Y. et al. Long non-coding RNAs expressed in pancreatic ductal adenocarcinoma and lncRNA BC008363 an independent prognostic factor in PDAC. Pancreatology: official journal of the International Association of Pancreatology (IAP) [et al]. 2014;14:385-90
19. Hezel AF, Kimmelman AC, Stanger BZ, Bardeesy N, Depinho RA. Genetics and biology of pancreatic ductal adenocarcinoma. Genes & development. 2006;20:1218-49
20. Doppler H, Panayiotou R, Reid EM, Maimo W, Bastea L, Storz P. The PRKD1 promoter is a target of the KRas-NF-kappaB pathway in pancreatic cancer. Scientific reports. 2016;6:33758
21. Bryant KL, Mancias JD, Kimmelman AC, Der CJ. KRAS: feeding pancreatic cancer proliferation. Trends in biochemical sciences. 2014;39:91-100
22. Kamisawa T, Wood LD, Itoi T, Takaori K. Pancreatic cancer. Lancet (London, England). 2016;388:73-85
23. Makohon-Moore A, Iacobuzio-Donahue CA. Pancreatic cancer biology and genetics from an evolutionary perspective. Nature reviews Cancer. 2016;16:553-65
24. Huang X, Zhi X, Gao Y, Ta N, Jiang H, Zheng J. LncRNAs in pancreatic cancer. Oncotarget. 2016
25. Fu XL, Liu DJ, Yan TT, Yang JY, Yang MW, Li J. et al. Analysis of long non-coding RNA expression profiles in pancreatic ductal adenocarcinoma. Scientific reports. 2016;6:33535
26. Zhou Y, Gong B, Jiang ZL, Zhong S, Liu XC, Dong K. et al. Microarray expression profile analysis of long non-coding RNAs in pancreatic ductal adenocarcinoma. International journal of oncology. 2016;48:670-80
27. Jandaghi P, Najafabadi HS, Bauer AS, Papadakis AI, Fassan M, Hall A. et al. Expression of DRD2 is Increased in Human Pancreatic Ductal Adenocarcinoma and Inhibitors Slow Tumor Growth in Mice. Gastroenterology. 2016
28. Long J, Liu Z, Wu X, Xu Y, Ge C. Gene expression profile analysis of pancreatic cancer based on microarray data. Molecular medicine reports. 2016;13:3913-9
29. Perera RM, Bardeesy N. Pancreatic Cancer Metabolism: Breaking It Down to Build It Back Up. Cancer discovery. 2015;5:1247-61
30. Ye S, Yang L, Zhao X, Song W, Wang W, Zheng S. Bioinformatics method to predict two regulation mechanism: TF-miRNA-mRNA and lncRNA-miRNA-mRNA in pancreatic cancer. Cell biochemistry and biophysics. 2014;70:1849-58
31. Muller S, Raulefs S, Bruns P, Afonso-Grunz F, Plotner A, Thermann R. et al. Next-generation sequencing reveals novel differentially regulated mRNAs, lncRNAs, miRNAs, sdRNAs and a piRNA in pancreatic cancer. Molecular cancer. 2015;14:94
32. Wang Y, Li Z, Zheng S, Zhou Y, Zhao L, Ye H. et al. Expression profile of long non-coding RNAs in pancreatic cancer and their clinical significance as biomarkers. Oncotarget. 2015;6:35684-98
33. Qu S, Yang X, Song W, Sun W, Li X, Wang J. et al. Downregulation of lncRNA-ATB correlates with clinical progression and unfavorable prognosis in pancreatic cancer. Tumour biology: the journal of the International Society for Oncodevelopmental Biology and Medicine. 2016;37:3933-8
34. Zheng S, Chen H, Wang Y, Gao W, Fu Z, Zhou Q. et al. Long non-coding RNA LOC389641 promotes progression of pancreatic ductal adenocarcinoma and increases cell invasion by regulating E-cadherin in a TNFRSF10A-related manner. Cancer letters. 2016;371:354-65
35. Huang C, Yu W, Wang Q, Cui H, Wang Y, Zhang L. et al. Increased expression of the lncRNA PVT1 is associated with poor prognosis in pancreatic cancer patients. Minerva medica. 2015;106:143-9
Author contact
![]() Corresponding authors: Jianming Zheng, Department of Pathology, Changhai Hospital, Second Military Medical University, #168 Changhai Road, Shanghai 200433, China Tel/Fax: (+86-021) 81873689 E-mail: jmzheng1962edu.cn Hui Jiang, Department of Pathology, Changhai Hospital, Second Military Medical University, #168 Changhai Road, Shanghai 200433, China Tel /Fax: (+86-021) 81873689 E-mail: Jianghui5131com
Corresponding authors: Jianming Zheng, Department of Pathology, Changhai Hospital, Second Military Medical University, #168 Changhai Road, Shanghai 200433, China Tel/Fax: (+86-021) 81873689 E-mail: jmzheng1962edu.cn Hui Jiang, Department of Pathology, Changhai Hospital, Second Military Medical University, #168 Changhai Road, Shanghai 200433, China Tel /Fax: (+86-021) 81873689 E-mail: Jianghui5131com

 Global reach, higher impact