Impact Factor ISSN: 1837-9664

 Global reach, higher impact
J Cancer 2017; 8(14):2816-2827. doi:10.7150/jca.18482 This issue Cite
Research Paper
Twisted Gastrulation BMP Signaling Modulator 1 Regulates Papillary Thyroid Cancer Cell Motility and Proliferation
Shujun Xia1*, Ri Ji1*, Yongmin Xu2, Xiaofeng Ni1, Yijie Dong1, Weiwei Zhan1 ![]()
1. Ultrasound Department, Rui Jin Hospital Shanghai Jiao Tong University School of Medicine, 197 Rui Jin Er Road, Huang Pu District, Shanghai, 200025, P. R. of China;
2. Department of Spine Surgery, Yijishan Hospital, the First Affiliated Hospital of Wannan Medical College, Wuhu, Anhui, 241001, P. R. of China.
* These authors contributed equally to the manuscript
Received 2016-12-24; Accepted 2017-5-18; Published 2017-8-23
Abstract
Bone morphogenetic proteins (BMPs) are growth factors that have important functions in cell proliferation, migration and differentiation. To date, BMP pathway activation has been found in multiple human tumors and is associated with enhanced malignant tumor growth and metastasis. BMP activity is tightly regulated by a family of soluble extracellular secreted BMP modulators. Twisted gastrulation BMP signaling modulator 1 (TWSG1) is a direct BMP regulator that is required for the full signaling activity of BMPs. However, the functions and mechanisms of TWSG1 in papillary thyroid cancer (PTC) metastasis have not been reported. TWSG1 expression was detected in 44 PTC tissues with lymph node metastasis (LNM) and 56 PTC tissues without LNM using quantitative real-time polymerase chain reaction (qRT-PCR). Gain- and loss-of-function approaches were used to assess the biological function of TWSG1 in PTC cells. Matrigel assays demonstrated the effect of tumor cell-derived TWSG1 on endothelial cell function. Our results showed that TWSG1 expression was significantly enhanced in PTC with LNM compared to that in PTC without LNM. TWSG1 knockdown inhibited migration, invasion and proliferation of PTC cells. Additionally, TWSG1 suppression impaired the tumor cell-induced endothelial cell sprout formation. We found that TWSG1 signaling may be transduced by the BMP target transcription factor inhibitor of DNA binding 1 (Id1) and matrix metalloproteinases (MMPs) 2 and 9. In conclusion, TWSG1 was highly expressed in metastasized PTC; tumor growth, migration and invasion were dependent on TWSG1, and it may be a new diagnostic and therapeutic target for PTC.
Keywords: TWSG1, papillary thyroid cancer, migration, invasion, biomarker.
Introduction
The incidence of thyroid cancer has increased in the past decades, and papillary thyroid cancer (PTC) accounts for the largest proportion of these cases [1]. PTC is the most common histotype of thyroid cancer and is the fifth leading malignancy found in women [2, 3]. The prevalence of lymph node metastasis (LNM) is high in PTC and has a 30-90% rate with both clinically evident and occult lymph node involvement [4]. Nodal relapse is a major problem in PTC [5]. Effective assessment of LNM in PTC before surgery would directly contribute to appropriate surgical dissection of cervical lymph nodes, which reduces the rate of relapse [6, 7] and increases the quality of life. Thus, the identification of biomarkers correlated with tumorigenesis and progression would be useful for preoperative assessment of LNM in PTC.
The transforming growth factor-beta (TGF-β) family has been intensively investigated and has been shown to promote malignant cell behavior [8]. Bone morphogenetic proteins (BMPs), one of the TGF-β subfamilies, are dysregulated in a variety of tumor types, including lung adenocarcinoma [9], breast cancer [10], colon cancer [11], musculoskeletal cancer [12], and glioma [13]. Generally, BMPs can either suppress or promote tumorigenesis and metastasis [14]. Hu et al. [15] reported that BMP-6 inhibited the migration and invasion of MDA-MB-231 breast cancer cells by regulating MMP secretion in the tumor microenvironment, while in another study, BMP-4 was overexpressed in colonic adenocarcinomas and promoted migration and invasion of HCT116 cells [16].
Twisted gastrulation (TWSG1) is a BMP modulator that synergistically interacts with chordin or chordin-like molecules to regulate BMP activity [17, 18], which is controlled at many levels. Whether TWSG1 acts as an agonist or antagonist is still unknown. Moreover, there are limited reports of the role of TWSG1 in cancer. Our study was carried out to characterize the expression and function of TWSG1 in PTC and analyze the value of TWSG1 as a clinical biomarker for PTC LNM. The present study also helps elucidate the mechanisms of PTC metastasis.
Materials and Methods
Sample collection
A total of 100 PTC patients who underwent near total or total thyroidectomy with prophylactic or radical lymph node dissection in Rui Jin Hospital from Sept. 10th, 2015 - Feb. 10th, 2016 were included in this study. Fresh tissues were instantly frozen in liquid nitrogen and incubated at -80°C. The cases were all pathologically confirmed as PTC with or without cervical LNM and those with extrathyroid extension were excluded. The study was approved by the research ethics committee of Rui Jin Hospital Shanghai Jiao Tong University School of Medicine. Informed consent was acquired from all patients.
Cell culture
K1 and TPC1 cell lines were selected for the study. K1 was used for the loss-of-function experiments, and TPC1 was used for the gain-of-function experiments. K1 is a well-differentiated PTC cell line with metastasis, while TPC1 is a PTC cell line without metastasis [19]. The two PTC cell lines were acquired from the Key Laboratory for Endocrine and Metabolic Diseases of the Chinese Health Ministry (Shanghai, China). K1 was cultured in DMEM (Gibco, Carlsbad, CA, USA), MCDB (Sigma, Saint Louis, Missouri, USA), and F12 (Gibco) (2:1:1) supplemented with 10% FBS (Gibco), 100 U/ml penicillin, and 100 μg/ml streptomycin. TPC1 was cultured in RPMI 1640 medium with HEPES (Gibco) supplemented with 10% FBS (Gibco, Carlsbad, CA, USA), 100 U/ml penicillin, and 100 μg/ml streptomycin. Cell lines were incubated at 37°C in a 5% CO2 humidified atmosphere.
RNA extraction and qRT-PCR (quantitative reverse transcriptase-polymerase chain reaction)
Total RNA was extracted from the tumor tissues and cell lines using TRIzol reagent (Invitrogen, Carlsbad, CA, USA) according to the manufacturer's protocol. One microgram of total RNA was reverse transcribed into first-strand cDNA according to the protocol of the Reverse Transcription Kit (TaKaRa, Dalian, China). PCR was carried out using a SYBR® Premix Ex TaqTM II Kit (TaKaRa, Dalian, China) according to the instructions of the VIIA7 system (Applied Biosystems, California, USA). All amplifications were normalized to GAPDH. Data were analyzed using the comparative Ct (2-△△Ct) method and expressed as fold change compared to the negative control. Each sample was analyzed in triplicate. Gene primers are listed in Table 1.
Sequence of primers used for qRT-PCR
| Gene | Sequence (5ˈ-3ˈ) | |
|---|---|---|
| TWSG1 | Forward Primer | GCTGTGCTTACTCTAGCCATC |
| Reverse1 Primer | TGAGGCATTTGCTCACATCAC | |
| MMP1 | Forward Primer | AAAATTACACGCCAGATTTGCC |
| Reverse Primer | GGTGTGACATTACTCCAGAGTTG | |
| MMP2 | Forward Primer | CCCACTGCGGTTTTCTCGAAT |
| Reverse Primer | CAAAGGGGTATCCATCGCCAT | |
| MMP9 | Forward Primer | AGACCTGGGCAGATTCCAAAC |
| Reverse Primer | CGGCAAGTCTTCCGAGTAGT | |
| MMP13 | Forward Primer | ACTGAGAGGCTCCGAGAAATG |
| Reverse Primer | GAACCCCGCATCTTGGCTT | |
| ID1 | Forward Primer | CTGCTCTACGACATGAACGG |
| Reverse Primer | GAAGGTCCCTGATGTAGTCGAT | |
| GAPDH | Forward Primer | AAGGTGAAGGTCGGAGTCAAC |
| Reverse Primer | GGGGTCATTGATGGCAACAATA |
Immunohistochemistry
The TWSG1 expression in papillary thyroid cancers was measured by immunochemistry. Papillary thyroid cancer tissues were fixed by 4% phosphate-buffered paraformaldehyde for 24 hours. The specimens were embedded in paraffin and sectioned into 5-μm thick sections. Papillary thyroid sections were deparaffinized and incubated in 0.05% trypsin at 37℃ for 30 min, which was followed by peroxidase blocking to retrieve antigens and incubation with TWSG1 primary antibody (1:200, Abcam, ab57552) at 4℃ overnight. The sections were then incubated with HRP-secondary antibody (Fuzhou Maixin Biotech. Co., Ltd, MaxvisionTM2 HRP-Polymer anti-Mouse IHC Kit, KIT-5902) at 37 ℃ for 2 hours and detected using a DAB Kit (Fuzhou Maixin Biotech. Co. Ltd, DAB Kit, DAB-0031). Then, the slides were mounted with neutral resin and coverslipped. After staining, the sections were observed under light microscopy (Zeiss, Axio Imager A2). TWSG1 expression was semiquantitatively evaluated in representative tumor area. The staining intensity was defined as: negative-0, moderate-1, strong-2; the staining percentage was scored as: 0%-0, 1~25%-1,26~50%-2, 51~75%-3, 76~100%-4. The scores of intensity and percentage were multiplied to get a final score of 0 to 8. The total expression of TWSG1 was determined as: negative, low expression (score<4), high expression (score≥4).
Immunofluorescence
Cells were cultured in 35 mm cell culture dishes (NEST Biotech, Wuxi, China) for 12h, then fixed with 4% PFA in PBS for 20 min at room temperature. After washing in PBS, cells were permeabilized with 0.5% Triton X-100 for 5 min and blocked with 5% BSA for 60 min. Incubation with primary anti-TWSG1 antibodies (1:200, Abcam, Cambridge, MA, USA) was performed overnight at 4°C. The primary antibodies were detected using PE-conjugated anti-mouse IgG secondary antibodies. After the final wash, the nuclei were counterstained by adding a 2 mg/mL solution of 4ˈ, 6-diamidino-2-phenylindole (DAPI; Sigma-Aldrich, St. Louis, MO, USA) in PBS for 10 min before imaging. Cells were visualized using a confocal microscope (Leica, Solms, Germany).
RNA interference
TWSG1-specific siRNA1 and siRNA2 and a scramble negative control siRNA (ScrsiRNA) were purchased from GenePharma Co., Ltd. (Shanghai, China). The sequences were as follows: TWSG1-siRNA1, sense, 5ˈ-CAUGUGUACUGUGGUUUAUTT-3ˈ, antisense, 5ˈ-AUAAACCACAGUACACAUGTT-3ˈ; TWSG1-siRNA2, sense, 5ˈ-GUGCAUUGGUCCAGAAUGUTT-3ˈ, antisense, 5ˈ-ACAUUCUGGACCAAUGCACTT-3ˈ; ScrsiRNA, sense, 5ˈ-UUCUCCGAACGUGUCACGUTT-3ˈ, antisense, 5ˈ-ACGUGACACGUUCGGAGAATT-3ˈ. For knockdown experiments, K1 cells were transfected with 100 nM TWSG1-specific siRNA or scrsiRNA using LipofectamineTM 2000 (Thermo Fisher Scientific, Waltham, MA, USA) according to the manufacturer's instruction. The mRNA and protein levels of TWSG1 were detected by qRT-PCR and western blot analysis, respectively.
Lentiviral transduction overexpression studies
The TWSG1 gene was ligated into pLVX-IRES-puro to generate the TWSG1 overexpression plasmid. The pLVX-IRES-puro and pRUF-IRES-puro-TWSG1 constructs were transfected into the HEK293T viral packaging cell line together with the psPAX2 and pMD2.G plasmids. Forty-eight hours after transfection, the viral supernatant was collected and used for the infection of cells.
Western blot analysis
Protein lysate was acquired from collected cells with RIPA buffer, and the supernatant was collected after a 30 min reaction on ice and a 15 min centrifugation at 13,000 rpm 48h after transfection. The protein concentration was determined using a BCA Protein Assay Kit (Pierce, Illinois, USA). Ten micrograms of protein from each condition was subjected to 8% SDS-PAGE and subsequently transferred to a polyvinylidene difluoride membrane, which was then blocked with 5% BSA in TBST (TBS containing 0.1% Tween-20) at room temperature for one hour. Incubation was conducted with primary antibodies at 4°C overnight followed by secondary antibodies at room temperature for one hour. The membranes were washed 3 times with washing buffer (PBS containing 0.1% Tween) for 10 min after each incubation. Images were then captured using a LI-COR Odyssey Scanner. Primary antibodies recognizing human TWSG1, MMP2, MMP9, ID1 mouse mAb (1:1000, Abcam, Cambridge, MA, USA) and GAPDH rabbit mAb (1:2000, Cell Signaling Technology, Danvers, MA, USA) as well as Smad1/5, p-Smad1/5 and goat pAb (1:500, Santa Cruz, Dallas, Texas, USA) antibodies were used.
CCK-8 assay
K1 and TPC1 cells were seeded into 96-well plates at a density of 1X10⁴ cells/well 48h after transfection. Cell viability was evaluated using a cell counting kit-8 (CCK-8; Dojindo Molecular Technologies, Japan) at 12 h, 24 h, 36 h, 48 h and 72 h. The absorbance was determined by a TECAN infinite M200 plate reader at 450 nm.
Colony formation assay
K1 and TPC1 cells were seeded in 6-well plates at a density of 500 cells/well 48h after transfection and then cultured at 37°C in a 5% CO2 humidified atmosphere. The medium was changed every the other day. After 7 days of culture, the medium was removed, and the cells were washed twice with PBS. Then, cells were fixed in methanol for 20 min, stained with 1% crystal violet for 30 min at room temperature, washed again and photographed.
Flow cytometry assay
K1 and TPC1 cells were collected for cell cycle analysis 48h after transfection. Cells were fixed in 75% ethanol at 4°C overnight and then stained using a Cell Cycle Analysis Kit (Beyotime Biotechnology, Jiangsu, China) according to the manufacturer's instructions. The cell cycle was analyzed by Gallios Flow Cytometry (Beckman Coulter, Brea, CA, USA). All experiments were performed independently in triplicate.
Scratch assay
Cells were plated in each well of 6-well plates and incubated until they reached 100% confluence. Then, a scratch was made with pipette tips. Fresh serum-free medium was added. The wound healing procedure was observed for 24 h, and images were taken.
Transwell assay
Transwell chambers with 8 μm pores (Costar, Corning, NY, USA) were used to perform migration and invasion assays. Matrigel (BD Biosciences, New Jersey, USA) was coated on the top of the insert membrane in the invasion assay. The upper chamber was filled with 200 μl serum-free medium, and 1×10⁴ cells were seeded, while 600 μl medium with 5% FBS was added to the lower chamber. The chambers were maintained at 37°C in 5% CO2 for 24h. Then, the nonmigrated or noninvaded cells on the top side of the insert membrane were removed by cotton swabs. The inserts were then fixed in methanol for 20 min and stained with 1% crystal violet for 30 min. The migrated or invaded cells on the bottom of the membrane were assessed using a microscope and photographed. All experiments were performed in triplicate.
Matrigel sprouting assay
The culture plates were coated with Matrigel (BD Biosciences) according to the manufacturer's instruction. Human umbilical vein endothelial cells (HUVECs) were pretreated within 1% FBS/DMEM for 16 to 18h. A total of 3×10⁴ cells were cultured on Matrigel for 4h at 37°C with different cell culture supernatants and recombinant TWSG1 (rTWSG1) (abcam, Cambridge, MA, USA) respectively. Pictures were taken from 5 random microscopic fields. The cumulative sprout length and the number of branch points were quantified.
Statistical analysis and quantification
The statistical analysis was performed using Statistical Program for Social Sciences 19.0 software (SPSS, Chicago, IL, USA) and GraphPad Prism 5.0 (GraphPad Software, La Jolla, CA, USA). Data were presented as the mean ± S.D., and comparisons were performed using Student's t-test (two-sided, unpaired). All experiments were repeated at least three times. Correlation analysis was performed by Pearson's chi-square (X2) test. The diagnostic value of TWSG1 was evaluated by receiver-operating characteristic (ROC) analysis and area under the curve (AUC) value. P<0.05 was considered statistically significant.
Result
Patient clinicopathological characteristics
As shown in Table 2, a total of 100 patients were included in our study. They were classified into two groups (LNM group, n=44; non-LNM group, n=56) based on whether the patient had lymph node metastasis. The distributions of sex, age and multifocality in the two groups were comparable (P>0.05). Based on the AJCC (American Joint Committee on Cancer) TNM (tumor-node-metastasis) staging system (7th edition), the tumors were all classified as pT1, and there were no patients with distant metastasis. In the LNM group, 63.6% of the patients were classified as N1a and 36.4% were N1b. Patients with LNM were more likely to be classified in the advanced stage (III/IV) groups (54.5%), while those without LNM were belonged to the early stage (I/II) group (P<0.000).
Patient clinicopathological characteristics
| Clinicopathological characteristics | LNM (n=44) | Non-LNM (n=56) | P value |
|---|---|---|---|
| Sex | 0.650 | ||
| Male | 12 (27.3%) | 13 (23.2%) | |
| Female | 32 (72.7%) | 43 (76.8%) | |
| Age (mean±SD) | 45.90±11.52 | 47.24±12.16 | 0.688 |
| <45y | 20 (45.5%) | 23 (41.1%) | |
| ≥45y | 24 (54.5%) | 33 (58.9%) | |
| Multifocality | 0.179 | ||
| Unifocal | 29 (65.9%) | 44 (78.6%) | |
| Multifocal | 15 (34.1%) | 12 (21.4%) | |
| Tumor (T) | 0.000 | ||
| T1a | 20 (45.5%) | 47 (83.9%) | |
| T1b | 24 (54.5%) | 9 (16.1%) | |
| Lymph node (N) | / | ||
| N0 | 0 (0.0%) | 56 (100.0%) | |
| N1a | 28 (63.6%) | 0 (0.0%) | |
| N1b | 16 (36.4%) | 0 (0.0%) | |
| Metastasis (M) | |||
| M0 | 44 (100%) | 56 (100%) | 1.000 |
| pTNM stage | |||
| Early (I/II) | 20 (45.5%) | 56 (100.0%) | 0.000 |
| Advanced (III/IV) | 24 (54.5%) | 0 (0.0%) |
TWSG1 is highly expressed in metastasized PTC
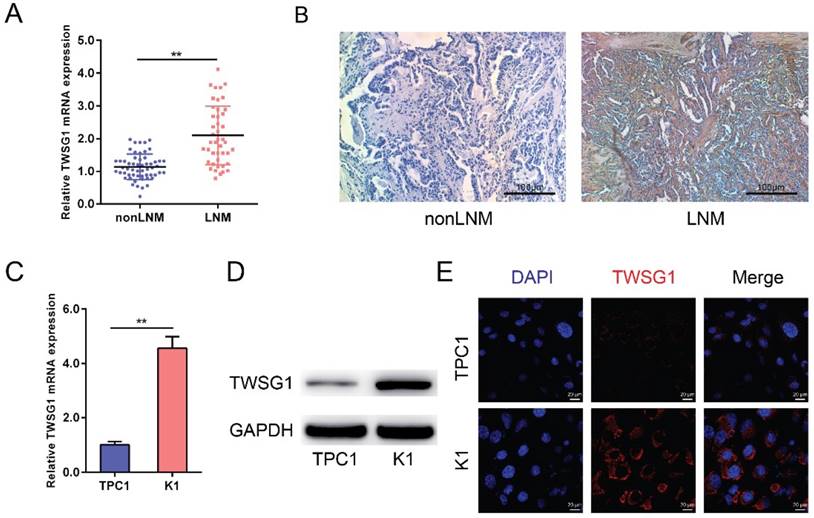
TWSG1 levels were analyzed in both tumor tissues and PTC cell lines (TPC1 and K1). The qRT-PCR analysis showed that TWSG1 was significantly overexpressed in PTC with LNM as well as in the K1 cell line that shows metastatic properties (Fig. 1A, C). Immunohistochemistry showed that the staining was low in nonLNM of PTC, while it was high in LNM of PTC, indicating that TWSG1 protein expression was higher in metastasized PTC (Fig. 1B). Western blot analysis also indicated that the protein level of TWSG1 was higher in K1, which was a well-differentiated PTC cell line with metastasis (Fig. 1D). Furthermore, the expression of TWSG1 was confirmed in PTC cell lines by immunofluorescence analysis, which showed that the fluorescence signal in K1 cells was much higher than that in TPC1 cells (Fig. 1E). These results indicate that TWSG1 was involved in LNM of PTC and invasion of PTC cells.
TWSG1 is highly expressed in metastasized papillary thyroid cancer. qRT-PCR analysis of the expression levels of TWSG1 in PTC tissues (non-lymph node metastasis (non-LNM), n=56; lymph node metastasis (LNM), n=44) (A) and PTC cell lines (TPC1 and K1) (C). The values were normalized to GAPDH mRNA expression. Data were expressed as the mean ± S.D. of three independent experiments. ** indicates P<0.01. (B) Representative images of immunohistochemistry analysis of TWSG1 in non-metastasized and metastasized PTCs. The scale bar is 100 μm. (D) Western blot analyses of TWSG1 in TPC1 and K1 cells. GAPDH was used as a loading control. Representative images of three repeated experiments were shown. (E) Representative images of immunofluorescence analyses of TWSG1 in TPC1 and K1 cells. The scale bar is 20 μm.
TWSG1 overexpression is associated with LNM of PTC
TWSG1 was confirmed to be overexpressed in metastatic PTC. We further analyzed the correlation of TWSG1 expression and clinicopathological characteristics of all patients. The relative expression of TWSG1 was constructed on a ROC curve. The cutoff value (△Ct=3.60) of TWSG1 expression was calculated by ROC curve analysis. At the cutoff point of 3.60, the AUC meets the maximum indicating the best diagnostic accuracy of TWSG1 differentiating LNM of PTC. According to the cut off expression level of TWSG1 in all PTC samples, patients were categorized into the low-expression group (n=49, △Ct>3.60) and the high-expression group (n=51, △Ct<3.60). As shown in Table 3, TWSG1 overexpression was associated with LNM (N0 vs. N1a/N1b, P<0.000) and pTNM stage (I/II vs. III/IV, P<0.000). However, there were no significant associations between TWSG1 expression and sex (P=0.546), age (P=0.569), multifocality (P=0.549) and tumor size (P=0.091).
Correlations between TWSG1 expression and clinicopathological characteristics in PTC
| Clinicopathological characteristics | n | High expression | Low expression | P value |
|---|---|---|---|---|
| Sex | 0.546 | |||
| Male | 25 | 13 (25.5%) | 12 (24.5%) | |
| Female | 75 | 38 (74.5%) | 37 (75.5%) | |
| Age | ||||
| <45y | 43 | 22 (43.1%) | 21 (42.9%) | 0.569 |
| ≥45y | 57 | 29 (56.9%) | 28 (57.1%) | |
| Multifocality | 0.549 | |||
| Unifocal | 73 | 37 (72.5%) | 36 (73.5%) | |
| Multifocal | 27 | 14 (27.5%) | 13 (26.5%) | |
| Tumor (T) | 0.091 | |||
| T1a | 67 | 30 (58.8%) | 37 (75.5%) | |
| T1b | 33 | 21 (41.2%) | 12 (24.5%) | |
| Lymph node (N) | 0.000 | |||
| N0 | 56 | 15 (29.4%) | 41 (83.7%) | |
| N1a/N1b | 44 | 36 (70.6%) | 8 (16.3%) | |
| Metastasis (M) | / | |||
| M0 | 100 (100%) | / | / | |
| pTNM stage | 0.000 | |||
| Early (I/II) | 76 | 31 (60.8%) | 45 (91.8%) | |
| Advanced (III/IV) | 24 | 20 (39.2%) | 4 (8.2%) |
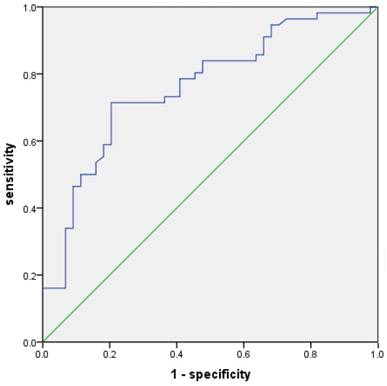
The value of TWSG1 in identifying LNM of PTC
The value of TWSG1 in identifying PTC patients with LNM was analyzed. The relative mRNA expression of TWSG1 was assessed using a ROC curve. The AUC for TWSG1 was 0.762 (95% confidence interval (CI) = 0.668-0.857; P < 0.01, Fig. 2). Overexpression of TWSG1 showed a sensitivity of 84.1% and a specificity of 73.2% with a diagnostic accuracy of 78.0% (Table 4).
Potential diagnostic value of TWSG1. The ROC curve of TWSG1 identifies the presence of LNM in PTC in terms of sensitivity and specificity. AUC: 0.762 (0.668-0.857), P<0.01.
Performance of TWSG1 in identifying LNM of PTC
| Sensitivity | Specificity | NPV | PPV | Accuracy | |
|---|---|---|---|---|---|
| TWSG1 | 84.1% | 73.2% | 85.4% | 71.2% | 78.0% |
NPV=negative predictive value; PPV=positive predictive value
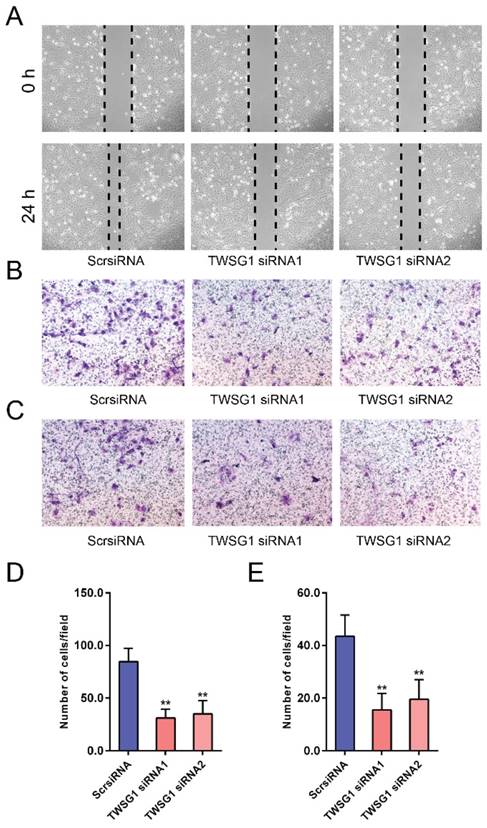
TWSG1 knockdown suppresses the migration and invasion of PTC cells
We next investigated the functional role of TWSG1 in the migration and invasion of PTC cells. We knocked down TWSG1 in K1 cells with two different TWSG1-specific siRNAs, both of which resulted in efficient depletion of TWSG1 in K1 cells as confirmed by qRT-PCR and western blot analyses (Fig. S1A, B). In scratch assays, the distance of the scratch wound in the TWSG1 siRNA group was significantly larger than that in the ScrsiRNA group (Fig. 3A). In transwell migration assays, the number of cells migrating through the chamber in the TWSG1 siRNA group was significantly less than that in the ScrsiRNA group (Fig. 3B, D). Similar results were also found in the matrigel invasion assay (Fig. 3C, E). Conversely, we overexpressed TWSG1 in TPC1 cells (Fig. S1C, D) and found that TWSG1 promoted migration of TPC1 cells, which was confirmed by scratch (Fig. S2A) and transwell (Fig. S2B, D) assays. Meanwhile, the stimulatory effect of TWSG1 on TPC1 cell invasion was confirmed by transwell assays (Fig. S2C, E). These results indicated that downregulation of TWSG1 suppresses migration and invasion of PTC cells.
TWSG1 knockdown suppresses the migration and invasion of K1 cells. (A) Wound healing assays were used to assess the migratory ability of K1 cells with knockdown of TWSG1. Representative images at 0 h and 24 h of three repeated experiments are shown. (B) Transwell assays were performed to determine the migratory ability of K1 cells with knockdown of TWSG1. Representative images of migrated cells in the lower chamber stained with crystal violet. (C) Transwell assays were performed to determine the invasive ability of K1 cells with knockdown of TWSG1. Representative images of invasive cells in the lower chamber stained with crystal violet. (D) The quantification of cell migration is presented as migrated cell numbers. All data are expressed as the mean ± S.D. of three independent experiments. ** indicates P<0.01. (E) The quantification of cell invasion is presented as invasive cell numbers. All data are expressed as the mean ± S.D. of three independent experiments. ** indicates P<0.01.
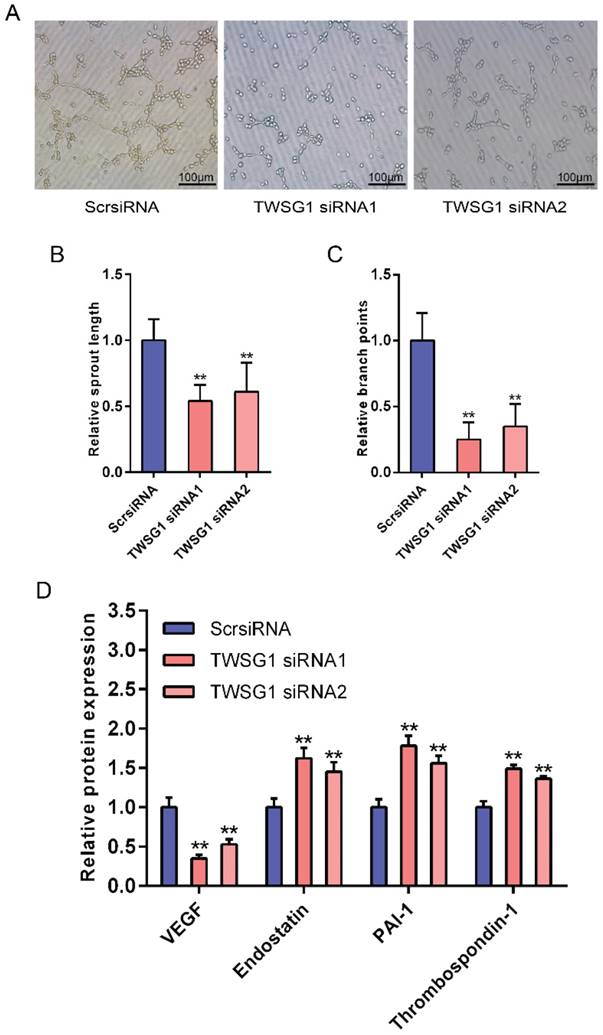
Tumor cell-derived TWSG1 regulates endothelial cell function
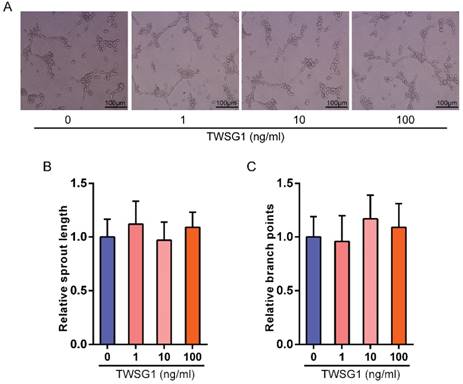
This study showed that TWSG1 regulates important tumor cell functions and subsequently investigated the effect of tumor cell-derived TWSG1 and commercial rTWSG1 on the surrounding endothelial cells. The abilities of human umbilical vein endothelial cells (HUVECs) to form sprouts and branches were analyzed. Sprouting length of HUVECs was reduced when HUVECs were incubated with conditioned media from TWSG1-knockdown tumor cells compared with the control group (Fig. 4A, B). Similarly, branch points were significantly inhibited when HUVECs were incubated with TWSG1-depleted media compared with the control (Fig. 4A, C). Furthermore, we investigated the expression of a panel of angiogenic factors in the tumor cell culture supernatant in the absence of TWSG1 and showed that vascular endothelial growth factor (VEGF) was significantly decreased, while endostatin, PAI-1 and thrombospondin-1 were increased in the absence of TWSG1 compared to the control (Fig. 4D). The angiogenic effect of TWSG1 was also confirmed by overexpressing TWSG1 in TPC1 cells. Sprouting length (Fig. S3A, B) and branch points (Fig. S3A, C) of HUVECs were significantly enhanced when the cells were incubated with the supernatant of TWSG1-overexpressing TPC1 cell culture compared with the controls. Similarly, TWSG1 overexpression increased the expression of VEGF and reduced endostatin, PAI-1 and thrombospondin-1 content in TPC1 cells (Fig. S3D). However, the sprouting length (Fig. 5A, B) and branch points (Fig. 5A, C) of HUVECs were not significantly enhanced or reduced when the cells were incubated with the supernatant of rTWSG1 (0, 1, 10, 100ng/ml). These results indicate that downregulation of TWSG1 induces endothelial cells to acquire a less angiogenic phenotype.
TWSG1 knockdown suppress the impact of K1 cells on endothelial cell function. (A) TWSG1 knockdown in K1 cells affects tube formation of the endothelial cells. HUVECs were incubated with the supernatant of K1 cells with or without TWSG1 knockdown. Thereafter, HUVECs were subjected to Matrigel assays. Representative micrographs of HUVECs stimulated with supernatants of siRNA-transfected K1 cells are shown. Scale bar= 100 μm. (B) Cumulative sprout length and (C) branch points of capillary-like structures were measured after 4 h and quantified. All data are expressed as the mean ± S.D. of three independent experiments. ** indicates P<0.01. (D) The expression levels of VEGF, endostatin, PAI-1 and thrombospondin-1 in K1 cells transfected with TWSG1-specific siRNA or ScrsiRNA supernatants measured by ELISA. All data are expressed as the mean ± S.D. of three independent experiments. ** indicates P<0.01.
The effect of rTWSG1 on endothelial cells. (A) rTWSG1 did not affect tube formation of the endothelial cells. HUVECs were incubated with 0, 1, 10, 100 ng/ml rTWSG1. Thereafter, HUVECs were subjected to Matrigel assays. Representative micrographs of HUVECs stimulated with rTWSG1 are shown. Scale bar= 100 μm. (B) Cumulative sprout length and (C) branch points of capillary-like structures were measured after 4h and quantified. All data are expressed as the mean ± S.D. of three independent experiments.
TWSG1 regulates the expression of matrix-degrading enzymes and BMP pathway activity
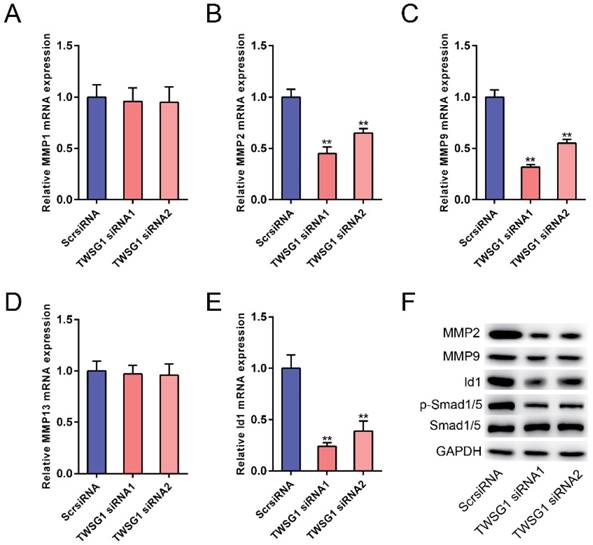
The potential mechanism underlying the TWSG1-mediated increase in PTC cell invasion and angiogenesis was further studied. We measured the expression of matrix metalloproteinases (MMPs) in TWSG1 knockdown cells. When TWSG1 was knocked down in K1 cells, the mRNA expression levels of MMP2 and MMP9 were significantly downregulated, whereas those of MMP1 and MMP13 were unchanged (Fig. 6A-D). The protein levels of MMP2 and MMP9 were also decreased in TWSG1 knockdown tumor cells compared to the controls (Fig. 6F). Thus, loss of TWSG1 results in overall reduced MMP activity. In contrast, TWSG1 overexpression promoted MMP2 and MMP9 expression in TPC1 cells, as confirmed by qRT-PCR (Fig. S4A-D) and western blot (Fig. S4F) analyses. TWSG1 is a known modulator of BMP pathway activity. In this study, we aimed to elucidate the effect of TWSG1 on BMP pathway activity in PTC. Id1 is a well-characterized indicator for BMP pathway activity. When TWSG1 was knocked down, Id1 expression was significantly reduced at both the mRNA and protein levels (Fig. 6E, F). Similarly, expression of p-Smad1/5 was inhibited in the TWSG1 siRNA group (Fig. 6F). Meanwhile, TWSG1 overexpression in TPC1 cells enhanced the expression of Id1 and p-Smad1/5 (Fig. S4E, F). These data indicate that TWSG1 promotes the expression of MMP2 and MMP9 and the activity of the BMP pathway.
TWSG1 knockdown inhibits the expression of MMPs and the BMP target gene Id1. qRT-PCR analysis of the mRNA expression levels of MMP1 (A), MMP2 (B), MMP9 (C), MMP13 (D) and Id1 (E) in K1 cells with TWSG1 knockdown. The values were normalized to GAPDH mRNA expression. Data are expressed as the mean ± S.D. of three independent experiments. ** indicates P<0.01. (F) Western blot analysis of the expressions of MMP2, MMP9, Id1 and p-Smad1/5/8 in K1 cells with TWSG1 knockdown. Representative images of three repeated experiments are shown.
TWSG1 regulates the proliferation of PTC cells
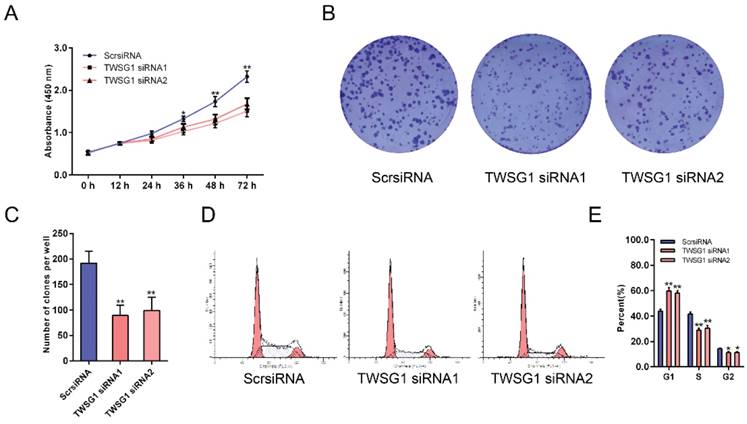
As the proliferation of tumor cells at metastatic loci plays an important role in tumor metastasis, we assessed the effect of TWSG1 on the proliferation of thyroid cancer cells. With CCK-8 assays, the proliferation of K1 cells was examined at six time points (0 h, 12 h, 24 h, 36 h, 48 h, 72 h) after transfection with TWSG1 siRNA. Cell viability was analyzed using a proliferation curve based on the absorbance at 450 nm. The proliferation of cells in the TWSG1 siRNA group was suppressed compared to the ScrsiRNA control group (Fig. 7A). In addition, colony formation assays were performed to evaluate the impact of TWSG1 on cell proliferation. The colony formation assays showed that there were fewer clones in the TWSG1 siRNA group than in the ScrsiRNA group (Fig. 7B, C). Cell cycle analysis showed that the proportion of cells in G1 phase was significantly higher in the TWSG1 siRNA group compared to that in the ScrsiRNA group, while it was lower in the S and G2/M phases in the TWSG1 siRNA group (Fig. 7D, E). Additionally, TWSG1 overexpression-mediated promotion of TPC1 cell proliferation was confirmed by CCK-8 analysis (Fig. S5A), enhanced colony formation (Fig. S5B, C) and accelerated cell cycle progression (Fig. S5D, E). These results indicate that proliferation of PTC cells is suppressed by downregulation of TWSG1.
TWSG1 knockdown inhibits the proliferation of K1 cells. (A) CCK-8 assays were performed to measure K1 cell proliferation 12 h, 24 h, 36 h, 48 h and 72 h after transfection with TWSG1-specific siRNA. (B) Colony formation assays were performed to assess the proliferation of K1 cells transfected with TWSG1-specific siRNA. The colonies were identified and counted. (C) The colony formation assay results are presented as histograms. Data were from independent experiments performed in triplicate and are presented as the mean ± S.D. (D) Flow cytometry images of the cell cycle in K1 cells. (E) Cell cycle quantification is shown as a percentage of total cells. Data are expressed as the mean ± S.D. of three independent experiments. All data are expressed as the mean ± S.D. of three independent experiments. * indicates P<0.05, ** indicates P<0.01.
Discussion
For the first time, we identified the role of TWSG1 in PTC. The expression of TWSG1 was significantly upregulated in PTC patients with LNM, and it is a potential predictive biomarker of LNM before surgery. In the loss-of-function study, knockdown of TWSG1 inhibited proliferation, cell cycle progression, migration and invasion of PTC, while the gain-of-function study showed opposite results. Additionally, the angiogenic capacity was suppressed/promoted when there was a loss/increase, respectively, of TWSG1 in PTC cells, causing a series of downstream molecular alterations (VEGF, endostatin, PAI-1 and thrombospondin). Moreover, the study showed that the MMP activity was influenced by the upstream gene TWSG1 in PTC. TWSG1 could also regulate BMP activity in PTC by modulating the expression of Id1 and pSmad1/5.
Due to improvements in ultrasound technology, the rate of PTMC has increased in recent years [1]. In our study, the tumor sizes were all less than 2 cm (pT1), and pT1a tumors (PTMC) comprised the majority of the samples. The data indicated that larger tumors were more likely to have LNM, which is consistent with a previous study [20]. In addition, there were no cases with extrathyroid extension included in the study, which is another risk factor of LNM [21]; thus, the impact of extrathyroid extension on LNM was eliminated. According to our results, the sensitivity of TWSG1 was much higher, although the specificity was lower, than ultrasonography in identifying cervical LNM [22]. We believe that these two methods could be complementary in future clinical applications.
As noted in the introduction, TWSG1 could be an antagonist or agonist of BMPs, and its effects on cancer cells are bidirectional [23, 24]. While BMPs have been extensively studied in various cancers, the role of BMPs in thyroid cancer is unknown, similar to TWSG1. Jolene et al. [25] reported that TWSG1 was overexpressed in cholangiocellular and hepatocellular carcinoma, which are both malignant epithelial cell cancers. PTC is also an epithelial cell-derived malignant disease. In our study, TWSG1 was overexpressed in PTC with LNM compared to that without LNM, indicating that TWSG1 is likely to be involved in metastasis of PTC. Generally, cancer metastasis is a combination of several processes, including proliferation, migration, and invasion. To study the functional role of TWSG1 in PTC, we performed loss/gain of function studies. Our results confirmed that TWSG1 controls the malignant behavior of PTC cells, such as proliferation, angiogenesis, and invasion, which results in PTC metastasis.
Angiogenesis is an important mechanism of tumor cell growth and requires not only tumor cell proliferation but also a vascular network for growing tumors and subsequently contributes to tumor metastasis. To investigate the role of TWSG1 in angiogenesis, we assessed several angiogenesis-related genes in the study. VEGF, an angiogenic factor, induces proliferation and migration of vascular endothelial cells and is essential for both physiological and pathological angiogenesis [26]. It was found to be positively regulated by TWSG1 in PTC in this study. At the same time, anti-angiogenic genes, such as endostatin, PAI-1 and thrombospondin-1, were negatively regulated by TWSG1. Another mechanism of angiogenesis modulation by TWSG1 is its regulatory role on MMPs, which are necessary not only for tumor cell invasiveness but also for angiogenesis [27, 28]. However, the tube formation was not affected under varied rTWSG1 concentration, which indicated that TWSG1 does not exert a direct influence on angiogenesis. Therefore, it is through affecting the expression of angiogenic and anti-angiogenic factors (VEGF, endostatin, etc) that TWSG1 controls angiogenesis.
MMPs are a family of zinc-dependent endoproteinases with enzymatic activity against components of the extracellular matrix (ECM). MMPs facilitate tumor progression by enabling tumor cells to detach from each other for invasion and metastasis [29]. Dandan Dong et al. [30] reported that ADAM15 promoted non-small cell lung cancer invasion by directly activating MMP9. Cheng HP et al. [31] reported that renal cell carcinoma patients with high MMP-2 levels exhibit rapid progression and that high MMP-2 levels are associated with poor prognosis. Here, we report a positive regulatory relationship between TWSG1 and several MMPs, such as MMP2 and MMP9, which explains the effect of TWSG1 on tumor cell behavior. When TWSG1 was silenced or enhanced, MMP2 and MMP9 were correspondingly downregulated or upregulated, respectively, which resulted in improper processing of ECM, leading to the impairment or enhancement of tumor migration and invasion.
Our study also determined how TWSG1 regulates BMP activity. The relationship between TWSG1 and BMPs is currently under debate. In our study, TWSG1 positively regulated BMP activity by altering Id1 expression and Smad1/5 phosphorylation. This study indicates that TWSG1 is an agonist of BMP signaling.
Conclusion
Taken together, the results showed that TWSG1 is overexpressed in metastasized PTC and is valuable in predicting LNM of PTC. TWSG1 promotes tumor progression by enhancing tumor growth and malignant cell behavior and stimulating tumor-associated angiogenesis.
Supplementary Material
Supplementary figures.
Acknowledgements
This work was supported by the National Natural Science Foundation of China (81671688 & 81471668).
Competing Interests
The authors have declared that no competing interest exists.
References
1. Davies L, Welch HG. Current thyroid cancer trends in the United States. JAMA otolaryngology- head & neck surgery. 2014;140:317-22
2. Pellegriti G, Frasca F, Regalbuto C, Squatrito S, Vigneri R. Worldwide increasing incidence of thyroid cancer: update on epidemiology and risk factors. Journal of cancer epidemiology. 2013;2013:965212
3. Jemal A, Siegel R, Xu J, Ward E. Cancer statistics, 2010. CA: a cancer journal for clinicians. 2010;60:277-300
4. Caron NR, Clark OH. Papillary thyroid cancer: surgical management of lymph node metastases. Current treatment options in oncology. 2005;6:311-22
5. Grant CS. Recurrence of papillary thyroid cancer after optimized surgery. Gland surgery. 2015;4:52-62
6. Patron V, Hitier M, Bedfert C, Le Clech G, Jegoux F. Occult lymph node metastases increase locoregional recurrence in differentiated thyroid carcinoma. The Annals of otology, rhinology, and laryngology. 2012;121:283-90
7. Leboulleux S, Rubino C, Baudin E, Caillou B, Hartl DM, Bidart JM. et al. Prognostic factors for persistent or recurrent disease of papillary thyroid carcinoma with neck lymph node metastases and/or tumor extension beyond the thyroid capsule at initial diagnosis. The Journal of clinical endocrinology and metabolism. 2005;90:5723-9
8. Hanahan D, Weinberg RA. Hallmarks of cancer: the next generation. Cell. 2011;144:646-74
9. Wang J, Weng Y, Zhang M, Li Y, Fan M, Guo Y. et al. BMP9 inhibits the growth and migration of lung adenocarcinoma A549 cells in a bone marrow stromal cellderived microenvironment through the MAPK/ERK and NF-kappaB pathways. Oncology reports. 2016;36:410-8
10. Ampuja M, Alarmo EL, Owens P, Havunen R, Gorska AE, Moses HL. et al. The impact of bone morphogenetic protein 4 (BMP4) on breast cancer metastasis in a mouse xenograft model. Cancer letters. 2016;375:238-44
11. Zhang T, Fu J, Li Y, Wang Y, Zhang L, Liu Y. Bone morphogenetic protein 7 is associated with the nodal invasion of colon cancer. Oncology letters. 2016;11:1707-12
12. Bami M, Mavrogenis AF, Angelini A, Milonaki M, Mitsiokapa E, Stamoulis D. et al. Bone morphogenetic protein signaling in musculoskeletal cancer. Journal of cancer research and clinical oncology. 2016
13. Hover LD, Owens P, Munden AL, Wang J, Chambless LB, Hopkins CR. et al. Bone morphogenetic protein signaling promotes tumorigenesis in a murine model of high-grade glioma. Neuro-oncology. 2016;18:928-38
14. Ehata S, Yokoyama Y, Takahashi K, Miyazono K. Bi-directional roles of bone morphogenetic proteins in cancer: another molecular Jekyll and Hyde? Pathology international. 2013;63:287-96
15. Hu F, Zhang Y, Li M, Zhao L, Chen J, Yang S. et al. BMP-6 inhibits the metastasis of MDA-MB-231 breast cancer cells by regulating MMP-1 expression. Oncology reports. 2016;35:1823-30
16. Deng H, Makizumi R, Ravikumar TS, Dong H, Yang W, Yang WL. Bone morphogenetic protein-4 is overexpressed in colonic adenocarcinomas and promotes migration and invasion of HCT116 cells. Experimental cell research. 2007;313:1033-44
17. Larrain J, Oelgeschlager M, Ketpura NI, Reversade B, Zakin L, De Robertis EM. Proteolytic cleavage of Chordin as a switch for the dual activities of Twisted gastrulation in BMP signaling. Development. 2001;128:4439-47
18. Brazil DP, Church RH, Surae S, Godson C, Martin F. BMP signalling: agony and antagony in the family. Trends in cell biology. 2015;25:249-64
19. Saiselet M, Floor S, Tarabichi M, Dom G, Hebrant A, van Staveren WC. et al. Thyroid cancer cell lines: an overview. Frontiers in endocrinology. 2012;3:133
20. Ma B, Wang Y, Yang S, Ji Q. Predictive factors for central lymph node metastasis in patients with cN0 papillary thyroid carcinoma: A systematic review and meta-analysis. International journal of surgery. 2016;28:153-61
21. Sun W, Lan X, Zhang H, Dong W, Wang Z, He L. et al. Risk Factors for Central Lymph Node Metastasis in CN0 Papillary Thyroid Carcinoma: A Systematic Review and Meta-Analysis. PLoS One. 2015;10:e0139021
22. Kim E, Park JS, Son KR, Kim JH, Jeon SJ, Na DG. Preoperative diagnosis of cervical metastatic lymph nodes in papillary thyroid carcinoma: comparison of ultrasound, computed tomography, and combined ultrasound with computed tomography. Thyroid: official journal of the American Thyroid Association. 2008;18:411-8
23. Ghosh-Choudhury N, Woodruff K, Qi W, Celeste A, Abboud SL, Ghosh Choudhury G. Bone morphogenetic protein-2 blocks MDA MB 231 human breast cancer cell proliferation by inhibiting cyclin-dependent kinase-mediated retinoblastoma protein phosphorylation. Biochemical and biophysical research communications. 2000;272:705-11
24. Alarmo EL, Kallioniemi A. Bone morphogenetic proteins in breast cancer: dual role in tumourigenesis? Endocrine-related cancer. 2010;17:R123-39
25. Johnston J, Al-Bahrani R, Abuetabh Y, Chiu B, Forsman CL, Nagamori S. et al. Twisted gastrulation expression in cholangiocellular and hepatocellular carcinoma. Journal of clinical pathology. 2012;65:945-8
26. Ren B. Protein Kinase D1 Signaling in Angiogenic Gene Expression and VEGF-Mediated Angiogenesis. Frontiers in cell and developmental biology. 2016;4:37
27. Orlichenko LS, Radisky DC. Matrix metalloproteinases stimulate epithelial-mesenchymal transition during tumor development. Clinical & experimental metastasis. 2008;25:593-600
28. Huang SC, Sheu BC, Chang WC, Cheng CY, Wang PH, Lin S. Extracellular matrix proteases - cytokine regulation role in cancer and pregnancy. Frontiers in bioscience. 2009;14:1571-88
29. Kleiner DE, Stetler-Stevenson WG. Matrix metalloproteinases and metastasis. Cancer chemotherapy and pharmacology. 1999;43(Suppl):S42-51
30. Dong DD, Zhou H, Li G. ADAM15 targets MMP9 activity to promote lung cancer cell invasion. Oncology reports. 2015;34:2451-60
31. Cheng HP, Duan YR, Li Y, Li XD, Zhu CY, Chen BP. Clinicopathological Significance of Matrix Metalloproteinase-2 Protein Expression in Renal Cell Carcinoma Patients. Analytical and quantitative cytopathology and histopathology. 2015;37:353-63
Author contact
![]() Corresponding author: Weiwei Zhan, Ultrasound Department, Rui Jin Hospital Shanghai Jiao Tong University School of Medicine.197 Rui Jin Er Road, Huang Pu District, Shanghai, Zip code: 200025, P. R. of China. Tel: +8618019431399 E-mail: shanghairuijinuscom
Corresponding author: Weiwei Zhan, Ultrasound Department, Rui Jin Hospital Shanghai Jiao Tong University School of Medicine.197 Rui Jin Er Road, Huang Pu District, Shanghai, Zip code: 200025, P. R. of China. Tel: +8618019431399 E-mail: shanghairuijinuscom