Impact Factor ISSN: 1837-9664

 Global reach, higher impact
J Cancer 2017; 8(19):3975-3983. doi:10.7150/jca.20889 This issue Cite
Research Paper
Tumoral ANXA1 Is a Predictive Marker for Sunitinib Treatment of Renal Cancer Patients
Marjut Niinivirta1,2, Gunilla Enblad1,2, Per-Henrik Edqvist3, Fredrik Pontén3, Anca Dragomir3,4, Gustav J. Ullenhag1,2 ![]()
1. Department of Immunology, Genetics and Pathology, Uppsala University, Uppsala, Sweden
2. Department of Oncology, Uppsala University Hospital, Entrance 78, 751 85 Uppsala, Sweden
3. Department of Immunology, Genetics and Pathology and Science for Life Laboratory, Uppsala University, Dag Hammarskjölds väg 20, 751 85 Uppsala, Sweden
4. Department of Surgical Pathology, Uppsala University Hospital, 75185 Uppsala, Sweden.
Received 2017-5-5; Accepted 2017-8-16; Published 2017-10-23
Abstract
Background and aims: There is no established predictive marker for the treatment of renal cancer. Metastatic renal cell carcinoma (mRCC) patients are often treated with sunitinib, a tyrosine kinase inhibitor. Sunitinibs anti-cancer effect is at least partly mediated through interfering with angiogenesis. Our aim with the current study was to assess annexin A1 (ANXA1), which stimulates angiogenesis, as a predictive marker for sunitinib therapy in mRCC patients. Since previous studies have indicated a predictive potential for cubilin, we also investigated the predictivity of ANXA1 combined with cubilin.
Methods: ANXA1 expression was analysed in tumor tissue from a cohort of patients with advanced RCC (n=139) using immunohistochemistry. Ninety-nine of the patients were treated with sunitinib in the first or second-line setting. Twenty-two of these were censored because of toxicity leading to the termination of treatment and the remaining (n=77) were selected for the present study.
Results: Twenty-five (32%) out of seventy-seven of the tumors lacked ANXA1 in the cytoplasm. On statistical analyses using Kaplan-Meier method, aNXA1 negative tumors were significantly associated with a longer treatment benefit in terms of progression free survival (PFS). Overall survival was also significantly better for patients with ANXA1 negative tumors. The combined ANXA1 positive and cubilin negative expression could more accurately than ANXA1 alone define the group not benefitting from treatment.
Conclusions: Our results indicate that cytoplasmic expression of ANXA1 is a negative predictive marker for sunitinib therapy in mRCC patients. A possible explanation for this finding is that sunitinibs anti-angiogenic effect cannot overcome the pro-angiogenic drive from many ANXA1 proteins.
Keywords: Renal cancer, sunitinib, tissue microarray, predictive marker, ANXA1
Introduction
Although advances in the oncological treatment of metastatic renal cell carcinoma (mRCC) have been made, the prognosis is still poor. Finding molecular targets for RCC has been an area for research in recent years. This work has led to the establishment of new therapeutic agents: the tyrosine kinase inhibitors (TKI) sunitinib, sorafenib, pazopanib and axitinib [1]. Sunitinib, which is the focus for the current study, targets the receptors of vascular endothelial growth factor (VEGF) and platelet-derived growth factor (PDGF) [2]. For sunitinib given as first line treatment in metastatic disease, the median progression free survival (PFS) extends to 11 months in selected patients [3].
Defining predictive factors is key to select the individuals that will benefit from medication. At the same time, patients without benefit from for example TKI treatment, can avoid possible severe and sometimes even chronic toxicity. In addition, by establishing a predictive marker, the cancer treatment costs can be reduced.
There is currently no predictive marker for RCC treatment but some candidates have been proposed. The majority of the studies have investigated the potential of serum proteins to predict the response to sunitinib therapy [4, 5, 6]. Development of hypertension which is a common side effect of sunitinib treatment is associated with a significantly longer PFS and overall survival (OS) in patients with mRCC [7].
Annexins belong to a well-known multigene family of Ca2+-regulated phospholipid-binding and membrane-binding proteins [8]. They are characterized by the unique architecture of their Ca2+-binding sites, which enables them to peripherally dock onto negatively charged membrane surfaces in their Ca2+-bound conformation [9]. Annexins are involved in cellular processes, including apoptosis, proliferation and differentiation [8, 9]. In vertebrates, 12 annexin subfamilies (A1-A11 and A13) have been identified [10]. Annexin 1 (ANXA1) has potential anti-inflammatory activity since it inhibits phospholipase A2, potent mediators of inflammation, prostaglandins and leukotrienes [11]. In addition, ANXA1 may stimulate VEGF-mediated angiogenesis [12].
Among the annexin A group, A1, A2, A4 and A5 play important roles in breast cancer, pancreatic cancer and laryngeal carcinoma by regulating apoptosis, carcinogenesis, migration and invasion of cancer cells [13]. ANXA1 is differentially expressed in tumor cells with variable expression ranging from high levels to lack of ANXA1 expression (www.proteinatlas.org) [14, 15]. A low ANXA1 expression is observed in oesophageal squamous cell carcinoma whereas a high expression is found in colorectal cancer [16]. In another previous study, ANXA1 expression was significantly upregulated in gastric adenocarcinoma cells and was closely related to the depth of tumor invasion, lymph node metastasis, distant metastasis and TNM stage. A high ANXA1 expression was associated with a poor prognosis in these patients [16]. In another study, ANXA1 was highly expressed in cholangiocarcinoma but to a low extent in hepatocellular carcinoma [17]. In patients with invasive breast cancer, tumoral overexpression of ANXA1 was related to unfavorable prognostic factors [18].
ANXA1 is ubiquitously expressed in normal human tissues, with high levels of expression in squamous epithelia of mucosa, hematopoietic and immune cells. In normal kidney ANXA1 expression is mainly detected in glomeruli and in primary RCC.
ANXA was identified as a potentially interesting protein through systematic researches within The Human Protein Atlas (www.proteinatlas.org) internal database for proteins. It was selected for further studies based on highly specific expression patterns in normal kidney and renal cancers on both immunohistochemistry level and RNA level [15]. In the present study we analyse the expression pattern of ANXA1 protein in a cohort of patients with advanced RCC to explore the potential role of ANXA1 as a predictive marker for sunitinib treatment. We also examine the predictive role of the combination of ANXA1 and membranous cubilin (CUBN) expression. We have recently demonstrated that CUBN is a prognostic and predictive factor in this patient group [19, 20].
Materials And Methods
Patients
In an attempt to overcome some of the reporting deficiencies inherent in tumor marker studies we followed the REporting recommendations for tumor MARKer studies (REMARK) [21] when compiling this manuscript.
The Regional Ethical Committee (Uppsala, Sweden) granted approval for the study (2009/139) and patients still alive gave their written informed consent.
The cohort has been described previously [19] and consisted of 139 patients in seven Departments of Oncology in Sweden: Uppsala (n=48), Göteborg (n=36), Örebro (n=19), Västerås (n=12), Gävle (n=11), Falun (n=7) and Karlstad (n=6). These patients were diagnosed with mRCC between 2006 and 2010. All the patients had a prior nephrectomy and were thereafter treated with various therapeutic agents: TKI (sunitinib and sorafenib), mTOR inhibitor (temsirolimus), interferon α (IF-α) and/or bevacizumab. The patients (n=99) treated with sunitinib in the first or second line setting were selected for the current study. Twenty-two of these patients were excluded from analysis due to early side effects, which lead to the termination of treatment within 4 weeks, leaving 77 patients to the study.
Clinical data was collected, including the patient's age, gender and histologic subtype (Table 1) as well as the length of treatment with sunitinib and sorafenib. Progression free survival was calculated as the time from the start of treatment to the time of clinical and/or radiological progression, treatment discontinuation due to toxicity or end of follow up. We also registered the OS calculated from the diagnosis of mRCC.
Clinical characteristics of renal cancer patients treated for metastatic disease with sunitinib in the first- and second-line setting.
| Patient cohort | Total n=77 |
|---|---|
| Gender, n (%) | |
| Male | 53 (69) |
| Female | 24 (31) |
| Age at diagnosis, years | |
| Median (range) | 62 (40-76) |
| Age at metastatic disease, years | |
| Median (range) | 64,5 (40-77) |
| Histologictype, n (%) | |
| Clear cell | 68 (88) |
| Papillary | 2 (3) |
| Mixed phenotype | 2 (3) |
| Unknown | 5 (6) |
| Local disease at diagnosis, n (%) | 36 (47) |
| Metastatic disease at diagnosis, n (%) | 41 (53) |
| Time to metastasis, years | |
| Median (range) | 2 (0-18) |
| Metastasis during first year, n (%) | 14 (39) |
| Metastasis after first year, n (%) | 22 (61) |
| Alive, n (%) | 16 (21) |
| Dead, n (%) | 61 (79) |
Tissue microarray (TMA) generation
TMA, immunohistochemistry and slide scanning were essentially performed in accordance to standards used in the Human Protein Atlas (www.proteinatlas.org) [15, 22]. In brief, corresponding HE slides were examined and representative tumor regions selected for the TMA. For each patient, two cores (1 mm in diameter) containing tumor tissue were collected (except in one case where there was only enough material for one core) by punch biopsy and transferred to recipient paraffin blocks subsequently containing 277 cores. TMArrayer™ (Pathology Devices, Westminster, MD, USA) and the Beecher Instruments Manual Tissue Arrayer MTA-1 (Estigen OÜ, Tartu, Estonia) were used for this procedure.
Immunohistochemical methods
Immunohistochemistry and slide scanning was performed at the Swedish Science for Life Laboratory (SciLifeLab) facilities in the Department of Immunology, Genetics, and Pathology at the Rudbeck Laboratory of Uppsala University. In brief, 4-μm TMA sections collected on SuperFrost Plus slides were prior to immunostaining deparaffinised in xylene, re-hydrated in graded alcohols, blocked for endogenous peroxidase, and subjected to heat-induced antigen retrieval. Automated IHC was performed using a LabVisionAutostainer 480S (Thermo Fisher Scientific, Runcorn, UK). Primary antibody towards Annexin A1 (HPA011272, Atlas Antibodies, Stockholm Sweden) was validated for immunohistochemistry according to criteria established by The Human Protein Atlas [22]. In Western blot, the ANXA1 antibody produced a single band corresponding to the predicted molecular weight, and showed great IHC consistency with four independent ANXA1 antibodies in a multitude of tissues, and IHC-data corresponded to the tissue-expression levels of ANXA as assessed by RNA-sequencing. All validation data can be found at http://www.proteinatlas.org/ENSG00000135046-ANXA1/tissue. The antibody was diluted 1:125 in UltraAb Diluent (Thermo Fisher Scientific, Fremont, CA, USA) and applied to the slides for 30 min at room temperature. The slides were further incubated with the secondary reagent, an anti-rabbitmouse horse reddish peroxidase-conjugated UltraVision (Thermo Fisher Scientific, Runcorn, UK) for 30 min at room temperature. Following the washing steps, the slides were developed for 10 min using the avidin-biotin peroxidase staining technique (Vector elite; Vector Laboratories, Burlingame, CA, USA), using 3.3-diaminobenzidine as the substrate. The slides were then counterstained with Mayer's haematoxylin for 5 min (Sigma-Aldrich, St.Louis, MO, USA) and coverslipped with Pertex (HistolabAB, Gothenburg, Sweden).
Slide scanning and evaluation of staining
To obtain high-resolution digital images, the IHC slides were scanned with a 20x objective using the Aperio ScanScope XT Slide Scanner (Aperio Technologies, Vista, CA, USA).
The digital images were examined blindly in duplicates on a colour-calibrated screen using ImageScope (Aperio, Vista, CA, USA). Staining in the live tumor cells was semi-quantitatively evaluated by two observers, of which one pathology specialist (MN and AD) and disagreements were resolved by re-evaluation of the images. Three cellular compartments were annotated: nucleus, cytoplasm and membrane. Both staining intensity and the fraction of stained cells were categorically estimated using a scale of 0 to 3 for intensity (0=negative, 1=weak, 2=moderate, 3=strong), respectively of 0-4 for the fraction (0=0-1%, 1=2-25%, 2=26-50%, 3=51-75%, 4= 76-100%).
The distribution of the results for the cytoplasmic expression is given in Table 2.
Distribution of cytoplasmic staining results among primary tumours of renal cancer patients treated for metastatic disease with sunitinib in the first- and second line setting (n=77).
| Intensity of stained cytoplasm and distribution | |||
| Intensity Score | Intensity | Cytoplasm First Line | Cytoplasm Second Line |
| 0 | Negative | 8 | 0 |
| 1 | Weak | 27 | 13 |
| 2 | Moderate | 14 | 7 |
| 3 | Strong | 5 | 3 |
| Fraction of stained cytoplasm and distribution | |||
| Fraction Score | Percentage Stained | Cytoplasm First Line | Cytoplasm Second Line |
| 0 | 0-1% | 18 | 8 |
| 1 | 2-25% | 13 | 5 |
| 2 | 26-50% | 10 | 3 |
| 3 | 51-75% | 7 | 3 |
| 4 | 76-100% | 6 | 4 |
| Combined score (addition of intensity and fraction score) and distribution | |||
| Combined Score | Cytoplasm First Line | Cytoplasm Second Line | |
| 0 | 8 | 0 | |
| 1 | 9 | 8 | |
| 2 | 11 | 3 | |
| 3 | 7 | 2 | |
| 4 | 4 | 1 | |
| 5 | 10 | 7 | |
| 6 | 5 | 1 | |
| 7 | 0 | 1 | |
| Annexin A1 negative and positive cases | |||
| ANXA1 Expression | Cytoplasm First Line (%) | Cytoplasm Second Line (%) | Cytoplasm Both Lines (%) |
| ANXA1 (-) | 17 (31) | 8 (35) | 25 (32) |
| ANXA1 (+) | 37 (69) | 15 (65) | 52 (68) |
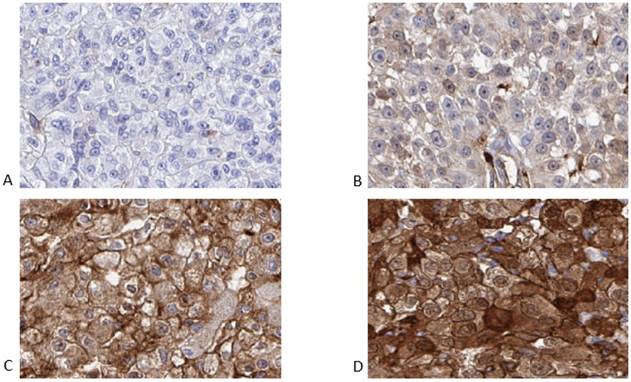
Representative examples of negative, weak, moderate and strong cytoplasmic intensity are shown in Figure 1.
Representative images of the immunohistochemistry results for ANXA1 from primary renal cell carcinomas, from patients later treated for metastatic disease with sunitinib in the first or second line setting, demonstrating negative (A), weak (B), moderate (C) and strong (D) cytoplasmic staining in tumor cells.
Statistical methods
For statistical analysis, the combined immune score for a cellular compartment was calculated by addition of the intensity score and fraction score, with a resulting scale from 0 to 7. For the cytoplasm staining the combined immune score 0-1 was defined as negative tumors and score 2-7 as positive tumors.
Statistical analyses (Kaplan-Meier method, log-rank test) were performed using STATISTICA program (version 2012). A two sided p-value < 0.05 was defined as statistically significant.
Results
Patients and follow-up
Seventy patients were treated with sunitinib in the first and 29 in the second line setting. Sixteen of the 70 patients and six of the 29 patients were excluded from analysis because of early side effects, which lead to the termination of treatment. The 77 remaining patients were treated at median 7 months with sunitinib (range 0.5-34 months). Eleven patients were still on treatment at the end of the follow up time (Table 3).
Treatment characteristics for renal cancer patients treated for metastatic disease with sunitinib in the first- and second-line setting.
| Sunitinib treatment | Total n=99 |
|---|---|
| Sunitinib first line, n (%) | 70 (71) |
| Sunitinib second line, n (%) | 29 (29) |
| Side effects leading to discontinuation of treatment, n (%) | 22 (22) |
| first line | 16 |
| second line | 6 |
| Treated until progression/end of follow-up, n (%) | 77 (78) |
| first line | 54 |
| second line | 23 |
| Median PFS, months (range) | 7 (0,5-34) |
| first line | 7,8 (0,5-34) |
| second line | 6 (1-24) |
| Still under treatment, n (%) | 11 (14) |
There were 53 males and 24 females in this final patient cohort. The median age of diagnoses in this group of patients was 62 years (range 40-76). Patients with localized disease at diagnosis (36 patients) were diagnosed with metastases 0-18 years later, median 2 years. Fourteen of these 36 patients developed metastatic disease during the first year after diagnoses. Forty-one patients had metastatic cancer already at diagnosis.
Median overall survival from the diagnoses of mRCC was 29 months (range 1-108 months). At the end of the study there were 16 patients still alive and 61 were deceased (Table 1). The mean length of follow-up available for the surviving patients was 32 months (range 8-84).
ANXA1 expression
The primary end-point of the study was PFS (defined clinically and/or radiologically) and the second OS in regard with ANXA1 expression. For nuclei and membrane staining we found no correlations with the primary end point of the study (data not shown). For the cytoplasm staining, when using the cut-off value for combined staining score described above, 25/77 (32%) cases were ANXA1 negative.
The PFS was significantly better in patients with ANXA1 negative tumors (p = 0.02, Figure 2A). We observed that patients with ANXA1 positive tumors were treated with sunitinib in median 6.5 months (range 0.5-24 months) compared to ANXA1 negative patients with a median treatment time of 9 months (range 1-34 months). Patient age or gender showed no correlation to the cytoplasm expression of ANXA1 (data not shown).
Progression free (A) and overall (B) survival for renal cancer patients treated for metastatic disease with sunitinib in the first or second line setting (n=77). ANXA1 (-) versus ANXA1 (+) tumors, cytoplasm.
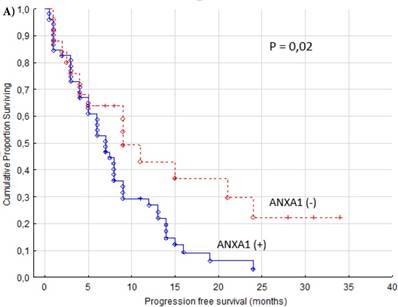
Patients with negative ANXA1 staining had a significantly better OS (cytoplasm p = 0.0047, Figure 2B). The ANXA1 positive group had a median OS of 26 months (range 1-72 months) while ANXA1 negative had a median of 31 months (range 7-108 months).
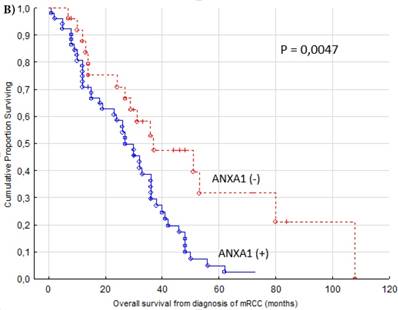
The group in our TMA cohort of mRCC patients having received first or second line sorafenib treatment (n=53) was also analyzed. We found that cytoplasmic ANXA1 expression appears not to be associated with neither PFS, nor OS (p = 0.43/0.88 for cytoplasm) in these patients (Figure 3).
Progression free survival for renal cancer patients treated for metastatic disease with sorafenib in the first or second line setting (n=53). ANXA1 (-) versus ANXA1 (+) tumors, cytoplasm.
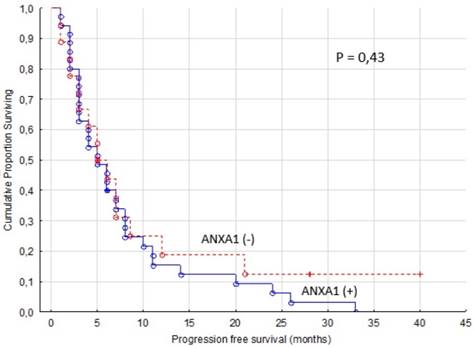
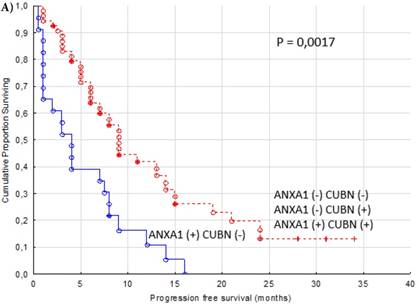
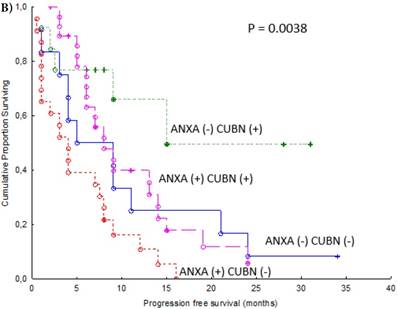
In an additional analysis, we combined expression of cytoplasmic ANXA1 and membranous CUBN. Patients with combination ANXA1 positive and CUBN negative tumor had significantly shorter PFS compared to the other combinations of expression as a group (p = 0.0017, Figure 4A) and compared to respective combination of expression. (p = 0.0038, Figure 4B).
Progression free survival for renal cancer patients treated for metastatic disease with sunitinib in the first or second line setting (n=77). Cytoplasmic ANXA1 (+) and membranous CUBN (-) versus other combinations of expression as a group (A) and versus other combinations of expression respectively (B).
Discussion
There are several prognostic factors for RCC patients like number of metastatic sites, time from diagnosis to treatment, Karnofsky performance status, lactate dehydrogenase, hemoglobin, white blood count, platelets count, “corrected” serum calcium and alkaline phosphatase [23, 24]. However, no predictive marker exists. Sunitinib, an orally administered TKI, is one of the first and most used targeted therapies for these patients. ANXA1 is a protein that may inhibit inflammation while stimulating angiogenesis and exhibits differential expression in various tumors [11, 12]. In the present study we used a well-validated antibody to assess tumoral ANXA1 expression as a predictive marker for sunitinib treatment in mRCC patients.
VEGF- and PDGF-receptors are overexpressed in clear cell RCC due to inactivation of the tumor-suppressor gene von Hippel-Lindau (VHL) in the majority of the cases [25]. By inhibiting receptors of VEGF and PDGF, sunitinib prevents tumor angiogenesis, tumor growth and metastasis [26, 27]. A study of 750 mRCC patients showed that treatment with sunitinib compared to interferon-α prolonged PFS with six months (median) though it is important to note that some patients benefit much more while others have no gain at all from the treatment [3]. Considering this together with the fact that some patients experience severe side effects [28] and that the medication is costly stresses the need for a predictive marker.
It is well known that hypertension is a common side effect of TKIs. Further, hypertension related to sunitinib treatment in mRCC patients is associated with a better response and prolonged OS [7, 29]. Rini et al. studied over 500 mRCC patients treated with sunitib and found that PFS and OS were significantly longer for patients developing hypertension [30]. Thus, hypertension is considered an early evaluator of response to sunitinib treatment.
Most of the previous predictive marker studies in mRCC patients have focused on serum biomarkers for sunitinib treatment. Tumor necrosis factor α (TNF-α) and metalloproteinase-9 (MMP-9) baseline levels were measured in a small study of patients (n=21) treated with sunitinib [4]. Overexpression of both these proteins promote cancer development [31, 32]. Baseline levels were significantly increased in non-responders and significantly associated with a reduced time to progression (TTP) and OS. In a study of 85 patients treated with sunitinib high baseline levels of serum VEGF and neutropfilgelatinase-associated lipocalin (NGAL) indicated a higher relative risk of progression [5]. In a phase II study, patients with advanced urothelial cancer who were not suitable to receive standard treatment with cisplatin-based chemotherapy were treated with sunitinib in the first line setting (n=38). Interleukin 8 (IL-8) is a pro-inflammatory chemokine and a potent pro-angiogenic factor [33] and low pre-treatment levels were significantly associated with an increased TTP [34].
Serum is relatively easy to access to search for potential predictive factors but important features of the tumor might not be reflected systemically. In a TMA with substantially fewer mRCC patients than ours, potential predictive markers for response to sunitinib treatment were investigated. Hypoxia-inducible factor 1α (HIF-1α), CA9, CD31, VEGF receptors, pPDGFRα and -β and Ki67 were all associated with sunitinib response. In addition, a high HIF-1α expression was positively correlated to a longer PFS and a low PDGFRα score to a longer OS. Furthermore, patients with a low CA9 score a much shorter OS compared to patients with a high CA9 score [6]. In patients with advanced RCC receiving VEGF-targeted therapy (pazobanib or sunitinib), increased tumor cell PD-L1 or PD-L1 plus tumor CD8-positive T-cell counts predicted significantly shorter PFS and OS [35].
Several preclinical studies of ANXA1s function have been reported. In a mouse model of prostate cancer, cancer-associated fibroblasts (CAFs) secreted significantly higher levels of ANXA1 than normal prostate fibroblasts. ANXA1 secreted by CAFs induced prostate cancer cells to gain stem cells-like properties. This was accomplished through stimulation of differentiation and proliferation of the cancer stem-like cell population and through promoting generation of basal stem-like cells [36].
ANXA1 expression has also been shown to be associated with a highly invasive basal-like breast cancer subtype. Loss of ANXA1 expression reduced the number of lung metastases and high expression increased metastatic spread. ANXA1 stimulates metastatic development through stimulation of transforming growth factor β (TGF-β)/Smad signaling [37].
The neuroprotective effect of ANXA1 was explored and the findings indicate that ANXA1 promotes microglial activation and migration [38].
ANXA1 mimics the anti-inflammatory effects of glucocorticoids [11]. However, it has also been shown to be expressed on activated T- and B-cells, thereby promoting T-cell mediated immunity [39].
ANXA1 expression is associated with poor prognosis in cancer patients [16, 18]. The proposed pro-angiogenic activity of ANXA1 indicates that ANXA1 could be of predictive value for the anti-angiogenic drug sunitinib [12]. The current study is to our knowledge the first to investigate a potential predictive role for ANXA1.
In our study we found that patients with a low ANXA1 cytoplasmic expression in their primary tumors experienced a greater clinical benefit from sunitinib treatment in terms of a prolonged PFS. A possible explanation for this finding is that sunitinibs anti-angiogenic effect cannot overcome the pro-angiogenic drive from many ANXA1 proteins. We speculated that the sensitivity of the tumour to sunitinib therapy might be changed by the primary treatment and carried out a subgroup analysis. The difference in survival remained significant in the group having received sunitinib up front while no correlation was seen in the fewer mRCC patients who were treated with sunitinib after progression (data not shown). This subgroup analysis indicates that the value of ANXA1 as a predictive marker might be limited to the first line treatment setting.
In the group of patients in our cohort having received first or second line treatment with sorafenib, we found no association between ANXA1 expression and PFS or OS. The lack of significance might be explained by the limited number of patients, but since the survival curves show no tendency to separate, this is less likely. These findings indicate that ANXA1 expression is a specific predictive marker for sunitinib treatment, not for all TKIs.
In addition to PFS, the OS was also significantly longer in the ANXA1 (-) compared to the ANXA1 (+) sunitinib treated patients. A plausible explanation is that the gain in PFS is translated into a longer OS. However, some of the patients were later treated with other therapeutic agents, which could contribute to the difference in OS observed between the groups.
In the group of ANXA1 (+) cases, some patients benefitted from the treatment for many months. Hence, there is a need to better define the minor group of patients with no gain from sunitinib treatment. Therefore, we analyzed the combined expression of cytoplasmic ANXA1 and membranous CUBN. In our earlier study (19) we found that lack of membranous CUBN expression was a negative predictive marker for both sunitinib and sorafenib treatment. In the present study, the subset of patients with ANXA1 positive and CUBN negative tumor had significantly shorter PFS compared to other combinations of expression. This combined expression results in a higher predictive value than ANXA1 on its own and defines the population of patients who will not gain at all from sunitinib treatment.
We did not address the question how to detect patients who will experience severe side effects. Since the tumoral expression of ANXA1 is unlikely to reflect the reactions from the rest of the body, these patients were not included.
This study has some limitations. Due to its retrospective design, known serum prognostic markers (lactate dehydrogenase, hemoglobin, calcium) could for many patients not be recalled. Therefore, we were unable to assess whether ANXA1 has any prognostic value besides from being a predictive marker. Furthermore, the tumor response was not on a regular basis evaluated according to the Response Evaluation Criteria In Solid Tumors (RECIST) [40].
Conclusions
In summary, we show for the first time that tumoral expression of ANXA1 is a potential predictive marker for sunitinib treatment in mRCC patients. ANXA1 expression in the cytoplasm was in our material associated with a significantly shorter PFS and OS. In addition, we found that the combination of positive cytoplasmic ANXA1 expression and negative membranous CUBN expression more accurately, than ANXA1 alone, defines the subset of patients who does not benefit from treatment. Our results need to be confirmed in further studies before ANXA1 and CUBN can be routinely used to select patients for sunitinib treatment.
Abbreviations
ANXA1: Annexin A1; CAF: Cancer-associated fibroblast; CUBN: Cubilin; HIF: Hypoxia-inducible factor; IF- α: Interferon alfa; IL-8: Interleukin 8; MMP-9: Metalloproteinase-9; mRCC: Metastatic RCC; mTOR: Mammalian target of rapamycin; NGAL: Neutropfilgelatinase-associated lipocalin; OS: Overall survival; PDGF: Platelet-derived growth factor; PD-L1: Programmed death-1 ligand; PFS: Progression free survival; RANKL: Receptor activator of nuclear factor κ-B ligand; RCC: Renal cell carcinoma; REMARK: REporting recommendations for tumor MARKer studies; SciLifeLab: Swedish Science for Life Laboratory; TGF-β: Transforming growth factor β; TKI: Tyrosine kinase inhibitor; TMA: Tissue microarray; TNFα: Tumor necrosis factor α; TTP: Time to progression; VEGF: Vascular endothelial growth factor; VHL: Von Hippel-Lindau.
Acknowledgements
We are grateful to all patients.
Competing Interests
The authors have declared that no competing interest exists.
References
1. Cho IC, Chung J. Current status of targeted therapy for advanced renal cell carcinoma. Korean J Urol. 2012;53:217-28
2. Escudier B, Szczylik C, Porta C, Gore M. Treatment selection in metastatic renal cell carcinoma: expert consensus. Nat Rev Clin Oncol. 2012;9:327-37
3. Motzer RJ. et al. Sunitinib versus Interferon Alfa in Metastatic Renal-Cell Carcinoma. The New England Journal of Medicine. 2007:115-24
4. Perez-Gracia JL, Prior C, Guillen-Grima F, Segura V, Gonzalez A, Panizo A. et al. Identification of TNF-alpha and MMP-9 as potential baseline predictive serum markers of sunitinib activity in patients with renal cell carcinoma using a human cytokine array. Br J Cancer. 2009;101:1876-83
5. Porta C, Paglino C, De Amici M, Quaglini S, Sacchi L, Imarisio I. et al. Predictive value of baseline serum vascular endothelial growth factor and neutrophil gelatinase-associated lipocalin in advanced kidney cancer patients receiving sunitinib. Kidney Int. 2010;77:809-15
6. Dornbusch J, Zacharis A, Meinhardt M, Erdmann K, Wolff I, Froehner M. et al. Analyses of potential predictive markers and survival data for a response to sunitinib in patients with metastatic renal cell carcinoma. PLoS One. 2013;8:e76386
7. Szmit S, Langiewicz P, Zlnierek J, Nurzynski P, Zaborowska M, Filipiak KJ. et al. Hypertension as a predictive factor for survival outcomes in patients with metastatic renal cell carcinoma treated with sunitinib after progression on cytokines. Kidney Blood Press Res. 2012;35:18-25
8. Gerke V, Moss SE. Annexins: from structure to function. Physiol Rev. 2002;82:331-71
9. Gerke V, Creutz CE, Moss SE. Annexins: linking Ca2+ signalling to membrane dynamics. Nat Rev Mol Cell Biol. 2005;6:449-61
10. Rescher U, Gerke V. Annexins-unique membrane binding proteins with diverse functions. J Cell Sci. 2004;117:2631-9
11. Parente L, Solito E. Annexin 1: more than an anti-phospholipase protein. Inflamm Res. 2004;53:125-32
12. Pin AL, Houle F, Fournier P, Guillonneau M, Paquet ER, Simard MJ. et al. Annexin-1-mediated endothelial cell migration and angiogenesis are regulated by vascular endothelial growth factor (VEGF)-induced inhibition of miR-196a expression. J Biol Chem. 2012;287:30541-51
13. Deng S, Wang J, Hou L, Li J, Chen G, Jing B. et al. Annexin A1, A2, A4 and A5 play important roles in breast cancer, pancreatic cancer and laryngeal carcinoma, alone and/or synergistically. Oncol Lett. 2013;5:107-12
14. Uhlen M, Oksvold P, Fagerberg L, Lundberg E, Jonasson K, Forsberg M. et al. Towards a knowledge-based Human Protein Atlas. Nat Biotechnol. 28. United States. 2010:1248-50
15. Ponten F, Schwenk JM, Asplund A, Edqvist PH. The Human Protein Atlas as a proteomic resource for biomarker discovery. J Intern Med. 2011;270:428-46
16. Zhang ZQ, Li XJ, Liu GT, Xia Y, Zhang XY, Wen H. Identification of Annexin A1 protein expression in human gastric adenocarcinoma using proteomics and tissue microarray. World J Gastroenterol. 2013;19:7795-803
17. Hongsrichan N, Rucksaken R, Chamgramol Y, Pinlaor P, Techasen A, Yongvanit P. et al. Annexin A1: A new immunohistological marker of cholangiocarcinoma. World J Gastroenterol. 2013;19:2456-65
18. Yom CK, Han W, Kim SW, Kim HS, Shin HC, Chang JN. et al. Clinical significance of annexin A1 expression in breast cancer. J Breast Cancer. 2011;14:262-8
19. Niinivirta M, Enblad G, Edqvist P-H, Pontén F, Dragomir A, Ullenhag G. Tumoral cubilin is a predictive marker for treatment of renal cancer patients with sunitinib and sorafenib. Journal of Cancer Research and Clinical Oncology. 2017
20. Gremel G, Djureinovic D, Niinivirta M, Laird A, Ljungqvist O, Johannesson H. et al. A systematic search strategy identifies cubilin as independent prognostic marker for renal cell carcinoma. BMC Cancer. 2017;17:9
21. McShane LM, Altman DG, Sauerbrei W, Taube SE, Gion M, Clark GM. REporting recommendations for tumour MARKer prognostic studies (REMARK). Br J Cancer. 2005;93:387-91
22. Kampf C, Olsson I, Ryberg U, Sjostedt E, Ponten F. Production of tissue microarrays, immunohistochemistry staining and digitalization within the human protein atlas. J Vis Exp. 2012
23. Heng DY, Xie W, Regan MM, Warren MA, Golshayan AR, Sahi C. et al. Prognostic factors for overall survival in patients with metastatic renal cell carcinoma treated with vascular endothelial growth factor-targeted agents: results from a large, multicenter study. J Clin Oncol. 2009;27:5794-9
24. Manola J, Royston P, Elson P, McCormack JB, Mazumdar M, Negrier S. et al. Prognostic model for survival in patients with metastatic renal cell carcinoma: results from the international kidney cancer working group. Clin Cancer Res. 2011;17:5443-50
25. van der Veldt AA, Boven E, Helgason HH, van Wouwe M, Berkhof J, de Gast G. et al. Predictive factors for severe toxicity of sunitinib in unselected patients with advanced renal cell cancer. Br J Cancer. 2008;99:259-65
26. Oudard S, George D, Medioni J, Motzer R. Treatment options in renal cell carcinoma: past, present and future. Ann Oncol. 2007;18:25-31
27. Bergers G, Song S, Meyer-Morse N, Bergsland E, Hanahan D. Benefits of targeting both pericytes and endothelial cells in the tumor vasculature with kinase inhibitors. J Clin Invest. 2003;111:1287-95
28. Di Lorenzo G, Porta C, Bellmunt J, Sternberg C, Kirkali Z, Staehler M. et al. Toxicities of targeted therapy and their management in kidney cancer. Eur Urol. 2011;59(4):526-40
29. Rixe O, Billemont B, Izzedine H. Hypertension as a predictive factor of Sunitinib activity. Ann Oncol. 18. England. 2007:1117
30. Rini BI, Cohen DP, Lu DR, Chen I, Hariharan S, Gore ME. et al. Hypertension as a biomarker of efficacy in patients with metastatic renal cell carcinoma treated with sunitinib. J Natl Cancer Inst. 2011;103:763-73
31. Harrison ML, Obermueller E, Maisey NR, Hoare S, Edmonds K, Li NF. et al. Tumor necrosis factor alpha as a new target for renal cell carcinoma: two sequential phase II trials of infliximab at standard and high dose. J Clin Oncol. 2007;25:4542-9
32. Bergers G, Brekken R, McMahon G, Vu TH, Itoh T, Tamaki K. et al. Matrix metalloproteinase-9 triggers the angiogenic switch during carcinogenesis. Nat Cell Biol. 2000;2:737-44
33. Mizukami Y, Jo WS, Duerr EM, Gala M, Li J, Zhang X. et al. Induction of interleukin-8 preserves the angiogenic response in HIF-1alpha-deficient colon cancer cells. Nat Med. 2005;11:992-7
34. Bellmunt J, Gonzalez-Larriba JL, Prior C, Maroto P, Carles J, Castellano D. et al. Phase II study of sunitinib as first-line treatment of urothelial cancer patients ineligible to receive cisplatin-based chemotherapy: baseline interleukin-8 and tumor contrast enhancement as potential predictive factors of activity. Ann Oncol. 2011;22:2646-53
35. Choueiri TK, Figueroa DJ, Fay AP, Signoretti S, Liu Y, Gagnon R. et al. Correlation of PD-L1 tumor expression and treatment outcomes in patients with renal cell carcinoma receiving sunitinib or pazopanib: results from COMPARZ, a randomized controlled trial. Clin Cancer Res. 2015;21:1071-7
36. Geary LA, Nash KA, Adisetiyo H, Liang M, Liao CP, Jeong JH. et al. CAF-secreted Annexin A1 induces prostate cancer cells to gain stem cell-like features. Mol Cancer Research. 2014;4:607-621
37. De Graauw M, Van Miltenburg M, Schmidt M, Pont C, Lalai R, et alt. Annexin A1 regulates TGF-β signaling and promotes metastasis formation of basal-like breast cancer cells. Proc Natl Acad Sci USA. 2010;14:6340-6345
38. Liu S, Gao Y, Yu X, Zhao B, Liu L, Zhao Y, et alt. Annexin-1 mediates microglial activation and migration via the CK2 pahway during oxygen-glucose deprivation/reperfusion. Int J Mol Sci. 2016;10:1770
39. Gavins F, Hickey M. Annexin A1 and the regulation of innate and adaptive immunity. Front Immunolo. 2012;3:354
40. Therasse P, Arbuck SG, Eisenhauer EA, Wanders J, Kaplan RS, Rubinstein L. et al. New guidelines to evaluate the response to treatment in solid tumors. European Organization for Research and Treatment of Cancer, National Cancer Institute of the United States, National Cancer Institute of Canada. J Natl Cancer Inst. 2000;92:205-16
Author contact
![]() Corresponding author: Gustav J. Ullenhag, MD, Associate Professor, Tel: +46 18 611 00 00, Fax: +46 18 611 55 28, E-mail: Gustav.Ullenhaguu.se
Corresponding author: Gustav J. Ullenhag, MD, Associate Professor, Tel: +46 18 611 00 00, Fax: +46 18 611 55 28, E-mail: Gustav.Ullenhaguu.se