Impact Factor ISSN: 1837-9664

 Global reach, higher impact
J Cancer 2017; 8(19):4075-4082. doi:10.7150/jca.21415 This issue Cite
Research Paper
Programmed cell death ligand 1 protein levels predicted survival of non-small cell lung cancer
Shaohua Cui1*, Xinying Su2*, Lili Dong1, Jialin Qian1, Lin Ye1, Tianwei Zhang2, Haihua Fu2, Hulin Han2, Jiaqi Huang3, Yihong Yao3, Yi Gu2, Liyan Jiang1 ![]()
1. Department of Respiratory Medicine, Shanghai Chest Hospital, Shanghai Jiao Tong University, Shanghai, China
2. Asia & Emerging Markets, iMed, AstraZeneca, Shanghai, China
3. R&D, MedImmune, AstraZeneca, Gaithersburg, MD, USA
*Shaohua Cui and Xinying Su contributed equally to this study.
Received 2017-6-10; Accepted 2017-9-26; Published 2017-10-24
Abstract
Objective: To investigate the relationship between programmed death ligand 1 (PD-L1) expression using 5%, 25%, 50% cutoffs in tumor cells (TC) and postsurgical survival in non-small-cell lung cancer (NSCLC) patients. For samples with tumor infiltrating lymphocytes (TIL), correlation between PD-L1 expression in TIL using 1% cutoff and postsurgical survival was also evaluated.
Methods: Primary NSCLC tumor surgical samples staging I to IIIA of 126 patients who underwent surgical procedures from September 2009 to August 2012 in Shanghai Chest Hospital, Shanghai Jiao Tong University were retrospectively included. PD-L1 protein expression was detected by immunohistochemistry (IHC) assays. A rabbit anti-human PD-L1 (E1L3N) monoclonal antibody (1:300, CST#13684, Cell Signaling Technology) was used for PD-L1 IHC staining. PD-L1 expression was evaluated both on TC and TIL. Univariate and multivariate analyses for postsurgical survival were done using Kaplan-Meier and Cox regression model, respectively.
Results: The median postsurgical survival for all patients was 44.1 months [95% confidence interval (CI): 33.9-70.0 months). The median postsurgical survival for PD-L1 expression percentage 0, 1-50% and ≥50% were 51.9 months (95%CI: 33.9-70.0 months), 33.2 months (95%CI: 20.8-45.6 months) and 14.7 months (95%CI: 1.9-27.6 months), respectively (P = 0.002). Clinical stage and PD-L1 expression in TC (25% cutoff or 50% cutoff values) were found to be independent predictors for longer postsurgical survival in all cohort. Ninety (71.4%) of the 126 samples were identified to concurrent TIL. The median postsurgical survival time was 39.6 months (95% CI: 31.8-47.4 months) in patients with TIL. PD-L1 expression in TC (25% cutoff or 50% cutoff values) was found to be the independent predictor for longer postsurgical survival time in patients with TIL.
Conclusion: PD-L1 negative expression in TC at 25% or 50% cutoff values was the independent predictor for longer postsurgical survival time in both NSCLC samples and NSCLC samples with TIL. For patients with PD-L1 high expression at 25% or 50% cutoff values, PD-L1 blocking may be considered.
Keywords: Programmed death ligand 1 (PD-L1), non-small-cell lung cancer (NSCLC), tumor cells (TC), tumor infiltrating lymphocytes (TIL), survival
Introduction
Programmed death-1 receptor (PD-1) and its major ligand programmed death ligand 1 (PD-L1, B7-H1, CD274) play an important role in attenuating T-cell activation resulting in the downregulation of immune response against tumor [1, 2]. Within tumor microenvironment, PD-L1 can contribute to the inhibition of local immune response by ectopically up-regulating in tumor cells (TC) or tumor infiltrating lymphocytes (TIL) [3].
Recently, PD-1 and PD-L1 have been identified as two novel targets for cancer immunotherapy and PD-1/PD-L1 inhibitors have been developed as anticancer therapy in several cancer types, including non-small-cell lung cancer (NSCLC) [4, 5]. Immunocheckpoint inhibitors that target the PD-1/PD-L1 pathway have shown promising efficacy and acceptable toxicity in NSCLC patients [6-10]. The representative PD-L1 inhibitors, Nivolumab (Opdivo), Atezolizumab (Tecentriq), and Pembrolizumab (Keytruda) inhibit PD-1 mediated signaling by blocking PD-L1 from binding to PD-1, allowing T-cell activation and immune response.
The relationship between PD-L1 protein expression in TC/TIL and prognosis of NSCLC has not been extensively studied to date. This study aimed to evaluate the potential clinical significance of PD-L1 expression by TC and TIL in NSCLC. We investigated the relationship between PD-L1 expression using 5%, 25%, 50% cutoffs in TC and postsurgical survival. For samples with TIL, correlation between PD-L1 expression in TIL using 1% cutoff and postsurgical survival was also evaluated.
Materials and Methods
Patients, samples and clinical information collection
Primary NSCLC tumor surgical samples staging I to IIIA, from 126 patients were retrospectively included in the present study. The samples were from patients who underwent surgical procedures from September 2009 to August 2012 in Shanghai Chest Hospital, Shanghai Jiao Tong University. Formalin fixed and paraffin embedded (FFPE) sections of all samples were stained with hematoxylin and eosin (HE) and confirmed the NSCLC diagnosis.
Clinical parameters including age, gender, smoking status, histological type, tumor grade, clinical stage were collected from retrospective chart extraction. PD-L1 expression, EGFR mutation and KRAS mutation were detected using the following methods.
This study was approved by the Ethics Committees of Shanghai Chest Hospital, Shanghai Jiao Tong University. Written informed consent was obtained from all patients.
PD-L1 protein expression detection method
PD-L1 protein expression was detected by immunohistochemistry (IHC) assays. We used placenta and MDA-MB-231 as positive control for PD-L1 IHC, and MCF-7 as negative control for PD-L1 IHC. A rabbit anti-human PD-L1 (E1L3N) monoclonal antibody (1:300, CST#13684, Cell Signaling Technology) was used for PD-L1 IHC staining. The IHC procedure is briefly described as follows. Deparaffinized and rehydrated FFPE sections were immersed in high pH target retrieval solution in a pressure cooker (PTlink module, DAKO) at 97°C for 35 minutes. Sections were then treated with 2.5% H2O2 in methanol for 15 minutes, followed by an incubation of protein block solution (PBS with 2% cold water fish skin gelatin, 1% casein, 2% normal goat serum and 0.1% Tween-20) for 30 minutes. Subsequently, sections were incubated with primary antibody at room temperature for 60 minutes. After washing twice with TBS-T, sections were incubated with the EnVision+ -HRP labeled secondary antibody (K4003, DAKO) for 30 minutes. After a further two washes in TBS-T, slides were finally visualized using DAB substrate-chromagen (K3468, DAKO).
PD-L1 expression was evaluated both on tumor cells (TC) and tumor infiltrating lymphocytes (TIL). PD-L1 positivity in TC was defined by positive TC percentage regardless of staining intensity using 5%, 25% or 50% as cutoff values, while the positivity in TIL was defined by any positive staining on TIL using 1% as the cutoff value.
EGFR and KRAS detection method
DNA was isolated from frozen tissues using the Puregene DNA extraction kit (Qiagen, Maryland, USA) according to the manufacturer's instructions. A nanodrop 2000 Spectrophotometer was used to quantify the extracted DNA. For detection of EGFR and KRAS mutations, the concentration of each DNA sample was normalized to 0.4 ng/μL and 0.66 ng/μL, respectively. Then EGFR and KRAS mutations were detected by amplification refractory mutation system (ARMS) method. Human EGFR Gene 29 Mutations Fluorescence Polymerase Chain Reaction (PCR) Diagnostic Kit and Human KRAS Gene 7 Mutations Fluorescence Polymerase Chain Reaction (PCR) Diagnostic Kits (Amoy Diagnostics, Xiamen, China) were used for the EGFR and KRAS mutation detections in this study.
Statistical analysis
Postsurgical survival was calculated as the time from the date surgery was conducted until the date of death from any cause. The cutoff date of the study was April 16, 2017. Univariate and multivariate survival analyses were done using Kaplan-Meier and Cox regression model, respectively. For PD-L1 expression in TC, all analyses were done using three cutoff values: 5%, 25% and 50%. For PD-L1 expression in TIL, analyses were done using 1% cutoff value. Kaplan-Meier method was first applied to estimate postsurgical survival time, and 2-sided log-rank tests (Pooled over strata) were applied to compare differences between different groups. Then Cox regression model was used to explore the independent predictors for postsurgical survival among factors influence survival identified in the univariate analysis. Hazard ratios (HR) were estimated in the Cox analysis. Enter method was used in Cox analysis and the probability for stepwise for entry and removal was 0.05 and 0.10, respectively.
P values less than 0.05 were considered statistically significant. 95% confidence intervals (95% CI) were also presented along with point estimation values for survival time and HR. All statistical analyses and survival curves generation in this study were performed using SPSS software, version 13.0 (SPSS Inc., Chicago, IL, USA).
Results
Patient characteristics and PD-L1 expression in TC and TIL
A total of 126 patients were included in this study. Patients' demographic and clinicopathologic characteristics are shown in Table 1. The median age of all patients was 59 years (Range 32-78 years). These patients tended to be male gender (72.2%), ever-smokers (58.7%), and most patients (55.6%) were staged IIIA. Twenty-four (19.0%) patients and six (4.8%) patients harbored EGFR mutation and KRAS mutation, respectively. Ninety (71.4%) of the 126 samples were identified to concurrent TIL. The demographic and clinicopathologic characteristics of patients with TIL has also been shown in Table 1.
Basic information of the 126 NSCLC patients and 90 patients with TIL
| Characteristics | Total (n=126) n (%) | Samples with TIL (n=90) 90/126=71.4% n (%) | |
|---|---|---|---|
| Gender | Male | 91 (72.2) | 70 (77.8) |
| Female | 35 (27.8) | 20 (22.2) | |
| Smoking | Never smokers | 52 (41.3) | 31 (34.4) |
| Ever Smokers | 74 (58.7) | 59 (65.6) | |
| Age, years | Mean (Range) | 59 (32-78) | 60 (32-78) |
| Age | <60 years | 63 (50.0) | 41 (45.6) |
| ≥60 years | 63 (50.0) | 49 (54.4) | |
| Histological types | AD | 63 (50.0) | 38 (42.2) |
| Non-AD | 63 (50.0) | 52 (57.8) | |
| Tumor grade | Low differentiation | 33 (26.2) | 26 (28.9) |
| Other grades | 93 (73.8) | 64 (71.1) | |
| Clinical stage | I-II | 56 (44.4) | 37 (41.1) |
| IIIA | 70 (55.6) | 53 (58.9) | |
| PD-L1 expression in TC (5% cutoff) | +ve | 43 (34.1) | 37 (41.1) |
| -ve | 83 (65.9) | 53 (58.9) | |
| PD-L1 expression in TC (25% cutoff) | +ve | 23 (18.3) | 22 (24.4) |
| -ve | 103 (81.7) | 68 (75.6) | |
| PD-L1 expression in TC (50% cutoff) | +ve | 10 (7.9) | 10 (11.1) |
| -ve | 116 (92.1) | 80 (88.9) | |
| Presence of TIL | With TIL | 90 (71.4) | 90 (100) |
| Without TIL | 36 (28.6) | NA | |
| EGFR | +ve | 24 (19.0) | 15 (16.7) |
| -ve | 102 (81.0) | 75 (83.3) | |
| KRAS | +ve | 6 (4.8) | 5 (5.6) |
| -ve | 120 (95.2) | 85 (94.4) | |
Abbreviations: AD: adenocarcinoma; EGFR: epidermal growth factor receptor; KRAS: Kirsten rat sarcoma viral oncogene; NA: not applicable; NSCLC: non-small cell lung cancer; TIL: tumor infiltrating lymphocytes.
+ve and -ve represent positive and negative results.
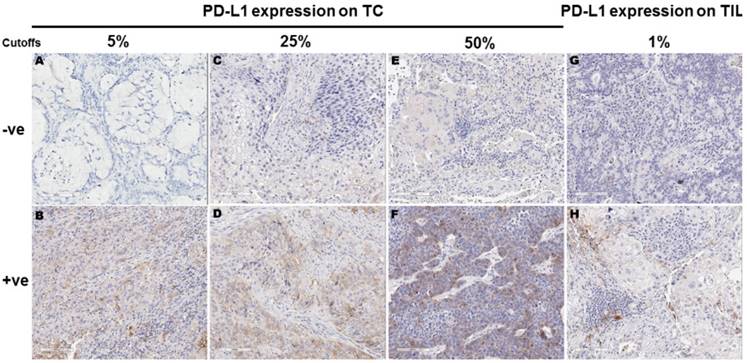
Using 5%, 25% and 50% as the cut-off values for PD-L1 positivity in TC, 43 (34.1%), 23 (18.3%) and 10 (7.9%) of the 126 samples showed PD-L1 membranous staining, respectively. Using 1% as the cutoff for PD-L1 positivity in TIL, 48 (53.3%) of the 90 samples with TIL showed PD-L1 expression in TIL. For the 90 samples with TIL, 37 (41.1%), 22 (24.4%) and 10 (11.1%) showed PD-L1 expression in TC at 5%, 25% and 50% cutoffs, respectively. Representative images for PD-L1 expression on TC and TIL were provided in Figure 1.
Programmed cell death ligand 1 (PD-L1) expression in tumor cells (TC) and tumor infiltrating lymphocytes (TIL) according to different cut-offs. Figures A-F represent PD-L1 protein expression on TC detected by immunohistochemistry. TC percentage for PD-L1 positivity in these images was 0 (A), 15% (B), 20% (C), 30% (D), 40% (E) and 60% (F), respectively. Figures G-H represent PD-L1 protein expression on TIL detected by immunohistochemistry. TIL percentage for PD-L1 positivity was 0 (G) and ≥10% (H), respectively.
Correlation between PD-L1 expression in TC and postsurgical survival
The median follow-up time for all cohort was 41.1 months. Eighty-five (67.5%) of the 126 patients died at the cutoff date. The median postsurgical survival for all patients time was 44.1 months (95%CI: 33.9-70.0 months).
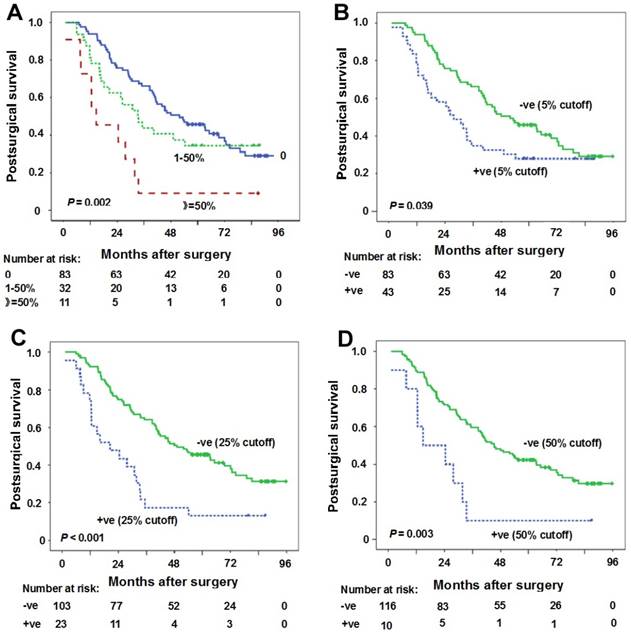
The association between PD-L1 expression in TC and survival was evaluated firstly according to the percentage PD-L1 expressed in TC. The comparison of postsurgical survival among three groups (PD-L1 expression percentage in TC: 0, 1-50%, ≥50%) was done. The median postsurgical survival for PD-L1 expression percentage 0, 1-50% and ≥50% was 51.9 months (95%CI: 33.9-70.0 months), 33.2 months (95%CI: 20.8-45.6 months) and 14.7 months (95%CI: 1.9-27.6 months), respectively (Figure 2A). A significant statistical significance can be observed (P = 0.002).
Correlation between PD-L1 expression in tumor cells (TC) and postsurgical survival time. (A) Kaplan-Meier curves of postsurgical survival with PD-L1 percentage in TC. The median postsurgical survival for PD-L1 expression percentage 0, 1-50% and ≥50% was 51.9 months (95%CI: 33.9-70.0 months), 33.2 months (95%CI: 20.8-45.6 months), 14.7 months (95%CI: 1.9-27.6 months), respectively (P = 0.002). (B-D) Kaplan-Meier curves of postsurgical survival with PD-L1 expression in TC according to 5% (B), 25% (C) and 50% (D) cutoffs in all samples. PD-L1 negative expression in TC (5% cutoff) (postsurgical survival time 51.9 months vs 27.7 months for positive expression, P = 0.039), PD-L1 negative expression in TC (25% cutoff) (postsurgical survival time 49.1 months vs 20.5 months for positive expression, P < 0.001), and PD-L1 negative expression in TC (50% cutoff) (postsurgical survival time 45.3 months vs 14.7 months for positive expression, P = 0.003) were predictors for longer postsurgical survival time. Tick marks represent censored observations. +ve and -ve represent positive and negative results, respectively.
The results of the univariate and multivariate survival analysis for all patients are shown in Table 2. The analyses revealed that female gender (postsurgical survival time 63.4 months vs 35.1 months for male gender, P = 0.030), moderate/high tumor differentiations (postsurgical survival time 46.1 months vs 30.8 months for low tumor differentiation, P = 0.015), stage I-II (postsurgical survival time 81.3 months vs 33.5 months for stage IIIA, P = 0.002), PD-L1 negative expression in TC (5% cutoff) (postsurgical survival time 51.9 months vs 27.7 months for positive expression, P = 0.039), PD-L1 negative expression in TC (25% cutoff) (postsurgical survival time 49.1 months vs 20.5 months for positive expression, P < 0.001), PD-L1 negative expression in TC (50% cutoff) (postsurgical survival time 45.3 months vs 14.7 months for positive expression, P = 0.003) were predictors for longer postsurgical survival time (Table 2, Figures 2B-D). However, clinical stage and PD-L1 negative expression in TC (25% cutoff or 50% cutoff values) were found to be independent predictors for longer postsurgical survival time in Cox regression model (Table 2). At 25% cutoff value, HR was 2.4 (95%CI: 1.4-4.2) for PD-L1 positivity in TC vs negativity in TC (P = 0.001). At 50% cutoff value, HR was 2.4 (95%CI: 1.1-4.7) for PD-L1 positivity in TC vs negativity in TC (P = 0.021).
Univariate and multivariate survival analysis for all patients (n=126)
| Characteristics | Comparisons | Univariate survival analysis | Multivariate survival analysis | ||
|---|---|---|---|---|---|
| Median postsurgical survival in months (95% CI) | p value | HR (95% CI) | p value | ||
| Gender | Male vs Female | 35.1 (27.0-43.1) vs 63.4 (29.3-97.4) | 0.030* | 1.3 (0.8-2.4) (5%) 1.3 (0.8-2.3) (25%) 1.5 (0.9-2.5) (50%) | 0.297 (5%) 0.344 (25%) 0.166 (50%) |
| Age | <60 years vs ≥60 years | 44.1 (29.0-59.2) vs 35.3 (19.1-51.4) | 0.274 | ||
| Smoking | Never vs Ever | 48.0 (26.7-69.2) vs 33.5 (23.9-43.0) | 0.070 | ||
| Histological types | AD vs Non-AD | 49.1 (28.1-70.0) vs 33.5 (26.4-40.5) | 0.064 | ||
| Tumor grade | Low differentiation vs Moderate and high differentiations | 30.8 (19.9-41.8) vs 46.1 (34.4-57.8) | 0.015* | 1.3 (0.8-2.2) (5%) 1.3 (0.8-2.1) (25%) 1.3 (0.8-2.1) (50%) | 0.258 (5%) 0.378 (25%) 0.333 (50%) |
| Clinical stage | I-II vs IIIA | 81.3 (NA) vs 33.5 (22.8-44.1) | 0.002* | 0.5 (0.3-0.8) (5%) 0.5 (0.3-0.8) (25%) 0.5 (0.3-0.9) (50%) | 0.007* (5%) 0.004* (25%) 0.012* (50%) |
| PD-L1 expression in TC (5%) | +ve vs -ve | 27.7 (18.2-37.1) vs 51.9 (33.9-70.0) | 0.039* | 1.5 (0.9-2.5) | 0.080 |
| PD-L1 expression in TC (25%) | +ve vs -ve | 20.5 (5.4-35.7) vs 49.1 (30.7-67.5) | <0.001* | 2.4 (1.4-4.2) | 0.001* |
| PD-L1 expression in TC (50%) | +ve vs -ve | 14.7 (0-33.1) vs 45.3 (33.8-56.8) | 0.003* | 2.4 (1.1-4.7) | 0.021* |
| Presence of TIL | With vs Without | 39.6 (31.8-47.4) vs 63.4 (28.3-98.4) | 0.099 | ||
| EGFR | +ve vs -ve | 45.3 (NA) vs 38.5 (26.7-50.3) | 0.096 | ||
| KRAS | +ve vs -ve | 14.7 (NA) vs 41.1 (32.2-50.1) | 0.706 | ||
*p<0.05.
Abbreviations: AD: adenocarcinoma; CI: confidence interval; EGFR: epidermal growth factor receptor; HR: hazard ratio; KRAS: Kirsten rat sarcoma viral oncogene; NSCLC: non-small cell lung cancer; TC: tumor cells; TIL: tumor infiltrating lymphocytes.
+ve and -ve represent positive and negative results.
Correlation between PD-L1 expression in TIL and postsurgical survival
The median follow-up time for patients with TIL was 40.2 months. Sixty- five (72.2%) of the 90 patients died at the cutoff date. The median postsurgical survival time was 39.6 months (95% CI: 31.8-47.4 months).
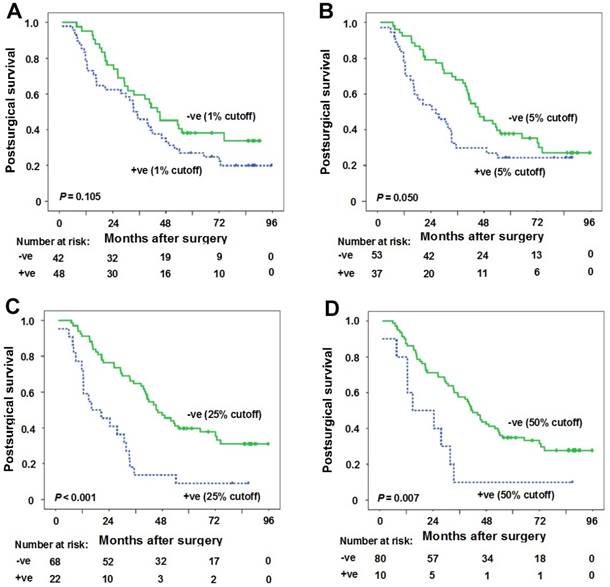
At 1% cutoff value for PD-L1 positivity in TIL, the median postsurgical time for patients with PD-L1 positivity in TIL and patients with PD-L1 negativity in TIL was 33.5 months (95%CI: 24.6-42.4 months) and 44.1 months (95% CI: 28.4-59.8 months), respectively. No statistical significance was observed between the two groups (P = 0.105) (Figure 3A).
Correlation between PD-L1 expression in tumor infiltrating lymphocytes (TIL) and postsurgical survival time. (A) Kaplan-Meier curves of postsurgical survival with PD-L1 percentage in TIL at 1% cutoff. The median postsurgical time for patients with PD-L1 positivity in TIL and patients with PD-L1 negativity in TIL was 33.5 months (95%CI: 24.6-42.4 months) and 44.1 months (95% CI: 28.4-59.8 months), respectively (P = 0.105). (B-D) Kaplan-Meier curves of postsurgical survival with PD-L1 expression in tumor cells (TC) according to 5% (B), 25% (C) and 50% (D) cutoffs in samples with TIL. PD-L1 negative expression in TC (5% cutoff) (postsurgical survival time 45.4 months vs 26.3 months for positive expression, P = 0.050), PD-L1 negative expression in TC (25% cutoff) (postsurgical survival time 45.4 months vs 16.1 months for positive expression, P < 0.001), and PD-L1 negative expression in TC (50% cutoff) (postsurgical survival time 41.3 months vs 14.7 months for positive expression, P = 0.007) were predictors for longer postsurgical survival time. Tick marks represent censored observations. +ve and -ve represent positive and negative results, respectively.
The results of the univariate and multivariate survival analysis for patients with TIL are shown in Table 3. The results suggested that female gender (postsurgical survival time 72.7 months vs 33.2 months for male gender, P = 0.011), never smoking history (postsurgical survival time 49.1 months vs 30.8 months for ever smoking, P = 0.011), moderate/high tumor differentiations (postsurgical survival time 41.8 months vs 29.9 months for low tumor differentiation, P = 0.015), PD-L1 negative expression in TC (5% cutoff) (postsurgical survival time 45.4 months vs 26.3 months for positive expression, P = 0.050), PD-L1 negative expression in TC (25% cutoff) (postsurgical survival time 45.4 months vs 16.1 months for positive expression, P < 0.001), PD-L1 negative expression in TC (50% cutoff) (postsurgical survival time 41.3 months vs 14.7 months for positive expression, P = 0.007) were predictors for longer postsurgical survival time (Table 3, Figures 3B-D). However, only PD-L1 negative expression in TC (25% cutoff or 50% cutoff values) was found to be the independent predictor for longer postsurgical survival time in Cox regression model (Table 3). At 25% cutoff value, HR was 2.3 (95%CI: 1.3-4.0) for PD-L1 positivity in TC vs negativity in TC (P = 0.005). At 50% cutoff value, HR was 2.2 (95%CI: 1.1-4.5) for PD-L1 positivity in TC vs negativity in TC (P = 0.034).
Univariate and multivariate survival analysis for patients with TIL (n=90)
| Characteristics | Comparisons | Univariate survival analysis | Multivariate survival analysis | ||
|---|---|---|---|---|---|
| Median postsurgical survival in months (95% CI) | p value | HR (95% CI) | p value | ||
| Gender | Male vs Female | 33.2 (27.1-39.4) vs 72.7 (31.5-113.9) | 0.011* | 1.5 (0.6-3.7) (5%) 1.4 (0.6-3.6) (25%) 1.4 (0.5-3.6) (50%) | 0.420 (5%) 0.460 (25%) 0.496 (50%) |
| Age | <60 years vs ≥60 years | 44.1 (33.6-54.6) vs 33.2 (21.2-45.2) | 0.207 | ||
| Smoking | Never vs Ever | 49.1 (20.7-77.4) vs 30.8 (23.1-38.5) | 0.011* | 0.8 (0.4-1.6) (5%) 0.8 (0.4-1.8) (25%) 0.7 (0.3-1.5) (50%) | 0.481 (5%) 0.638 (25%) 0.367 (50%) |
| Histological types | AD vs Non-AD | 44.1 (38.0-50.2) vs 30.8 (20.1-41.5) | 0.072 | ||
| Tumor grade | Low differentiation vs Moderate and high differentiations | 29.9 (16.8-42.9) vs 41.8 (33.7-50.0) | 0.015* | 1.6 (1.0-2.8) (5%) 1.5 (0.9-2.6) (25%) 1.7 (1.0-2.8) (50%) | 0.069 (5%) 0.111 (25%) 0.062 (50%) |
| Clinical stage | I-II vs IIIA | 44.1 (27.7-60.5) vs 33.7 (23.2-44.1) | 0.115 | ||
| PD-L1 expression in TC (5%) | +ve vs -ve | 26.3 (11.1-41.5) vs 45.4 (34.5-56.2) | 0.050* | 1.3 (0.8-2.2) | 0.365 |
| PD-L1 expression in TC (25%) | +ve vs -ve | 16.1 (2.4-29.7) vs 45.4 (34.6-56.1) | <0.001* | 2.3 (1.3-4.0) | 0.005* |
| PD-L1 expression in TC (50%) | +ve vs -ve | 14.7 (0-33.1) vs 41.3 (35.0-47.6) | 0.007* | 2.2 (1.1-4.5) | 0.034* |
| PD-L1 expression in TIL (1%) | +ve vs -ve | 33.5 (24.6-42.4) vs 44.1 (28.4-59.8) | 0.105 | ||
| EGFR | +ve vs -ve | 45.4 (NA) vs 33.5 (23.8-43.2) | 0.079 | ||
| KRAS | +ve vs -ve | 14.7 (9.9-19.6) vs 40.2 (32.0-48.4) | 0.981 | ||
*p<0.05.
Abbreviations: AD: adenocarcinoma; CI: confidence interval; EGFR: epidermal growth factor receptor; HR: hazard ratio; KRAS: Kirsten rat sarcoma viral oncogene; NA: not applicable; NSCLC: non-small cell lung cancer; TC: tumor cells; TIL: tumor infiltrating lymphocytes.
+ve and -ve represent positive and negative results.
Discussion
In this study with one hundred twenty-six stage I-IIIA NSCLC samples, we demonstrated the relationship between PD-L1 expression in TC using 5%, 25%, 50% cutoff values and postsurgical survival. We found that PD-L1 negative expression in TC at 25% or 50% cutoff values was the independent predictor for longer postsurgical survival time. We also demonstrated the relationship between PD-L1 expression in TIL at 1% cutoff in patients with TIL and postsurgical survival. PD-L1 negative expression in TC at 25% or 50% cutoff values was found to be the independent predictor for longer postsurgical survival time in these patients.
It has been reported that PD-L1 high expression by IHC has associated with better response to PD-1/PD-L1 blockage, suggesting that PD-L1 expression may serve as a predictive biomarker [3, 4, 6, 7, 11]. In this study, we found that high levels of PD-L1 expression in TC was correlated with a poor prognosis. A meta-analysis with 1,550 NSCLC patients from 9 studies has also revealed that high PD-L1 protein expression was a poor prognostic biomarker for NSCLC [12]. However, some studies draw an inconsistent conclusion [13-16]. Another meta-analysis showed that PD-L1 expression in TC was not correlated with survival in NSCLC patients, but subgroup analysis indicated that PD-L1 high expression was correlated with a poor survival in Asian patients, suggesting that ethnicity difference may contribute partly to the conflicting results [17]. Other possible reasons resulting in the discrepancy may include as follows. 1) The differences in proportion of NSCLC histological types used in the studies. 2) Different PD-L1 antibodies and platforms. 3) Different cut-off values for determining PD-L1 positivity and negativity.
To date, the thresholds for PD-L1 positivity have not been clearly defined. Determination of PD-L1 protein expression levels in FFPE samples has been generally performed by IHC methods with various antibodies using different levels of validation. Different studies using different standards make the comparison between studies difficult and unreasonable. Some studies used 5% proportion of membrane-positive TC as the cutoff value for tumor positivity since this value is reported to be associated with clinical response to anti-PD-1 therapy [4]. In our study using a rabbit anti-human PD-L1 (E1L3N) monoclonal antibody, the relationship between postsurgical survival and PD-L1 positivity in TC identified by three cutoffs (5%, 25% and 50%) was evaluated. At all three cutoffs, PD-L1 positive expression in TC was demonstrated to be correlated with a shorter postsurgical survival time. However, only PD-L1 positive expression in TC at 25% or 50% cutoff values was independent predictors for a shorter postsurgical survival time. The best cutoff value used for defining PD-L1 expression and then selecting appropriate patients for anti-PD-1/PD-L1 therapy need to be systematically studied further.
Most tumor samples in our study were confirmed to concurrent TIL. About half of the samples with TIL showed PD-L1 expression in TIL when 1% cutoff was used for PD-L1 positivity in TIL. Considering there is an interaction between the tumor and tumor immunosuppressive microenvironment, we explored the correlation between PD-L1 expression in TIL and postsurgical survival. Using 1% cutoff as PD-L1 positivity in TIL, we do not observe a significant statistical difference in postsurgical survival of patients with PD-L1 positivity in TIL and patients with PD-L1 negativity in TIL though there was a trend that the postsurgical survival time for patients with PD-L1 negativity in TIL was longer. The relative small sample size or other unknown reasons may attribute to the results. In patients with TIL, the relationship between PD-L1 expression in TC and postsurgical survival was also evaluated. We found that PD-L1 positive expression in TC at 25% or 50% cutoff values was the independent predictor for a shorter postsurgical survival time in these patients.
This study has some limitations. First of all, this is a single-center retrospective study with a relative small sample size and thus the results should be interpreted with caution. Postsurgical treatment was not considered because of the retrospective design and these treatment situations may affect the results. In addition, subgroup analyses in adenocarcinoma and squamous cell carcinoma were not done due to the insufficient cases. Secondly, more patients with male gender and stage IIIA were included in the study. Thirdly, the antibody used for PD-L1 staining in this study was not consistent with previously studies, making the comparison unreasonable to some extent.
In conclusion, PD-L1 negative expression in TC at 25% or 50% cutoff values was the independent predictor for longer postsurgical survival time in both NSCLC samples and NSCLC samples with TIL. For patients with PD-L1 high expression at 25% or 50% cutoff values, PD-L1 blocking may be considered.
Acknowledgements
This project was supported by the National Nature Science Foundation of China (Grant No. 81472175) and Medical Guidance Project of Shanghai Science and Technology Committee (Grant No. 15411961500).
Competing Interests
The authors have declared that no competing interest exists.
References
1. Pardoll DM. The blockade of immune checkpoints in cancer immunotherapy. Nat Rev Cancer. 2012;12:252-64
2. Gatalica Z, Snyder C, Maney T. et al. Programmed cell death 1 (PD-1) and its ligand (PD-L1) in common cancers and their correlation with molecular cancer type. Cancer Epidemiol Biomarkers Prev. 2014;23:2965-70
3. Herbst RS, Soria JC, Kowanetz M. et al. Predictive correlates of response to the anti-PD-L1 antibody MPDL3280A in cancer patients. Nature. 2014;515:563-7
4. Topalian SL, Hodi FS, Brahmer JR. et al. Safety, activity, and immune correlates of anti-PD-1 antibody in cancer. N Engl J Med. 2012;366:2443-54
5. Brahmer JR, Tykodi SS, Chow LQ. et al. Safety and activity of anti-PD-L1 antibody in patients with advanced cancer. N Engl J Med. 2012;366:2455-65
6. Fehrenbacher L, Spira A, Ballinger M. et al. Atezolizumab versus docetaxel for patients with previously treated non-small-cell lung cancer (POPLAR): a multicentre, open-label, phase 2 randomised controlled trial. Lancet. 2016;387:1837-46
7. Rittmeyer A, Barlesi F, Waterkamp D. et al. Atezolizumab versus docetaxel in patients with previously treated non-small-cell lung cancer (OAK): a phase 3, open-label, multicentre randomised controlled trial. Lancet. 2017;389:255-65
8. Brahmer J, Reckamp KL, Baas P. et al. Nivolumab versus docetaxel in advanced squamous-cell non-small-cell lung cancer. N Engl J Med. 2015;373:123-35
9. Borghaei H, Paz-Ares L, Horn L. et al. Nivolumab versus docetaxel in advanced nonsquamous non-small-cell lung cancer. N Engl J Med. 2015;373:1627-39
10. Herbst RS, Baas P, Kim DW. et al. Pembrolizumab versus docetaxel for previously treated, PD-L1-positive, advanced non-small-cell lung cancer (KEYNOTE-010): a randomised controlled trial. Lancet. 2016;387:1540-50
11. Garon EB, Rizvi NA, Hui R. et al. Pembrolizumab for the treatment of non-small-cell lung cancer. N Engl J Med. 2015;372:2018-28
12. Pan ZK, Ye F, Wu X. et al. Clinicopathological and prognostic significance of programmed cell death ligand1 (PD-L1) expression in patients with non-small cell lung cancer: a meta-analysis. J Thorac Dis. 2015;7:462-70
13. Konishi J, Yamazaki K, Azuma M. et al. B7-H1 expression on non-small cell lung cancer cells and its relationship with tumor-infiltrating lymphocytes and their PD-1 expression. Clin Cancer Res. 2004;10:5094-100
14. Boland JM, Kwon ED, Harrington SM. et al. Tumor B7-H1 and B7-H3 expression in squamous cell carcinoma of the lung. Clin Lung Cancer. 2013;14:157-63
15. Chen YB, Mu CY, Huang JA. Clinical significance of programmed death-1 ligand-1 expression in patients with non-small cell lung cancer: a 5-year-follow-up study. Tumori. 2012;98:751-5
16. D'Incecco A, Andreozzi M, Ludovini V. et al. PD-1 and PD-L1 expression in molecularly selected non-small-cell lung cancer patients. Br J Cancer. 2015;112:95-102
17. Xia H, Shen J, Hu F. et al. PD-L1 over-expression is associated with a poor prognosis in Asian non-small cell lung cancer patients. Clin Chim Acta. 2017;469:191-4
Author contact
![]() Corresponding author: Liyan Jiang, Department of Respiratory Medicine, Shanghai Chest Hospital, Shanghai Jiao Tong University, 241# HuaiHai (W.) Rd, Shanghai, 200030, China. Tel: +86 13916146759; Fax: +86 021-32260856; E-mail: Jiang_liyan2000com
Corresponding author: Liyan Jiang, Department of Respiratory Medicine, Shanghai Chest Hospital, Shanghai Jiao Tong University, 241# HuaiHai (W.) Rd, Shanghai, 200030, China. Tel: +86 13916146759; Fax: +86 021-32260856; E-mail: Jiang_liyan2000com