Impact Factor ISSN: 1837-9664

 Global reach, higher impact
J Cancer 2018; 9(1):108-116. doi:10.7150/jca.21925 This issue Cite
Research Paper
Nuclear EGFR and Integrator/Super Elongation Complex concurrently binds to Immediate Early Genes for gene transactivation
Victor Chun-Lam Wong ![]()
OncoSeek Limited, Hong Kong Science and Technology Parks, Hong Kong Special Administrative Region
Received 2017-7-14; Accepted 2017-10-6; Published 2018-1-1
Abstract
The gene transactivation function of nuclear EGFR (nEGFR) has been studied by investigating the genomic co-occupancies of nEGFR and RNA Polymerase II (RNAPII). However, due to RNAPII pausing, the co-recruitment of RNAPII and nEGFR does not necessarily represent productive transactivation. In this study, we integrated gatekeepers of productive transcriptional elongation such as Integrator and Super Elongation Complex (SEC) to interrogate the function of nEGFR. By analyzing publicly available ChIP-seq and RNA-seq data, we aims to 1) explore the function of nEGFR, 2) unravel nEGFR target genes, and 3) discuss potential mechanisms of nEGFR chromatin recruitment. EGF treatment in HeLa cells instigated chromatin recruitment of nEGFR, ERK, RNAPII, Integrator, and SEC in a cluster of 61 EGF-responsive genes. The function of nEGFR was identified as gene-activating rather than gene-repressing. Within the cluster of EGF-responsive genes, nEGFR targeted eleven Immediate Early Genes (IEGs) — JUN, EGR1, JUNB, IER2, KLF2, FOS, FOSL1, RHOB, CCNL1, DUSP2, and DUSP5, which up-regulated >2-fold after EGF stimulation. The promoter of these target genes commonly harbors AT-rich minimal consensus sequences for nEGFR binding. In addition, TCGA data analysis demonstrated positive correlations between EGFR and JUN/FOSL1/RHOB expressions, as well as clinical correlations in specific cancer types. To our knowledge, this is the first study to compare the genome-wide distribution of nEGFR versus Integrator and SEC, providing novel insight into supporting the gene-activating function of nEGFR. We revealed a panel of eleven nEGFR target genes, which concurrently recruited nEGFR, RNAPII, Integrator, and SEC for productive transcriptional elongation.
Keywords: nEGFR, RNAPII, integrator, SEC, transcriptional elongation, gene activation
Introduction
Epidermal growth factor receptor (EGFR) has been under the spotlight in cancer research for decades [1], owing to its frequent aberration and therapeutic significance. EGFR over-expression and alterations are commonly found in various cancers including glioblastoma, lung, breast, and pancreatic cancers. EGFR transduces extrinsic signals to nucleus through tiers of kinases including extracellular signal-regulated kinase (ERK) [1]. Intriguingly, nuclear EGFR (nEGFR) was found to modulate DNA replication, DNA repair, and gene transcription. It promotes DNA replication by phosphorylating and stabilizing PCNA [2] and safeguards genome stability by regulating DNA-PK, ATM, and KAP1[3]. For transcriptional regulation, nEGFR orchestrates the expression of genes such as CCND1, iNOS, Aurora-A, Cox-2, c-Myc, and ABCG2 in various biological models [4]. Clinically, nEGFR expressions are associated with cancer prognosis and therapeutic resistance to cisplatin, radiotherapies, and targeted therapies (e.g. cetuximab, gefitinib) [4].
The gene transactivation regulation of nEGFR has been investigated by comparing the chromatin recruitment between nEGFR and RNAPII after EGF stimulation in HeLa cells [5]. However, because RNAPII pausing happens during the initial phases of elongation, the chromatin recruitment of RNAPII alone is insufficient for productive transcription elongation [6, 7]. Therefore, although nEGFR and RNAPII were found to be co-recruited on the chromatin, it is still elusive about whether the chromatin-bound nEGFR is gene activating or gene-repressing. In order to release RNAPII pause for productive transcription elongation, a “departure-permit” is required; chromatin recruitment of Integrator and Super Elongation Complex (SEC) components is considered to be one of the critical “departure-permit” [8]. Therefore, analyzing the genome-wide distribution of nEGFR together with the RNAPII, Integrator, and SEC is instrumental for understanding the function of chromatin-bound nEGFR. In this study, we integrated collections of ChIP-seq, RNA-seq, and TCGA data publicly available to estimate the function of nEGFR, identify the nEGFR target genes, and exploring the clinical relevance of nEGFR target genes.
Materials and Methods
Data acquisition, sequencing data mapping, and data processing
Collections of dataset were downloaded from Gene Expression Omnibus (GEO) database repository (Table S1). RNA-seq and ChIP-seq data shared the same experimental condition—HeLa cells were treated with EGF (100 ng/ml) for 20 min after 48 hr serum starvation. RNA-seq data was aligned to the human genome hg19 using TopHat. Unmapped reads were filtered out. Transcripts were assembled by Cufflink. Differential expression of transcripts was estimated by Cuffdiff [9]. For ChIP-seq data, bowtie2 was used for mapping the ChIP-seq data to the human genome hg19. Data from repeated experiments were merged for analysis. Unmapped reads were filtered out. High-confidence peaks were called by MACS2, with the following parameters: q-value = 0.05, bandwidth = 300, arbitrary extension = 100 bp.
Function prediction and target gene identification
The activating/repressive function prediction and target gene identification of the chromatin-bound proteins were done by BETA [10]. Peaks within 100kb of gene transcription start site (TSS) were selected for analysis. Genes with significant changing expression (FDR value < 0.1) were considered as differentially expressed genes for BETA analysis. BETA applies distance-weighted approach. It takes the distances between binding sites and TSS for estimating the regulatory potential of the genes, which indicates a gene's likelihood of being activated/repressed by a protein. The regulatory potential and gene expression of each gene were used to estimate rank product for identifying target genes. The rank product can be considered as p-value, according to the original paper [10]. Genes with an RP less than 10-3 were considered as true target genes. The p-values in Figure 3A were estimated by the Kolmogorov-Smirnov test comparing the regulatory potential of three groups of genes (i.e. up-regulated, down-regulated, and background genes) [10].
ChIP-seq and RNA-seq track visualization
The differential binding signals in Figure 2 and 3B and Figure S2 were calculated as fold-change (FC, in log2 scale) relative to untreated cells. Positive binding signal indicates an increase of chromatin bindings after EGF stimulation. The differential binding signals were calculated using DeepTools (bamCompare function) with a bin size of 50bp. The output files are saved in bigwig format for ChIP-seq signal visualization. For RNA-seq, the read alignment BAM files were normalized as reads per kilobase per million (RPKM) and converted to bigwig format with a bin size of 10bp for visualization. All the tracks saved in bigwig files from ChIP-seq and RNA-seq data were visualized in IGB genome browser for Figure S2.
K-means clustering analysis
The normalized differential binding profiles [EGF-treated data normalized to untreated, log2(FC)] of RNAPII, ELL2, AFF4, INTS11, and nEGFR were used for K-means clustering across gene loci, which includes the gene bodies plus additional 5kb from TSS and transcription termination site (TTS). Kmeans clustering was performed using DeepTools (computeMatrix and plotHeatmap function). The parameters for computeMatrix were: regionBodyLength = 500, binSize =10, sortRegions = descending order, sortUsing = mean. The heatmaps and profiles (Figures 2 and 3B) showing the mean density of differential bindings across gene regions were generated by plotHeatmap, with the following parameters: sortRegions = descending order, sortUsing = mean, clustering algorithm = Kmeans clustering, the number of clusters = 4. Subsequently, the assembled clusters were used for plotting Figure S1, with ChIP-seq data of EGF-treated data normalized to the input control and untreated data normalized to the input control.
TCGA RNA-seq and survival data analyses
TCGA RNA expression data (RNA Seq V2 RSEM) and survival data were queried and downloaded via cBioPortal (http://www.cbioportal.org/), followed by data processing in R environment. The cancer types and corresponding sample size for 17 datasets were listed in Table S2. For evaluating the Pearson's correlation coefficient between EGFR and IEG expressions, TCGA RNA-seq data with EGF mRNA expressions above average was subjected to analysis and visualized by ComplexHeatmap package in R. Kaplan-Meier (KM) survival curve analysis and Cox proportional hazards analysis were performed and visualized using survminer and survival package in R. Biopsy samples with mRNA expression of the indicated IEG above average were classified as “High exp” group. The remaining samples were classified as “Low exp” group for statistical comparison. A p-value less than 0.05 was considered as statistically significant while p-value between 0.5 and 0.6 was considered as marginally significant.
Results and Discussion
Experimental model and chromatin-binding peak calling
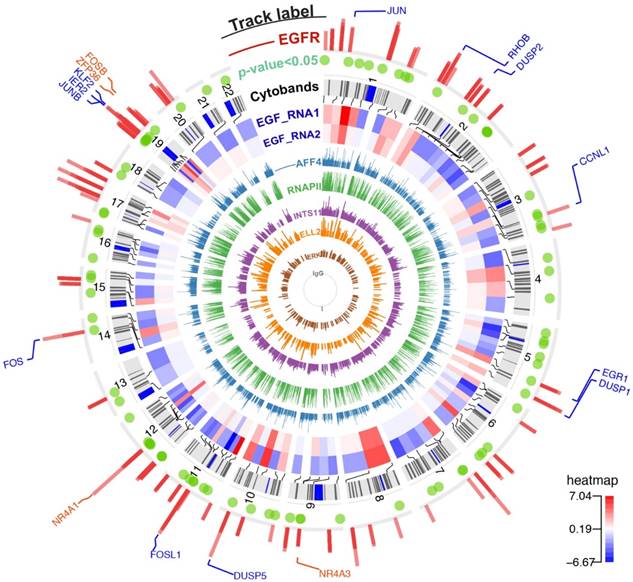
This study analyzed publicly available RNA-seq and ChIP-seq data that shared the same experimental condition — serum-starved HeLa cells treated with 100 ng/ml EGF for 20 min. HeLa cells provide an experimental model to study EGFR in a cancer background. This cell line expresses approximately 300,000 EGFR surface molecules per cell [11] while normal cells express only 40,000 to 100,000 EGFR proteins [12]. Serum-starved HeLa cells were treated with or without EGF for 20 min to study the differential gene expressions and chromatin-binding landscapes of nEGFR, ERK, RNAPII, Integrator (i.e. INTS11), and SEC components (i.e. ELL2 and AFF4). Calling for high confidence binding peak (FDR < 0.05) yielded 489 nEGFR peaks, 1765 ERK peaks, 15996 RNAPII peaks, 18809 AFF4 peaks, 1550 ELL2 peaks, and 4549 INTS11 peaks when comparing EGF-treated cells versus untreated control (Figure 1).
The chromatin-binding peaks across the genome and gene expression profiling after EGF stimulation. From innermost to outermost track: Track 1 to 6 (ChIP-seq tracks named IgG/ERK/ELL2/INTS11/RNAPII/AFF4): bars represent the chromatin binding peaks of IgG, ERK, ELL2, INTS11, RNAPII, and AFF4, respectively. The bar height indicates pileup of read counts. Track 7 and 8 (RNA-seq tracks named EGF_RNA1/EGF_RNA2): a heatmap showing genes with significant changing expressions (FDR < 0.1). These two tracks are biological duplicate and the expressions are shown in Log2(FC) scale. The red color in the heatmap indicates gene up-regulation after EGF stimulation. Track 9 (Cytobands): chromosome cytobands for the human genome hg19. Track 10 (p-value<0.05): green dots represent differentially expressed genes with p value ≤ 0.05. Track 11 (ChIP-seq track named EGFR): bars represent the binding sites for nEGFR. Track 12 (gene labelling): blue labels are nEGFR target genes identified by BETA. Orange labels are genes with a moderate recruitment of nEGFR as inspected by genome browser.
EGF-responsive cluster undergoing productive transcriptional elongation
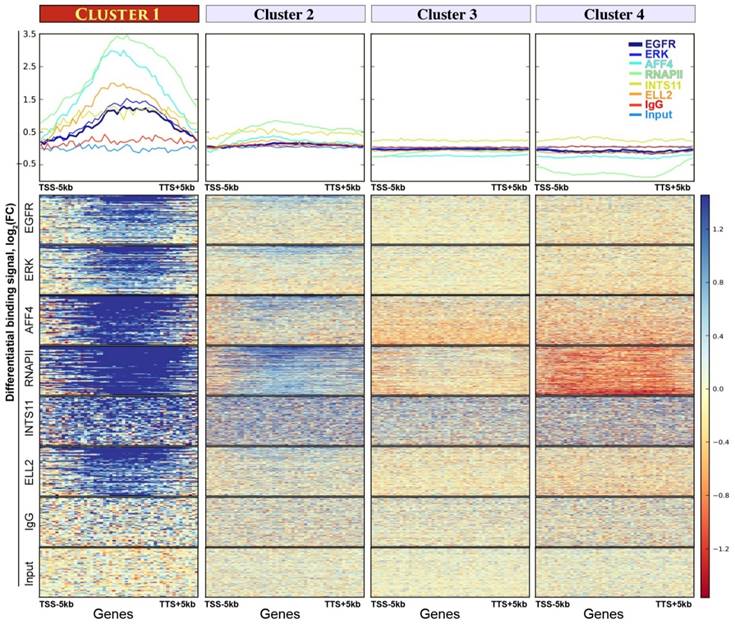
First, we sought to identify an EGF-responsive gene cluster undergoing productive elongation. To do so, we performed an unsupervised K-means clustering analysis, which assigned genes into four clusters according to the differential binding spectrum of nEGFR, RNAPII, Integrator, and SEC. The assembled gene cluster 1 was highly responsive to EGF. It contains a panel of 61 genes (Table S3) acquiring robust and concurrent enrichment of all the analyzed chromatin-binding proteins after EGF induction (Figure 2). Cluster 2 only displayed a flimsy increase of RNAPII recruitment but not for other proteins (Figure 2). No obvious protein recruitment could be found in other gene clusters. Also, no enriched ChIP signals could be seen in IgG and input control. Remarkably, in gene cluster 1, the increase of nEGFR, ERK, RNAPII, Integrator, AFF4, and ELL2 chromatin recruitment was specific to EGF treatment (Figure S1). Genes in this cluster were enriched in gene ontology of transcriptional activator (Table S4), a trait reminiscent of the Immediate Early Genes (IEGs). In short, we identified an EGF-responsive gene cluster comprising 61 genes, which are highly active in recruiting nEGFR, RNAPII, Integrator, and SEC, suggesting a favorable landscape for releasing RNAPII pausing and proceeding productive transcription elongation.
Four gene clusters assembled by K-means unsupervised clustering analysis. Upper panel: the y-axes show average binding profiles for the normalized chromatin-binding signals of nEGFR, ERK, RNAPII, Integrator (i.e. INTS11), and SEC components (i.e. ELL2 and AFF4). The x-axes show gene bodies plus additional 5kb from transcription start site (TSS) and transcription termination site (TTS). The differential chromatin-binding signals are calculated by comparing EGF-treated sample versus untreated [log2(FC) scale]. A positive binding signal indicates an increased chromatin binding of respective protein after EGF stimulation. Bottom panel: heatmaps showing normalized chromatin-binding signals across gene bodies. Blue color indicates an increase of chromatin binding after EGF stimulation.
Chromatin-bound EGFR was gene-activating
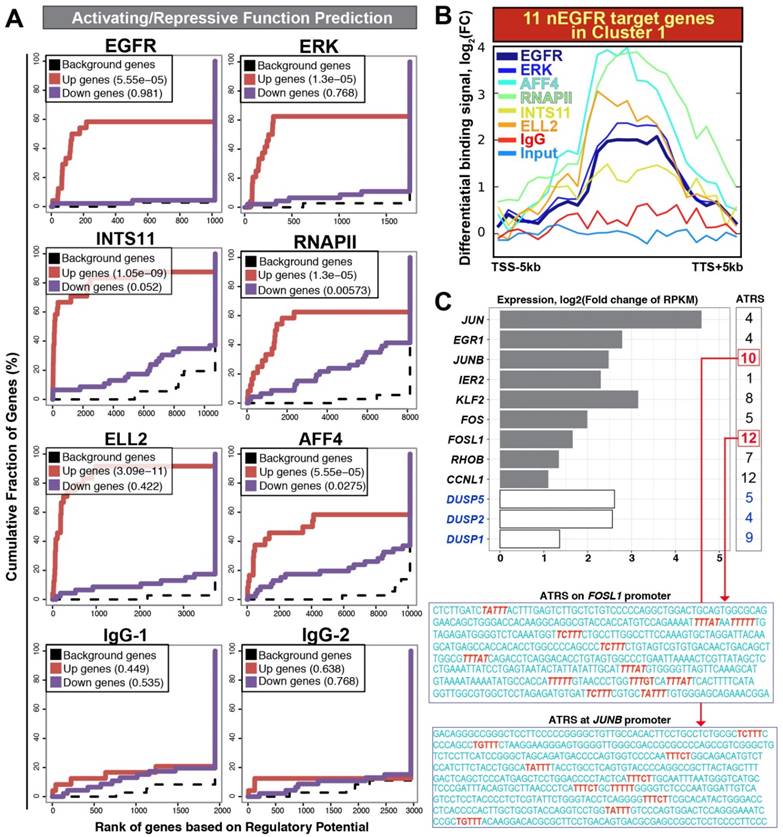
Next, we used a bioinformatics tool called BETA (Binding and Expression Target Analysis) to estimate the functions of chromatin-bound nEGFR (gene-activating or -repressing) and identify nEGFR target genes. By considering the distance between binding peaks and TSS, BETA utilized a distance-weighted method for estimating the impact of chromatin-binding peaks to the genes. BETA has been successfully applied to confirm the gene-regulatory functions of receptor proteins such as androgen receptors and estrogen receptors in LNCaP and MCF-7 cells, respectively [10]. In this study, ChIP-seq and RNA-seq were subjected to BETA analysis. Consistent with ERK, RNAPII, Integrator and SEC, the functional impact of nEGFR was gene-activating rather than gene-repressing (p-value = 0.00005 for nEGFR, Figure 3A and Table S5). As expected, IgG control did not show any statistical significance in gene-activating/repressing function. In line with previous reports [6, 7], RNAPII also bound to the transcriptionally repressed genes (p-value = 0.005, Table S5), indicating that there are other gatekeepers critically regulating the productive transcription elongation beyond RNAPII. Taken together, these findings evidenced that the gene transactivation function of nEGFR upon EGF stimulation.
Activating / repressive function prediction and target gene binding profile. (A) Activating / repressive function prediction: The red line and purple line indicate genes with significant up-regulation and down-regulation (FDR < 0.1), respectively. The dashed line represents background genes with no differential change of expression. The y-axis shows the fraction of genes in each gene categories (i.e. up-regulated genes/ down-regulated genes/ background genes) cumulated by the rank of regulatory potential. The regulatory potential is a gene's likelihood of being activated/repressed by a protein. The p-value shown inside the box (upper left) indicates the significance for the function prediction (B) An average profile showing normalized chromatin binding signals of nEGFR, ERK, RNAPII, INTS11, ELL2, and AFF4 across 11 nEGFR target genes in the cluster 1. The differential binding signals are calculated by comparing EGF-treated sample versus untreated [log2(FC) scale]. (C) Differential gene expressions of nEGFR target genes after EGF stimulation. The number at the right indicates the number of ATRS consensus sequence on the promoter of each gene. The sequences of ATRS (red) located at the FOSL1 and JUNB promoter are illustrated.
Target gene panel of nEGFR
By coupling the ChIP-seq data with RNA-seq data, BETA identified 12 target genes of nEGFR [rank product value (i.e. p-value) < 0.001; Table S6]. These genes were JUN, EGR1, JUNB, IER2, KLF2, FOS, FOSL1, RHOB, CCNL1, DUSP1, DUSP2, DUSP5, which concomitantly recruited nEGFR, RNAPII, integrator, and SEC across the loci (Figure 3B) and up-regulated by more than 2-fold on the mRNA level (Figure 3C). Eleven of them belonged to the aforementioned EGF-responsive gene cluster 1 (Table S6; yellow highlighted) and these genes have been recognized as IEGs previously [13]. IEGs are a module of genes governing instant response to a milieu of extrinsic stimuli such as growth factors, cytokines, and stresses. Gardini et al elegantly demonstrated the importance of Integrator and SEC for productive elongation of genes such as JUN, FOS, CCNL1, NR4A1 [8]. Mikula et al neatly showed the genomic occupancies of nEGFR at EGR1 and FOS genes using ChIP-seq analysis [5]. To our knowledge, there is no study yet analyzing the genomic distribution of nEGFR, RNAPII, Integrator and SEC altogether to identify nEGFR target genes undergoing productive elongation after EGFR induction. By integrating ChIP-seq and RNA-seq data, we identified a panel of 11 nEGFR target genes (i.e. JUN, EGR1, JUNB, IER2, KLF2, FOS, FOSL1, RHOB, CCNL1, DUSP2, DUSP5), which belongs to IEGs and strikingly recruited nEGFR, RNAPII, Integrator, and SEC for gene transactivation and productive elongation upon EGF stimulation.
Potential mechanisms for nEGFR chromatin recruitment
The gene-transactivation function of EGFR has been previously linked to AT-rich minimal consensus sequences (ATRS) for EGFR binding and a proline-rich region on the C-terminal tail of EGFR for promoting transcription [4, 14]. The sequences of ATRS are either TNTTT or TTTNT. They are presented at the promoters of nEGFR target genes such as CCND1, iNOS, Aurora-A, ABCG2 [4]. Herein, we analyzed the promoter of nEGFR target genes identified by BETA. Consistently, all of the promoters harbored the ATRS (Figure 3C and Table S7), suggesting a possible mechanism of EGFR chromatin recruitment. As expected, visualization of ChIP-seq and RNA-seq tracks in genome browser displayed robust nEGFR recruitment accompanied with increased mRNA expressions in the nEGFR targets (Figure S2). Moderate recruitment of nEGFR regulation was also found in other IEGs such as FOSB, N4A1, N4A3, and ZFP36. On contrary, no nEGFR enrichment can be seen in negative control loci such as ZFP36L1, DUSP3, and DUSP8; IgG and input control only displayed random signals in the experiments (Figure S2). These observations indicated high specificity of nEGFR in binding to the identified target panel of eleven IEGs.
In addition to the ATRS consensus sequence for nEGFR binding, the interaction between EGFR and histones might also facilitate nEGFR chromatin recruitment. Mikula et al immune-precipitated RNAPII, EGFR, ERK, MEK in actively cycling HeLa cells for mass spectrometry studies [5]. As shown in Table S8 (data adapted from Mikula et al), EGFR bound to essential transcription players such as RNA polymerase, DNA topoisomerase I, and core Histone proteins (H2A/H2B/H3/H4). Interestingly, EGFR had higher histone-binding proclivity than ERK and MEK (Supporting Information Table S7) and was the only protein capable of binding to Histone H3. The EGF-induced binding between EGFR and Histone H3 can also be seen in an independent proteomic study [15]. In addition, nEGFR has been shown to directly phosphorylate histones [16] and Histone H3 phosphorylation is crucial for inducing IEGs and EGF-induced cancer cell transformation [17]. Taken together, ATRS consensus sequences and Histone interaction appears to be the potential mechanisms of nEGFR chromatin recruitment, which merit further study.
TCGA RNA-seq and survival data analyses
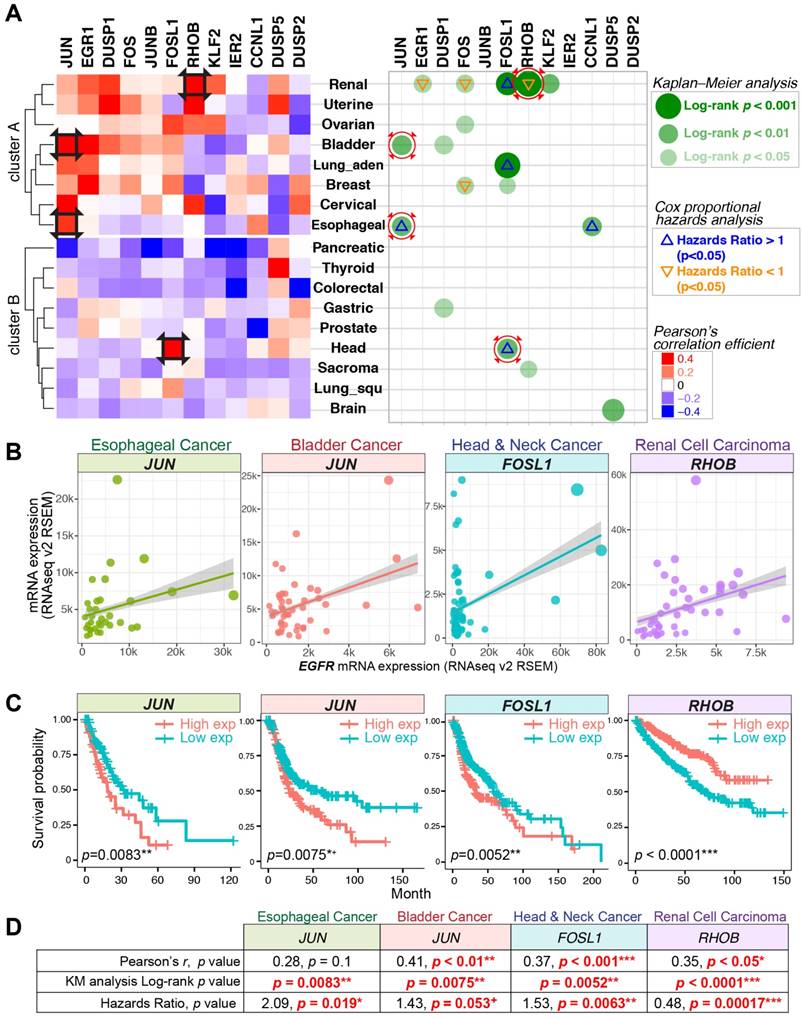
To further support the correlation between EGFR and the identified target genes, we sought to evaluate their mRNA expressions across 17 TCGA datasets (RNA Seq V2 RSEM). TCGA data with EGF level above average was analyzed. The expressions of nEGFR target genes were positively correlated with EGFR in a considerable number of cancer types (cluster A) (Figure 4A left panel). The nEGFR target genes with positive Pearson's correlation coefficient were further evaluated for their clinical relevance and prognostic value by KM curve and Cox regression analyses (Figure 4A right panel). The expressions of JUN, FOSL1, and RHOB exhibited significant and positive correlations with EGFR in bladder, head and neck, and renal cell carcinoma, respectively (Pearson's r = 0.35 - 0.41; p < 0.05). Their expressions were significantly associated with overall survival of patients in KM analysis (log-rank p=0.0001-0.0075) and were identified as independent prognostic markers by multivariate Cox regression analysis. The clinical utilities of these IEG expressions merit further characterization for better prognostic modeling and biomarker development.
Gene expression correlations, Kaplan-Meier (KM) curve, and Cox proportional hazards analyses across 17 TCGA datasets. (A) Left panel: Pearson's correlation coefficient for the expression of nEGFR target genes and EGFR across 17 cancer datasets. Red color indicates a positive correlation between the expression of IEG and EGFR. Right panel: KM and Cox regression analyses for the IEGs having positive Pearson's r. In the analyses, patients with high IEG expression (above average) was compared to those with low IEG expression (below average) for overall survival. Green dots indicate statistical significance (log-rank p < 0.05) in KM analysis. Triangle signs indicate statistical significance (p < 0.05) in multivariate Cox regression analysis (∇: hazards ratio <1, Δ: hazards ratio >1). A hazards ratio >1 indicates a higher risk of death when the IEG expression is higher. Black squares on the heatmap and red circles on the right panel indicate data taken for further visualization in Figure 4B/C/D. (B, C, and D) Gene expression correlation, KM curve, and Cox regression analyses for JUN, FOSL1, and RHOB in esophageal, bladder, head and neck, and renal cell carcinoma. + p = 0.05-0.06 (marginally significant); * p < 0.05; ** p < 0.01; *** p < 0.001.
Signaling computation regulated by nEGFR
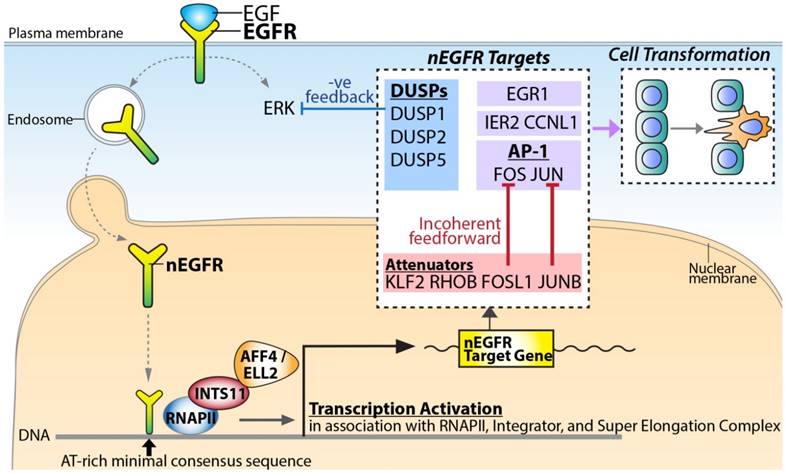
Based on the identified nEGFR target genes, nEGFR orchestrated an intricate computation to fine-tune the signaling response (Figure 5). Upon EGF stimulation, nuclear EGFR activated the most representative and well-characterized IEGs such as FOS, JUN, and EGR1. EGR-1 encodes a zinc finger TF, which regulates cell growth and differentiation in cooperation with p53 [18]. JUN and FOS TFs form a heterodimer TF complex called Activator Protein 1 (AP-1) for cell proliferation and survival in response to extrinsic signals [19]. Paradoxically, nEGFR also conferred incoherent feedforward and negative feedback regulation to attenuate the EGF-induced signaling (Figure 5). For incoherent feedforward signaling, nEGFR targeted AP-1 attenuators such as JUNB, KLF2, RHOB, FOSL1, and ZFP36 [13]. It has been demonstrated that FOSL1 counteracted FOS [20] while JUNB counteracted JUN [21], thereby inhibiting the AP-1 activities. ZFP36 encodes for an RNA-binding protein. It recognizes AU-rich elements on the 3'UTRs of transcripts in cooperation with miRNAs, thereby causing degradation of target mRNAs such as FOS transcripts [13]. For negative feedback signaling, nEGFR targeted DUSPs for up-regulation (i.e. DUSP1/2/5) (Figure 5). DUSPs are known to dephosphorylate ERK [22, 23], which is one of the key downstream effectors of EGF [13, 22]. Collectively, the regulation of this complicated signaling network by nEGFR indicated a pivotal role of nEGFR in governing the signaling circuit for dictating cellular response.
A proposed model for nEGFR target gene transactivation. Upon EGF stimulation, EGFR translocates into the nucleus and binds to chromatin potentially via the AT-rich minimal consensus sequences. In association with RNAPII, Integrator, and Super Elongation Complex, nEGFR functions to activate signaling amplifiers (e.g. FOS, JUN, and EGR1), signaling attenuators (e.g. JUNB and FOSL1) and negative feedback DUSPs (e.g. DUSP1, DUSP2, and DUSP5) for dictating the phenotypic response and cellular transformation.
In summary, the core messages from this work are: 1) upon EGF stimulation, a cluster of 61 genes were highly active in recruiting nEGFR, RNAPII, Integrator, and SEC, indicating a favorable landscape for gene transactivation; 2) ChIP-seq and RNA-seq data analysis supports the gene-activating function of nEGFR; 3) In association with RNAPII, Integrator, and SEC, nEGFR targeted eleven IEGs for productive elongation; 4) the promoter of the nEGFR target genes commonly contains ATRS consensus sequences for EGFR. In conclusion, the significance of this work is to demonstrate the profound and concurrent recruitment of nEGFR, RNAPII, Integrator, and Super Elongation Complex on a panel of eleven IEGs for promoting productive transcription elongation. Further investigation could foster a deeper understanding of the versatile EGFR in the etiology of cancer.
Supplementary Material
Supplementary figures and tables.
Competing Interests
The authors have declared that no competing interest exists.
References
1. Hunter T. Tyrosine phosphorylation: thirty years and counting. Current opinion in cell biology. 2009;21:140-6
2. Wang SC, Nakajima Y, Yu YL, Xia W, Chen CT, Yang CC. et al. Tyrosine phosphorylation controls PCNA function through protein stability. Nature cell biology. 2006;8:1359-68
3. Dittmann K, Mayer C, Fehrenbacher B, Schaller M, Kehlbach R, Rodemann HP. Nuclear epidermal growth factor receptor modulates cellular radio-sensitivity by regulation of chromatin access. Radiotherapy and oncology: journal of the European Society for Therapeutic Radiology and Oncology. 2011;99:317-22
4. Brand TM, Iida M, Li C, Wheeler DL. The nuclear epidermal growth factor receptor signaling network and its role in cancer. Discovery medicine. 2011;12:419-32
5. Mikula M, Skrzypczak M, Goryca K, Paczkowska K, Ledwon JK, Statkiewicz M. et al. Genome-wide co-localization of active EGFR and downstream ERK pathway kinases mirrors mitogen-inducible RNA polymerase 2 genomic occupancy. Nucleic acids research. 2016;44:10150-64
6. Muse GW, Gilchrist DA, Nechaev S, Shah R, Parker JS, Grissom SF. et al. RNA polymerase is poised for activation across the genome. Nature genetics. 2007;39:1507-11
7. Zeitlinger J, Stark A, Kellis M, Hong JW, Nechaev S, Adelman K. et al. RNA polymerase stalling at developmental control genes in the Drosophila melanogaster embryo. Nature genetics. 2007;39:1512-6
8. Gardini A, Baillat D, Cesaroni M, Hu D, Marinis JM, Wagner EJ. et al. Integrator regulates transcriptional initiation and pause release following activation. Molecular cell. 2014;56:128-39
9. Trapnell C, Hendrickson DG, Sauvageau M, Goff L, Rinn JL, Pachter L. Differential analysis of gene regulation at transcript resolution with RNA-seq. Nature biotechnology. 2013;31:46-53
10. Wang S, Sun H, Ma J, Zang C, Wang C, Wang J. et al. Target analysis by integration of transcriptome and ChIP-seq data with BETA. Nature protocols. 2013;8:2502-15
11. Zhang F, Wang S, Yin L, Yang Y, Guan Y, Wang W. et al. Quantification of epidermal growth factor receptor expression level and binding kinetics on cell surfaces by surface plasmon resonance imaging. Analytical chemistry. 2015;87:9960-5
12. Carpenter G, Cohen S. Epidermal growth factor. Annual review of biochemistry. 1979;48:193-216
13. Avraham R, Yarden Y. Feedback regulation of EGFR signalling: decision making by early and delayed loops. Nature reviews Molecular cell biology. 2011;12:104-17
14. Lin SY, Makino K, Xia W, Matin A, Wen Y, Kwong KY. et al. Nuclear localization of EGF receptor and its potential new role as a transcription factor. Nature cell biology. 2001;3:802-8
15. Blagoev B, Kratchmarova I, Ong SE, Nielsen M, Foster LJ, Mann M. A proteomics strategy to elucidate functional protein-protein interactions applied to EGF signaling. Nature biotechnology. 2003;21:315-8
16. Chou RH, Wang YN, Hsieh YH, Li LY, Xia W, Chang WC. et al. EGFR modulates DNA synthesis and repair through Tyr phosphorylation of histone H4. Developmental cell. 2014;30:224-37
17. Choi HS, Choi BY, Cho YY, Mizuno H, Kang BS, Bode AM. et al. Phosphorylation of histone H3 at serine 10 is indispensable for neoplastic cell transformation. Cancer research. 2005;65:5818-27
18. Liu C, Rangnekar VM, Adamson E, Mercola D. Suppression of growth and transformation and induction of apoptosis by EGR-1. Cancer gene therapy. 1998;5:3-28
19. Shaulian E, Karin M. AP-1 as a regulator of cell life and death. Nature cell biology. 2002;4:E131-6
20. Hoffmann E, Thiefes A, Buhrow D, Dittrich-Breiholz O, Schneider H, Resch K. et al. MEK1-dependent delayed expression of Fos-related antigen-1 counteracts c-Fos and p65 NF-kappaB-mediated interleukin-8 transcription in response to cytokines or growth factors. The Journal of biological chemistry. 2005;280:9706-18
21. Szabowski A, Maas-Szabowski N, Andrecht S, Kolbus A, Schorpp-Kistner M, Fusenig NE. et al. c-Jun and JunB antagonistically control cytokine-regulated mesenchymal-epidermal interaction in skin. Cell. 2000;103:745-55
22. Patterson KI, Brummer T, O'Brien PM, Daly RJ. Dual-specificity phosphatases: critical regulators with diverse cellular targets. The Biochemical journal. 2009;418:475-89
23. Wong VC, Chen H, Ko JM, Chan KW, Chan YP, Law S. et al. Tumor suppressor dual-specificity phosphatase 6 (DUSP6) impairs cell invasion and epithelial-mesenchymal transition (EMT)-associated phenotype. International journal of cancer Journal international du cancer. 2012;130:83-95
Author contact
![]() Corresponding author: E-mail: victorcom
Corresponding author: E-mail: victorcom