Impact Factor ISSN: 1837-9664

 Global reach, higher impact
J Cancer 2018; 9(5):834-840. doi:10.7150/jca.23283 This issue Cite
Research Paper
Discrimination between malignant and benign mass-like lesions from breast dynamic contrast enhanced MRI: semi-automatic vs. manual analysis of the signal time-intensity curves
Jiandong Yin1 ![]() , Jiawen Yang1, Zejun Jiang2
, Jiawen Yang1, Zejun Jiang2
1. Department of Radiology, Shengjing Hospital of China Medical University
2. Sino-Dutch Biomedical and Information Engineering School of Northeastern University
Received 2017-10-11; Accepted 2017-12-11; Published 2018-2-12
Abstract
Purpose: To investigate the performance of a new semi-automatic method for analyzing the signal time-intensity curve (TIC) obtained by breast dynamic contrast enhancement (DCE)-MRI.
Methods: In the conventional method, a circular region of interest was drawn manually onto the map reflecting the maximum slope of increase (MSI) to delineate the suspicious lesions. The mean TIC was determined subjectively as one of three different wash-out patterns. In the new method, the lesion area was identified semi-automatically. The mean TIC was categorized quantitatively. In addition to the MSI, other quantitative parameters were calculated, including the signal intensity slope (SIslope), initial percentage of enhancement (Einitial), percentage of peak enhancement (Epeak), early signal enhancement ratio (ESER), and second enhancement percentage (SEP). The performances were compared with receiver operating characteristic (ROC) analysis and Wilcoxon's test.
Results: For TIC categorization results, the diagnostic accuracy rates were 61.54% with the traditional manual method and 76.92% with the new method. For the mean MSI values from the manual method, the accuracy was 63.41%. For the mean TIC derived using the semi-automatic method, the diagnostic accuracy were 82.05% for SIslope, 67.31% for MSI, 61.53% for Einitial, 64.75% for Epeak, 64.74% for ESER, and 52.56% for SEP, respectively. For the lesion regions identified by the semi-automatic method, the diagnostic accuracy for above mentioned parameters were 80.13%, 69.87%, 61.54%, 63.47%, 64.74% and 55.13%, respectively.
Conclusion: With respect to the analysis of TIC from breast DCE-MRI, the results demonstrated that the new method increased the diagnostic accuracy, and should be considered as a supplementary tool for distinguishing benign and malignant lesions.
Keywords: manual method, semi-automatic method, breast lesion, quantitative parameter, time intensity curve
Introduction
BREAST CANCER is now the most common cancer and a leading cause of death in women [1-4]. Traditionally, mammography has been used for the diagnosis of breast cancer but according to two recent reports [5, 6], mammography might miss 20% of the tumors that can be detected easily by MRI. Due to the role of MRI in detecting cancer, the American Cancer Society has proposed guidelines, which suggest that women with a high risk of breast cancer should receive MRI [7]. The traditional MRI protocols for the diagnosis of breast cancer include dynamic contrast enhancement (DCE) with high spatial resolution, which relies on the injection of exogenous contrast agents and dynamic measurements of the T1-weighted signal intensity during the passage of a bolus through the breast. Compared with mammography, the detection rate for smaller size of cancers is improved due to the 3D nature of the examination and the dynamic information analyzed based on the time-intensity curve (TIC) of the signal that corresponds to each voxel. For example, DCE-MRI curves are usually categorized as persistently enhancing (type I), plateau (type II), and washout (type III) according to the TIC shape [8]. This categorization helps to characterize breast lesions as benign or malignant [9]. For most breast DCE-MRI platforms, the analysis of time-dependent curves is usually performed based on a manual method, which will result in several problems [10-21]. For example, the mean TIC obtained using the traditional manual method may exhibit significant volume averaging if viable tumor tissue and necrosis are located in close proximity. In addition, manual method presented excellent sensitivity, but it is limited by low specificity. Hence, a semi-automatic method for the time-intensity curve of DCE-MRI was proposed.
Materials and Methods
The manual method was conducted using FuncTool 9.4.05A (GE Healthcare, Milwaukee, WI, USA) on a commercially available work station. The proposed semi-automatic method was performed using a MATLAB program (version R2010b; The MathWorks, Inc., USA), which was developed in our department. The detailed procedure is described as follows.
DCE-MRI acquisition
This study was approved by our institutional review board (No. 2013PS113K). All of the images used in this study were collected from our existing PACS database.
All of the breast DCE-MR images were acquired with a 3.0-T MRI system (Signa HDxt, GE Healthcare, USA) using a dedicated eight-channel breast coil with patients in the prone position. The dynamic study with bilateral whole breast coverage was performed based on the VIBRANT-VX technique with the following parameters: TR = 7.42 ms, TE = 4.25 ms, inversion time = 20 ms, echo train length = 1, slice thickness = 2.2 mm, spacing between slices = 2.2 mm, flip angle = 15°, image size = 1024×1024, pixel spacing = 0.3516 mm, acquisition type = 3D, and slice number = 78. In total, nine images were acquired: one for pre-contrast and the other eight for post-contrast. Intravenous administration of contrast agent (0.5 mmol/ml; Gadodiamide, Omniscan, GE Healthcare; Magnevist, Bayer-Shering Pharmaceuticals) was performed at a dose of 0.15 mmol per kilogram bodyweight. The bolus was injected with a power injector at a rate of 4 ml/s, followed by an equal volume of saline flush at the same flow speed. All DCE-MRI images were obtained without fat suppression and at a temporal resolution of 80 s between two adjacent images.
In this study, all of the breast DCE-MR images acquired between January 2010 and August 2014 were assessed retrospectively Some of the patients were referred for multiple DCE-MRI examinations before and after chemotherapeutic or surgical treatment, but all of the images selected for this study were acquired before therapeutic treatment (for diagnostic purposes). All of the selected lesions were mass-like and they were single lesions (lesions in either the left or right breast). Moreover, each lesion was verified as benign or malignant by biopsy or pathology, and the time interval between MRI and histopathological examination was < 5 days. Thus, 156 cases (71 benign cases and 85 malignant cases; aged, 23-71 years; average age, 49.5 years;) with single mass-like lesions were selected. The final diagnoses of these breast lesions were confirmed by pathology or biopsy, as shown in Table 1.
Detailed histopathological diagnoses for all the malignant (n = 85) and benign (n = 71) breast lesions.
| Malignant | n | % |
|---|---|---|
| 85 | 54.49 | |
| Invasive ductal carcinoma | 71 | 45.51 |
| Invasive lobular carcinoma | 3 | 1.92 |
| Ductal carcinoma in situ | 4 | 2.56 |
| Phylloid carcinoma | 5 | 3.21 |
| Papillary carcinoma | 2 | 1.28 |
| Benign | n | % |
| 71 | 45.51 | |
| High risk (complex sclerosing lesion, FEA, CCC with focal atypia) | 5 | 3.21 |
| Fibroadenoma, fibroadenomatous hyperplasia | 33 | 21.15 |
| Papilloma | 4 | 2.56 |
| DH, CCC, FCC, focal fibrosis, nodular sclerosing adenosis | 16 | 10.26 |
| Miscellaneous (chronic abscess, gynecomastia, fat necrosis, pseudoangiomatosis) | 13 | 8.33 |
FEA = flat epithelial atypia, CCC = columnar cell changes, DH = ductal hyperplasia, FCC = fibrocystic changes.
Proposed method for TIC analysis
Semi-automatic segmentation of breast lesions. The method for the semi-automatic extraction of breast lesions mainly involved the following steps.
First, a ROI of arbitrary shape was drawn around the lesion;
Second, Ostu's algorithm was applied to the data from ROI [22], based on which pixels were divided into two parts, i.e. background and foreground;
Third, morphological erosion was applied to the binary image obtained above, and the size of structure element was 4 × 4;
Fourth, the post-eroded image was traversed to obtain the unique but largest eight-connected region;
Finally, morphological dilation was applied to the unique region with a structure element of the same size. And the final region was considered as the target area corresponding to the lesion.
Automatic analysis of the signal TIC. The following content was calculated automatically.
First, the TICs from the target region were averaged. Next, based on the following formula, the mean curve was categorized as one of the three types quantitatively, i.e., progressive (type I) where the signal intensity continued to increase over time, plateau (type II) where the signal intensity did not change over time after its initial increase during the delayed phase, and washout (type III) enhancement kinetics where the signal intensity decreased after reaching the highest point of its initial increase during the delayed phase [9, 23, 24].
[1]
where SImean is the mean value between the first two post-contrast time points (at the time point of 120 s), and SItail is the signal intensity at the last time point. The mean curve was designated as: type I when SIslope was +10% or greater, type II when SIslope was between -10% and +10%, and type III when SIslope was -10% or less. In addition, we obtained the SIslope parameter for each pixel and the corresponding parametric map.
The following quantitative parameters were also derived from the mean curve.
1) Maximum slope of increase:
[2]
where SIi and SIi+1 denote the signal intensity of the former and latter phases, respectively, and i ranges from 0 to 7.
2) Initial percentage of enhancement (Einitial):
[3]
where SI1 and SI0 represent the signal intensities of the first post-contrast image and the pre-contrast image, respectively [25].
3) Percentage of peak enhancement (Epeak)
[4]
where SIpeak represents the peak value of the contrast enhancement [25].
4) Early signal enhancement ratio (ESER):
[5]
where SI2 represents the intensity at the second post-contrast time point [26].
5) Second enhancement percentage (SEP) [28]
[6]
Furthermore, above parameters were also calculated for the target region on a pixel-by-pixel basis and the corresponding parametric map was color-coded. The mean value was obtained for each kind of parameter.
Conventional method for TIC analysis
In this study, the conventional kinetic curve analysis for breast DCE-MRI was performed using the dedicated software. A high-experienced reader was blinded to the patients' clinical information. First, a circular ROI was placed manually onto the MSI map to cover the area of the suspicious lesion. Next, the TICs from the selected region were averaged automatically. Based on visual observations with the naked eye, the mean curve was categorized as persistently enhancing (type I), plateau (type II), and washout (type III) [8, 28-30]. The mean MSI value in the manually drawn region was determined automatically.
Statistical analysis
Receiver operating characteristic (ROC) curves are used to determine the diagnostic ability of the proposed method for semi-automatic analysis of DCE-MRI. It is created by plotting the true positive rate (TPR) (sensitivity, y-axis) against the false positive rate (FPR) (1-specificity, x-axis) at various threshold settings. ROC analysis will find a optimal cutoff value that will maximize the sensitivity and specificity, or minimize the false positives and false negatives. In fact, the choice for the best cutoff value is that value which corresponds to a point on the ROC curve nearest to the upper left corner of the ROC graph. ROC was drawn for each kind of quantitative parameters with the statistical software MedCalc (version 14.10.20, http://www.medcalc.org/). The area under the curve (AUC), considered as an index of diagnostic performance, was calculated as well as the optimal cut-off value, based on which specificity, sensitivity, and accuracy were respectively obtained.
According to previous similar study, malignancy was defined as a washout or plateau curve (type II and III) [31]. The specificity, sensitivity, and accuracy were again determined for both manual and semi-automatic methods. The paired-samples Wilcoxon's test was performed to compare the manual method and the proposed method for TIC categorization. P < 0.05 was considered significant. The statistical analyses were performed using SPSS (version 16.0).
Results
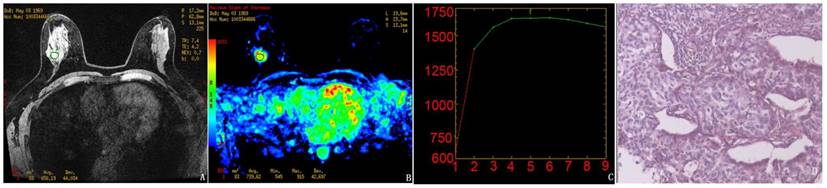
First, a randomly selected subject (aged 43 years) was used to illustrate the results obtained with the manual method (Fig. 1), as well as the semi-automatic segmentation of lesions (Fig. 2) and the quantitative analysis (Fig. 3).
Results obtained using the manual method for the randomly selected subject. A-C, The pre-contrast image, MSI map, and the mean curve of the TICs from the manually drawn ROI, respectively. The mean MSI value was 739.6. D, Pathological results demonstrating infiltrating ductal carcinoma (IDC).
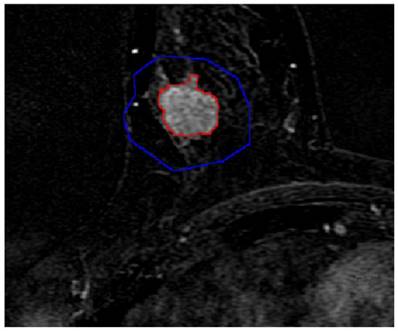
Semi-automatic segmentation result of the breast lesion based on the proposed method for the randomly selected case (the colors were set to red for the lesion margin and blue for the ROI margin). In order to facilitate the observation, this image partially enlarged.
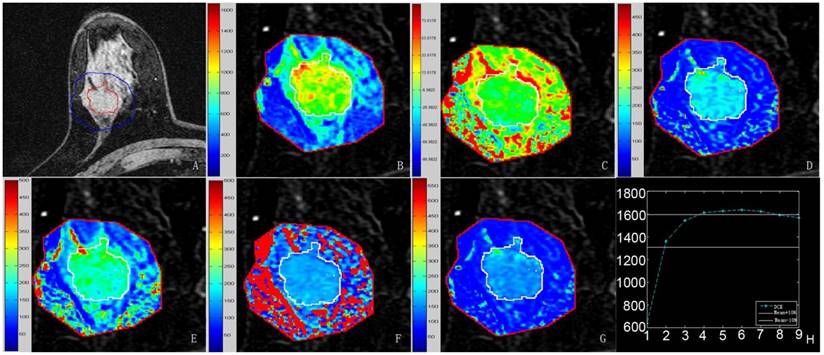
Quantitative results obtained using the semi-automatic method proposed in this study. A-G, Pre-contrast image covered by the lesion margin, MSI map, SIslope map, Einitial map, Epeak map, ESER map, and SEP map, respectively. Each image was magnified partially. The mean values were 1090.5 for MSI, 10.2 for SIslope, 115.1 for Einitial, 177.8 for Epeak, 79.4 for ESER, and 145.7 for SEP. H, Mean curve of the TICs from the target region, where the same parameters defined above for this curve were 715.3, 8.5, 112.9, 157.3, 79.5, and 142.0, respectively.
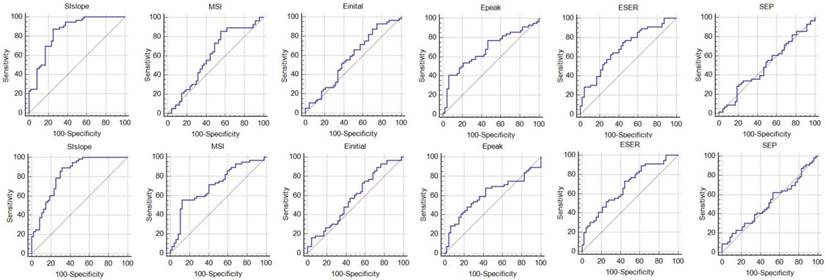
For the quantitative parameters, the statistical results for the semi-automatic analysis are shown in Fig. 4, and Tables 2 and 3, while the results obtained using the conventional manual method are shown in Fig. 5. The TIC categorization results are shown in Table 4. The statistical results demonstrate that there were significant differences in the TIC categorization results obtained using the manual method and the semi-automatic method (Z = -4.714 and P < 0.05).
Results of the ROC analysis. The first row shows the results for the mean curve and the second row presents the results for the region determined using the proposed method.
Results for the mean curve obtained using the semi-automatic method.
| SIslope | MSI | Einital | Epeak | ESER | SEP | |
|---|---|---|---|---|---|---|
| AUC | 0.85 | 0.60 | 0.57 | 0.68 | 0.69 | 0.50 |
| 95% CI | (0.76,0.91) | (0.50,0.69) | (0.47,0.67) | (0.58,0.77) | (0.60,0.78) | (0.40,0.60) |
| Optimal cutoff | 8.9 | 695.6 | 101.4 | 202.1 | 77.8 | 163.5 |
| Sensitivity | 88.2% | 85.9% | 91.8% | 41.2% | 62.4% | 29.4% |
| Specificity | 74.7% | 45.1% | 25.4% | 93.0% | 67.6% | 80.3% |
| Accuracy | 82.1% | 67.3% | 61.5% | 64.8% | 64.7% | 52.6% |
Results for the target region determined using the semi-automatic method.
| SIslope | MSI | Einital | Epeak | ESER | SEP | |
|---|---|---|---|---|---|---|
| AUC | 0.83 | 0.70 | 0.58 | 0.61 | 0.68 | 0.52 |
| 95% CI | (0.74,0.90) | (0.61,0.79) | (0.48,0.68) | (0.51,0.71) | (0.58,0.77) | (0.42,0.62) |
| Optimal cutoff | 15.1 | 1295.0 | 112.8 | 297.3 | 74.0 | 202.0 |
| Sensitivity | 89.4% | 55.3% | 89.4% | 68.2% | 72.9% | 62.4% |
| Specificity | 69.0% | 87.3% | 28.2% | 57.8% | 54.9% | 46.5% |
| Accuracy | 80.1% | 69.9% | 61.5% | 63.5% | 64.7% | 55.1% |
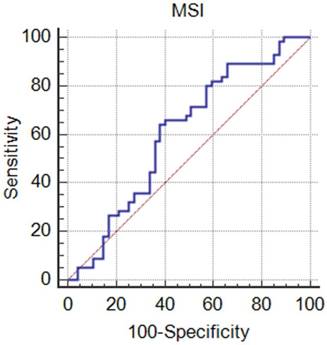
Results of the ROC analysis of the mean MSI value obtained by the manual method, where the values are 0.60 for AUC, (0.50, 0.70) for 95% CI, 884.4 for optimal cutoff value, 64.7% for sensitivity, 62.0% for specificity, and 63.4% for accuracy.
Comparison of the TIC categorization results obtained using the conventional manual method and semi-automatic method.
| Manual method | Semi-automatic method | |
|---|---|---|
| Sensitivity | 85.9% | 82.3% |
| Specificity | 32.4% | 70.4% |
| Accuracy | 61.5% | 76.9% |
Discussion
Based on the results of the present study, we found that the proposed method obtained higher diagnostic performance than the conventional method according to some measures. The categorization of the mean TIC showed that the sensitivity of the proposed method was slightly lower than that of the conventional manual method, but the specificity was increased significantly, thereby leading to relatively higher accuracy in the diagnosis of breast DCE-MRI. The difference between the new and traditional methods was significant. The diagnostic performance was very low in terms of the quantitative parameter derived from the manual method (MSI) and the diagnostic efficacy could not be improved at all. Based on the quantitative analysis of the mean curve obtained by the semi-automatic method, SIslope had the highest accuracy, while both the sensitivity and specificity were higher than those obtained from the analysis of TIC categorization based on qualitative and quantitative approaches. Epeak and Einitial had the highest specificity and sensitivity, respectively. According to the quantitative analysis of the target region derived from semi-automatic method, SIslope also had the highest accuracy in breast DCE-MRI interpretation, but its specificity was less desirable. Compared with the other parameters, MSI and Einitial had higher specificity and sensitivity, respectively.
Over the past years, lots of studies on CAD of breast DCE-MRI were conducted to better differentiate the benign from malignant lesions [9, 32-40]. A computerized detection scheme to calculate a global contrast enhanced feature was developed by Yang et al., and the diagnostic sensitivity reached 91.3%, however the specificity was only 66.0% [35]. A semi-automatic lesion segmentation based on a supervised learning formulation was reported by Levman J et al. [33], and the AUC reflecting the diagnostic performance was improved from 0.75 to 0.79 compared with that from traditional enhancement threshold method. In the papers reported by El Khouli RH et al. and Newell D et al. [9, 40], some parameters reflecting the hemodynamic information were measured for the distinction between benign and malignant lesions, and the hemodynamic methods presented higher performance relative to conventional kinetic curve analysis. In a highly innovative paper [37], both morphological feature and kinetic curve were analyzed quantitatively, and a so-called morph-dynamic index (MDI) was proposed. Using the MDI cutoff value of 50%, the sensitivity was 96.5% combined with specificity of 75.5%. Compared with the above previous reports, the method proposed in this paper provided more kinds of quantitative parameters reflecting the enhancement information of breast lesions, and the maximum AUC (0.85) in combination with sensitivity of 88.2% and specificity of 74.7% was obtained based on SIslope derived from the mean curve. And the corresponding accuracy reached 82.1%. Thus, it is considered that this novel method could play an important role in differentiating benign and malignant breast lesions, as well as the subsequent treatment plan. Moreover, previous study considered that the lesion was likely to be benign if the slope of the mean TIC was larger than +10% [23]. However, we found that we could obtain more accurate results by setting the slope value to +8.9%, based on which the specificity of breast DCE-MRI interpretation was improved. We think it was an interesting discovery.
This study had several deficiencies. First, the number of cases incorporated into this study was relatively small. Second, only TIC from breast DCE-MRI was analyzed semi-automatically, and lesion morphology was not considered as an analysis target. In fact, some previous studies have suggested that the TIC pattern should be analyzed after evaluating the morphology of lesions. We believe the diagnostic performance would be improved if the morphology of lesions and the parameters derived from the TICs were combined. Third, breast DCE-MRI analysis should be performed with volume image (3D), but in our study only two-dimensional images (2D) was used.
Conclusions
In conclusion, the semi-automatic method proposed in this study utilized the data offered by a DCE-MRI examination more adequately by calculating multiple quantitative parameters. The proposed method can replace the completely manual and subjective method, thereby facilitating the standardization of breast DCE-MRI interpretation.
Compliance with Ethical Standards
Funding
This work was financially supported by Startup Foundation for Doctors of Liaoning Province (No. 201601118).
Ethical approval
All procedures in the current study were in accordance with the ethical standards of the Institutional Research Committee and with the 1964 Helsinki declaration and its later amendments. The requirement for informed content was waived because this was a retrospective study.
Conflict of Interest
The authors claim no conflict of interest.
References
1. Hong W, Dong E. The past, present and future of breast cancer research in China. Cancer Lett. 2014;351(1):1-5
2. Chen X, Sun L, Cong Y. et al. Baseline staging tests based on molecular subtype is necessary for newly diagnosed breast cancer. J Exp Clin Cancer Res. 2014;33:28
3. Yang Y, Zhang Y, Wu Q. et al. Clinical implications of high NQO1 expression in breast cancers. J Exp Clin Cancer Res. 2014;33:14
4. Lin Y, Wang C, Zhong Y. et al. Striking life events associated with primary breast cancer susceptibility in women: a meta-analysis study. J Exp Clin Cancer Res. 2013;32(1):53
5. Lehman CD, Gatsonis C, Kuhl CK. et al. MRI evaluation of the contralateral breast in women with recently diagnosed breast cancer. N Engl J Med. 2007;356(13):1295-303
6. N. Shute. Beyond Mammograms: research to improve breast cancer screening focuses on sound, light, breath and tissue elasticity. Scientific American. 2011;304:32-34
7. Saslow D, Boetes C, Burke W. et al. American Cancer Society guidelines for breast screening with MRI as an adjunct to mammography. CA Cancer J Clin. 2007;57(2):75-89
8. Kuhl CK, Mielcareck P, Klaschik S. et al. Dynamic breast MR imaging: are signal intensity time course data useful for differential diagnosis of enhancing lesions? Radiology. 1999;211(1):101-10
9. El Khouli RH, Macura KJ, Kamel IR, Jacobs MA, Bluemke DA. 3-T dynamic contrast-enhanced MRI of the breast: pharmacokinetic parameters versus conventional kinetic curve analysis. AJR Am J Roentgenol. 2011;197(6):1498-505
10. Kinkel K, Helbich TH, Esserman LJ. et al. Dynamic high-spatial-resolution MR imaging of suspicious breast lesions: diagnostic criteria and interobserver variability. AJR Am J Roentgenol. 2000;175(1):35-43
11. Stoutjesdijk MJ, Fütterer JJ, Boetes C, van Die LE, Jager G, Barentsz JO. Variability in the description of morphologic and contrast enhancement characteristics of breast lesions on magnetic resonance imaging. Invest Radiol. 2005;40(6):355-62
12. Vomweg TW, Teifke A, Schreiber WG, Schmidt M, Thelen M. Combination of low and high resolution T1-weighted sequences for improved evaluation of morphologic criteria in dynamic contrast enhanced MRI of the breast. Rofo. 2002;174(11):1445-9
13. Furman-Haran E, Grobgeld D, Kelcz F, Degani H. Critical role of spatial resolution in dynamic contrast-enhanced breast MRI. J Magn Reson Imaging. 2001;13(6):862-7
14. Holland AE, Hendrick RE, Jin H, Russ PD, Barentsz JO, Holland R. Correlation of high-resolution breast MR imaging with histopathology; validation of a technique. J Magn Reson Imaging. 2000;11(6):601-6
15. Pediconi F, Miglio E, Telesca M. et al. Effect of preoperative breast magnetic resonance imaging on surgical decision making and cancer recurrence rates. Invest Radiol. 2012;47(2):128-35
16. Morris EA. Diagnostic breast MR imaging: current status and future directions. Magn Reson Imaging Clin N Am. 2010;18(1):57-74
17. Kuhl CK. Breast MR imaging at 3T. Magn Reson Imaging Clin N Am. 2007;15(3):315-20
18. Sardanelli F, Boetes C, Borisch B. et al. Magnetic resonance imaging of the breast: recommendations from the EUSOMA working group. Eur J Cancer. 2010;46(8):1296-316
19. Bluemke DA, Gatsonis CA, Chen MH. et al. Magnetic resonance imaging of the breast prior to biopsy. JAMA. 2004;292(22):2735-42
20. Huang W. et al. Detection of breast malignancy: diagnostic MR protocol for improved specificity. Radiology. 2004;232:585-91
21. Pang Y, Li L, Hu W, Peng Y, Liu L, Shao Y. Computerized segmentation and characterization of breast lesions in dynamic contrast-enhanced MR images using fuzzy c-means clustering and snake algorithm. Comput Math Methods Med. 2012;2012:634907
22. Nobuyuki Otsu. A threshold selection method from gray-level histograms. IEEE T SYST MAN CY-S. 1979;9(1):62-66
23. Abramson RG, Li X, Hoyt TL. et al. Early assessment of breast cancer response to neoadjuvant chemotherapy by semi-quantitative analysis of high-temporal resolution DCE-MRI: preliminary results. Magn Reson Imaging. 2013;31(9):1457-64
24. Montemurro F, Martincich L, Sarotto I. et al. Relationship between DCE-MRI morphological and functional features and histopathological characteristics of breast cancer. Eur Radiol. 2007;17(6):1490-7
25. Kim JY, Kim SH, Kim YJ. et al. Enhancement parameters on dynamic contrast enhanced breast MRI: do they correlate with prognostic factors and subtypes of breast cancers? Magn Reson Imaging. 2015;33(1):72-80
26. Li X, Arlinghaus LR, Ayers GD. et al. DCE-MRI analysis methods for predicting the response of breast cancer to neoadjuvant chemotherapy: pilot study findings. Magn Reson Med. 2014;71(4):1592-602
27. Jansen SA, Lin VC, Giger ML, Li H, Karczmar GS, Newstead GM. Normal parenchymal enhancement patterns in women undergoing MR screening of the breast. Eur Radiol. 2011;21(7):1374-82
28. Pinker K, Bogner W, Baltzer P. et al. Improved diagnostic accuracy with multiparametric magnetic resonance imaging of the breast using dynamic contrast-enhanced magnetic resonance imaging, diffusion-weighted imaging, and 3-dimensional proton magnetic resonance spectroscopic imaging. Invest Radiol. 2014;49(6):421-30
29. Yabuuchi H, Matsuo Y, Okafuji T. et al. Enhanced mass on contrast-enhanced breast MR imaging: Lesion characterization using combination of dynamic contrast-enhanced and diffusion-weighted MR images. J Magn Reson Imaging. 2008;28(5):1157-65
30. Mayrhofer RM, Ng HP, Putti TC, Kuchel PW. Magnetic resonance in the detection of breast cancers of different histological types. Magn Reson Insights. 2013;6:33-49
31. El Khouli RH, Macura KJ, Jacobs MA. et al. Dynamic contrast-enhanced MRI of the breast: quantitative method for kinetic curve type assessment. AJR Am J Roentgenol. 2009;193(4):W295-300
32. Yang Q, Li L, Zhang J, Shao G, Zheng B. A computerized global MR image feature analysis scheme to assist diagnosis of breast cancer: a preliminary assessment. Eur J Radiol. 2014;83(7):1086-91
33. Levman J, Warner E, Causer P, Martel A. Semi-automatic region-of-interest segmentation based computer-aided diagnosis of mass lesions from dynamic contrast-enhanced magnetic resonance imaging based breast cancer screening. J Digit Imaging. 2014;27(5):670-8
34. Baltzer PA, Renz DM, Kullnig PE, Gajda M, Camara O, Kaiser WA. Application of computer-aided diagnosis (CAD) in MR-mammography (MRM): do we really need whole lesion time curve distribution analysis? Acad Radiol. 2009;16(4):435-42
35. Williams TC, DeMartini WB, Partridge SC, Peacock S, Lehman CD. Breast MR imaging: computer-aided evaluation program for discriminating benign from malignant lesions. Radiology. 2007;244(1):94-103
36. Renz DM, Durmus T, Böttcher J. et al. Comparison of gadoteric acid and gadobutrol for detection as well as morphologic and dynamic characterization of lesions on breast dynamic contrast-enhanced magnetic resonance imaging. Invest Radiol. 2014;49(7):474-84
37. Renz DM, Böttcher J, Diekmann F. et al. Detection and classification of contrast-enhancing masses by a fully automatic computer-assisted diagnosis system for breast MRI. J Magn Reson Imaging. 2012;35(5):1077-88
38. Renz DM, Diekmann F, Schmitzberger FF. et al. Pharmacokinetic approach for dynamic breast MRI to indicate signal intensity time curves of benign and malignant lesions by using the tumor flow residence time. Invest Radiol. 2013;48(2):69-78
39. Böttcher J, Renz DM, Zahm DM. et al. Response to neoadjuvant treatment of invasive ductal breast carcinomas including outcome evaluation: MRI analysis by an automatic CAD system in comparison to visual evaluation. Acta Oncol. 2014;53(6):759-68
40. Newell D, Nie K, Chen JH. et al. Selection of diagnostic features on breast MRI to differentiate between malignant and benign lesions using computer-aided diagnosis: differences in lesions presenting as mass and non-mass-like enhancement. Eur Radiol. 2010;20(4):771-81
Author contact
![]() Corresponding author: Jiandong Yin, Department of Radiology, Shengjing Hospital of China Medical University, Shenyang, P.R. China, Tel: +86 18940254851, Email: jiandongyincom
Corresponding author: Jiandong Yin, Department of Radiology, Shengjing Hospital of China Medical University, Shenyang, P.R. China, Tel: +86 18940254851, Email: jiandongyincom