Impact Factor ISSN: 1837-9664

 Global reach, higher impact
J Cancer 2018; 9(5):906-913. doi:10.7150/jca.22014 This issue Cite
Research Paper
Alteration of Serum IgG Galactosylation as a Potential Biomarker for Diagnosis of Neuroblastoma
Wenjun Qin1*, Hao Pei2*, Ruihuan Qin1, Ran Zhao3, Jing Han1, Zejian Zhang1, Kuiran Dong4 ![]() , Shifang Ren1
, Shifang Ren1 ![]() , Jianxin Gu1
, Jianxin Gu1
1. Key Laboratory of Glycoconjugate Research Ministry of Public Health, Department of Biochemistry and Molecular Biology, School of Basic Medical Sciences, Fudan University, Shanghai 200032, China
2. Department of Anesthesiology, Children's Hospital, Fudan University, Shanghai 201102, China
3. Obstetrics and Gynecology Hospital, Fudan University, Shanghai 200090, China
4. Department of Oncology, Children's Hospital, Fudan University, Shanghai 201102, China
*These authors contributed equally to this work.
Received 2017-7-20; Accepted 2018-2-6; Published 2018-2-25
Abstract
Background: Neuroblastoma (NB) is the most frequent pediatric malignant neoplasm that originates from embryonic neural crest cells. Urinary catecholamines in 24-h urine are most commonly analyzed for the diagnosis of neuroblastoma at good sensitivity; however, it is challenging to collect 24-h urine samples in a pediatric population. Therefore, development of more rapid, non-invasive and cost-effective tools for the diagnosis of NB remains needed. Serum immunoglobulin G (IgG) galactosylation have been found highly associated with adult cancers in our previous study.
Methods: To explore the potential use of serum IgG galactosylation in aiding diagnosis of neuroblastoma, serum IgG galactosylation profiles of 26 neuroblastoma cases and 30 age-matched non-malignant controls were analyzed by MALDI MS. The alteration of IgG galactosylation in neuroblastoma patients was measured by a Gal-ratio formula: G0/(G1+G2×2), calculating the relative intensities of agalactosylated N-glycan (G0) vs mono-galactosyl N-glycan (G1) and digalactosyl N-glycan (G2).
Results: The results showed that IgG Gal-ratios were significantly higher in neuroblastoma cases compared with non-malignant controls (p=5.0×10⁻⁴). And the Gal-ratio data generated sensitivity and specificity of 84.62% and 60.00%, combined with an AUC (area under the curve) of 0.80.
Conclusions: The analysis of serum IgG galactosylation distribution may play a suggestive role for neuroblastoma diagnosis, or serve as a potential biomarker for NB diagnosis.
Keywords: IgG, Galactosylation, Neuroblastoma, Biomarker, Diagnosis
Introduction
Neuroblastoma is the most common extracranial childhood solid tumor which derives from embryonic neural crest cells1. It accounts for 7-10% of all pediatric malignancies, and it is responsible for about 15 % of malignant neoplasm deaths in patients under 15 years old2. Neuroblastoma belongs to a family of peripheral neuroblastic tumors, which are histologically classified as ganglioneuroma (GN), ganglioneuroblastoma (GNB) and neuroblastoma (NB) on the basis of the differentiated degree of neuroblastic cells and the content of Schwannian cells3,4. Nevertheless, ganglioneuroblastoma (GNB) and neuroblastoma (NB) have different malignant potential4. Owing to the lack of obvious clinical symptoms in the early stage and the occult occurrence, about 48% of the patients are metastatic at the time of their first definite diagnosis and 60-80% of the patients are at the highest stage IV5,6. What is more, patients who have similar clinical parameters often present with different outcomes6. With the development of the risk classification system introduced by International Neuroblastoma Risk Group (INRG)7, risk-assigned therapies have been delivered to neuroblastoma patients8. In this way, the prognosis of infant and early stage neuroblastoma has been significantly improved, but the prognosis of older children and high stage neuroblastoma is still poor. Moreover, the risk classification system is limited to use in routine clinical practice due to complex genetic methods. Accordingly, detection of the patients with neuroblastoma at earlier stage may improve the outcome, especially for those older children. Currently, urinary catecholamines, such as Vanillylmandelic acid (VMA) in 24-h urine, have been commonly used in clinical diagnosis and for early detection in screening programs in NB9. However, it has difficulty in collecting 24-h urine samples in a pediatric population. Therefore, development of serology biomarker requiring simple sampling for the diagnosis of NB remains needed, assisting in current neuroblastoma diagnosis.
It has been reported that protein glycosylation is one of the most common post-translation protein modification, and the deregulation of glycosylation is associated with numerous human diseases including several human carcinomas10-12. The studies about quantitative serum glycan profiling as a prognostic or diagnostic biomarker in human cancers have become commonly in recent years13,14. Immunoglobin G (IgG) is one of the most abundant glycoproteins in serum, and the aberrant glycosylation of IgG is known to be associated with several diseases15. Several studies have reported the declined level of galactosylated N-glycans of IgG in ovarian16, prostate17, gastric18, and lung19 cancers. In our previous study, we also revealed significant decrease in serum level of terminally galactosylated N-glycans of IgG in adult cancers compared with non-malignant controls16,20. All of those reports focus on the alterations of galactosylated N-glycans of IgG in adult cancers, while the serum level of terminally galactosylated N-glycans of IgG in children neuroblastoma has been rarely reported to date. Additionally, Yunli Hu et al performed a systematic comparison of N-linked glycomic variation between MYCN-nonamplified SY5Y and MYCN-amplified NLF neuroblastoma cell lines, less galactosylated and more sialylated N-glycan structures were found in MYCN-amplified neuroblastoma cell lines compared with MYCN-nonamplified neuroblastoma cell lines21. Therefore, we extended our research to attempt to quantitate the alteration of serum IgG galactosylation in neuroblastoma patients.
In this study, we compared the serum level of terminally galactosylated N-glycans of IgG between patients with neuroblastoma and non-malignant controls, in order to investigate whether there are statistically significant differences. A rapid, robust and high throughput analysis method which can quantitate the N-glycan levels through MALDI MS was applied to this research. And the degree of IgG galactosylation in serum was measured by a formula: G0/(G1+G2×2), calculating the relative intensities of agalactosylated N-glycan (G0) vs mono-galactosyl N-glycan (G1) and digalactosyl N-glycan (G2)16. We aim to identify a serum biomarker, which may have the potential to contribute to convenient and accurate diagnosis of neuroblastoma.
Materials and methods
Serum Samples
The serum samples were collected from the Children's Hospital of Fudan University, China, including two groups. Group I consisted of 21 neuroblastoma (NB) cases and 5 ganglioneuroblastoma (GNB) cases which were classified according to the International Neuroblastoma Pathology Classification22, of which 17 cases were untreated and 9 cases underwent neoadjuvant chemotherapy. Group II consisted of 15 healthy controls and 39 benign controls including 23 fracture cases, 9 inguinal hernia cases, 4 phimosis cases and 3 hydrocele cases.
The venous blood samples were obtained preoperatively during the morning fasting state. After clotting 30 min at ambient temperature, the tubes were centrifuged at 2000×g for 10 min. The serum samples were aliquot and stored at -80 °C until analysis. The approval of this study was obtained from the Institutional Review Board of the Children's Hospital of Fudan University, China, and informed consents from all participants were acquired.
IgG Purification
IgG from human serum samples was purified by the IgG Purification Kit Protein A Spin Plate (Thermo Fisher Scientific, Rockford, IL). The purification was manipulated according to the manufacturer instructions. Firstly, we diluted 70ul human serum sample with 100ul Protein A IgG Binding Buffer (Thermo Fisher Scientific, Rockford, IL). Subsequently, the mixtures were applied to equilibrated Protein A Spin plate wells. Then, the Protein A Spin plate was washed with Binding Buffer to wash away non-specific binding components. Lastly, IgG Elution Buffer (Thermo Fisher Scientific, Rockford, IL) was applied to elute IgG. The elution step was repeated several times. In order to determine which fractions contained IgG, a bicinchoninic acid (BCA) (Thermo Fisher Scientific, Rockford, IL) test was applied to measure the absorbance of each fraction at 280 nm. The fractions containing IgG were mixed and stored at -20 °C until analysis.
IgG N-Glycan Release and Purification
One hundred microliters of the IgG elution fractions were denatured and followed by mixing with 1ul PNGase F (New England Biolabs, Inc., USA) which was incubated at 37 °C overnight to release the IgG N-glycans. Subsequently, a PGC-containing 96-well plate was applied to purify the released N-Glycans as described previously20. Firstly, the PGC-containing 96-well plate was conditioned with 0.1% (v/v) trifluoroacetic acid (TFA) in 80% acetonitrile (ACN)/H2O (v/v), followed by 0.1% (v/v) TFA in H2O. Subsequently, the released N-glycans were loaded to the PGC-containing 96-well plate, which was repeated 3 times to allow complete binding. Then the plate was washed with H2O to remove the salts and other contaminants. Lastly, the N-glycans were eluted by 0.05% (v/v) TFA in 25% ACN/H2O (v/v).
MALDI-QIT-TOF MS of N-Glycans
Before MS analysis, we used TOFMix (LaserBio Laboratories, France) containing an eight-peptide calibration standard to calibrate the MS. One microliters N-glycan sample was spotted onto a standard MALDI plate and allowed to dry by air. Then, 1 μL 2,5-DHB (10 mg/ mL) in 0.1% (v/v) TFA in 50% ACN/ H2O (v/v) was added onto the plate and allowed to dry by air, followed by adding 0.2 μL ethanol to recrystallize matrix crystals to uniform the spot surface. Every sample was spotted in triplicate. The samples were interrogated automatically in a “batch mode” by AXIMA Resonance MALDI-QIT-TOF MS (Shimadzu Corp. JP) equipped with a 337 nm nitrogen laser in reflector positive ionization mode. The m/z range was set at 100 to 4000. Two laser shots were set to generate a profile, and 200 profiles were accumulated from different points of laser irradiation into one file for each sample spot. The GlycoWorkbench software was used for the annotation of MS spectra.
Data Management and Statistical Analysis
The MS data were processed with the software of Progenesis MALDI. Relative quantification of IgG glycosylation was calculated by the signal strength, measuring the monoisotopic peak volume. Relative quantification of IgG galactosylation was measured by a Gal-ratio formula: G0/(G1+G2×2), calculating the relative intensities of agalactosylated N-glycan (G0) vs mono-galactosyl N-glycan (G1) and digalactosyl N-glycan (G2). And the ratio of each sample was an average of three spectra. The ratios of G0/(G1+G2×2) were then evaluated by performing t test, and p values below 0.05 (two-tailed) were considered statistically significant. The data were further processed by receiver-operator characteristics (ROC) test and generated values of area-under-the-curve (AUC) with 95% confidence intervals (95% CI). If the AUC value was greater than 0.9, the tests were considered “highly accurate,” while values between 0.8 and 0.9 were deemed “accurate.” When the AUC value was between 0.7 and 0.8, the test was concluded to be “moderately accurate.” An “uninformative” test resulted in an AUC value that was between 0.5 and 0.7. Correlation coefficients between age and IgG Gal-ratio were calculated and tested by the Spearman's rho statistic. These statistical analyses were all performed on GraphPad Prism 7.
Results
Selection of Patients
A total of 26 patients were collected in this study ages from 15 months to 103 months (mean, 54.20), including 21 neuroblastoma (NB) cases and 5 ganglioneuroblastoma (GNB) cases which were classified according to the International Neuroblastoma Pathology Classification22. The primary site was retroperitoneal in 15 patients, adrenal in 5 patients, posterior mediastinal in 5 patients, and unknown in one patient. Eight of these patients were diagnosed at stage I and II, while the others were diagnosed at advanced stage III and IV according to the International Neuroblastoma Staging System (INSS)23. In addition, there were 54 non-malignant controls which consisted of 15 healthy controls, 23 fracture cases, 9 hernia cases, 4 phimosis cases and 3 hydrocele cases, ages from 12 months to 204 months (mean, 76.60). These baseline characteristics of the study cohort are listed in Table 1.
The baseline characteristics of the study cohort
| Cancer patients | Non-malignant controls | |
|---|---|---|
| Age (mean ± SD, months) | 54.20±24.00 | 76.60±45.42 |
| No. sex (male/ female) | 18/8 | 38/16 |
| No. INSS stage | ||
| I, II | 8 | -- |
| III, IV | 18 | -- |
| No. histological type | ||
| NB | 21 | -- |
| GNB | 5 | -- |
INSS, International Neuroblastoma Staging System
NB, neuroblastoma
GNB, ganglioneuroblastoma
Quantitative IgG N-Glycan Profiling
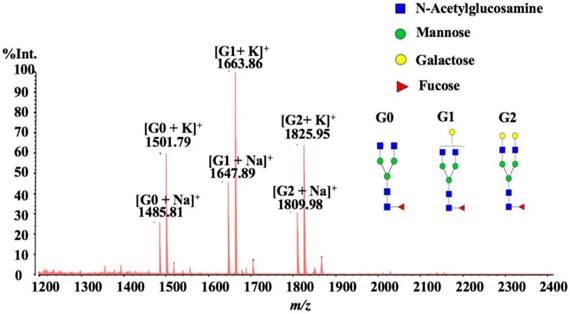
In this study, we employed MALDI-QIT-TOF MS for Quantitative IgG N-Glycan Profiling. We analyzed the quantitative intensity proportion of the three abundant N-glycans H3N4F1 (G0), H4N4F1 (G1) and H5N4F1 (G2), and the level of IgG galactosylation was calculated according to the formula: G0/(G1+G2×2) which was named as Gal-ratio in our previous method16,20. We evaluated the united abilities of IgG G0, G1, and G2 in detection of the alterations of serum IgG galactosylation instead of directly employing them as three separate N-glycan indicators because a combination of higher numbers of markers may sacrifice more coefficient of variation (CV) errors and thus generate less accurate and reliable diagnostic results due to the overfitting effect. Relative quantification of IgG galactosylation was measured by a Gal-ratio formula, calculating the relative intensities of agalactosylated N-glycan (G0) vs mono-galactosyl N-glycan (G1) and digalactosyl N-glycan (G2). What's more, several formulas were evaluated, and we finally identified G0/ (G1 + G2×2) as the most reliable and valid algorithm for the degree of IgG galactosylation. For MALDI MS analysis, the “classical” DHB with ethanol recrystallization was chosen as the more versatile matrix, and all samples were interrogated automatically in a “batch mode” so as to avoid no uniform spot surface which might affect the reliability, accuracy and reproducibility of relative quantitation. In this way, our quantitative reproducibility yielded acceptable coefficients of variation below 5% (4.38% ± 2.34%) (data showed in supplemental table 1) on running repeated biological samples. A representative MALDI spectrum is shown in Fig. 1, the peaks m/z 1485.81, 1501.79, 1647.89, 1663.86, 1809.98 and 1825.95 represented the [G0 + Na] +, [G0 + K] +, [G1 + Na] +, [G1 + K] +, [G2 + Na] +, and [G2 + K] +. Therefore, all of the six cation adduct signals were included in the calculation.
A typical MALDI-QIT-TOF MS spectrum of serum IgG N-glycan profiles from a healthy control.
Changes of IgG Galactosylation in Neuroblastoma
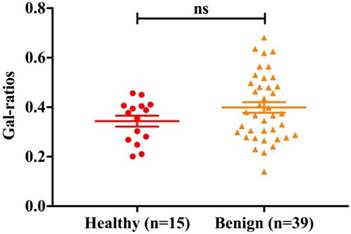
Due to the possible change of IgG Galactosylation in benign controls (fracture cases, hernia cases, phimosis cases and hydrocele cases), we first identified whether there was difference in Gal-ratios between benign and healthy controls. The Comparison of the Gal-ratios in serum samples obtained from healthy controls (n =15) and benign controls (n = 39) is shown in Fig.2 (p>0.05, ns). Based on the result of t-test, no difference was observed in IgG Galactosylation between these two portions. So, we combined these two portions as one control group for subsequent study.
Comparison of the IgG Gal-ratios in serum samples obtained from healthy controls (n = 15) and benign controls (n = 39). Error bars represent SEM of each data set. The summary for p value below 0.001 is noted as “***”, for p value of 0.001-0.01 is “**”, and for p value of 0.01-0.05 is “*”; “ns”, not statistically significant.
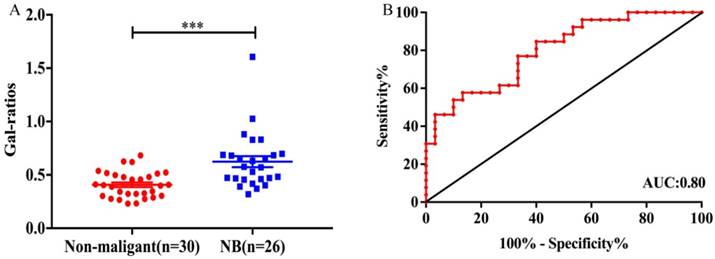
Several reports have revealed that the serum IgG galactosylation changes with age, what is more, the variation trend is opposite between children and adults. The decreasing IgG galactosylation with age has been frequently reported in adults24,25, while there is a decrease of IgG agalactosylation with age in children (ages from 6 to 18 years old) and the minimal degree of IgG agalactosylation is reached in early adulthood26. So, in order to be more accurate in comparison, according to the ages of neuroblastoma patients (mean: 54.20, from 15 months to 103 months), we deleted all the non-malignant controls that younger than 15 months and older than 103 months. For this reason, age-matched controls (mean: 56.47, from 24 months to 96 months) were selected to be compared with neuroblastoma patients, and the detail characteristics of the age-matched non-malignant controls are presented in Table 2. The corresponding statistical analysis was performed between 30 age-matched non-malignant controls and 26 neuroblastoma patients. Indeed, significantly statistic difference (p=5.0×10⁻⁴) was observed between the two groups as Fig. 3A. The Gal-ratios of neuroblastoma patients (mean±SEM: 0.62±0.05) were much higher than that of control samples (mean±SEM: 0.40±0.02). In order to confirm the specificity, sensitivity and accuracy of the Gal-ratio as a potential diagnostic marker in discriminating neuroblastoma patients from non-malignant controls, a further receiver-operator-characteristics (ROC) test was processed. The Gal-ratio data generated a sensitivity and specificity of 84.62% and 60.00%, combined with an AUC (area under the curve) of 0.80 (Fig. 3B). According to the theory, the AUC value was greater than 0.8, the tests were considered “accurate”, which indicated that the IgG Gal-ratio of neuroblastoma patients had the potential to play a suggestive role in assisting in neuroblastoma diagnosis.
The baseline characteristics of age-matched non-malignant controls.
| age-matched non-malignant controls | |
|---|---|
| Age (mean ± SD, months) | 56.47±21.31 |
| No. sex (male/ female) | 21/9 |
| No. type | |
| Healthy cases | 6 |
| Fracture cases | 12 |
| Hernia cases | 6 |
| Phimosis cases | 4 |
| Hydrocele cases | 2 |
(A) Comparison of the IgG Gal-ratios in serum samples obtained from non-malignant controls (n=30) and neuroblastoma patients (n=26). Error bars represent SEM of each data set. The summary for p value below 0.001 is noted as “***”, for p value of 0.001-0.01 is “**”, and for p value of 0.01-0.05 is “*”; “ns”, not statistically significant. (B)ROC curve for the IgG Gal-ratios to differentiate neuroblastoma patients from non-malignant controls. The AUC value was 0.80.
Changes of IgG Galactosylation(Gal-ratio) with Age in Children
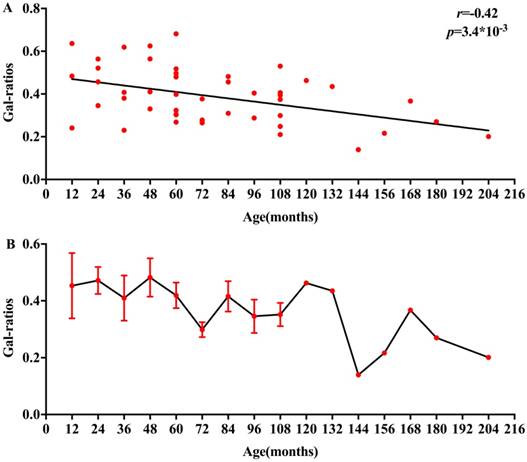
To identify the change of IgG Galactosylation (Gal-ratio) with age in children, we carried out a study into the Gal-ratios obtained from control samples between 12 and 204 months of age. The relationship between Gal-ratios and ages in children is displayed in Fig. 4A, a correlation coefficient (r =-0.42, p=3.4×10⁻³) was observed. Based on the consequence of association between IgG Gal-ratio and ages, there was an increase of serum IgG galactosylation with age in children. AS shown in Fig. 4B, the IgG Gal-ratio in children decreased more dramatically between 132 and 204 months of age which may be correlated with the time when most of children had begun puberty.
(A) Age-dependent decrease in IgG Gal-ratios in children between 12 and 204 months, p values below 0.05 were considered statistically significant. (B)The IgG Gal-ratios in serum samples obtained from non-malignant controls. Error bars represent SEM of the data of samples of the same age.
Discussion
To our knowledge, this is the first attempt to quantitatively evaluate the change of serum IgG galactosylation in neuroblastoma. Since the changes of IgG glycome composition were firstly reported in rheumatoid arthritis (RA) in 1985, aberrant IgG galactosylation has been observed in a wide range of diseases27-30, especially in various human carcinomas17-20,31,32. More generally, immunoglobulin G is one of the most abundant glycoprotein in human serum under normal circumstances, with a concentration about approximately 10 mg/mL in human serum33. There is a conserved N-linked glycosylation site (Asn-297) in the Fc region of IgG34. Also, N-glycans are reported to occur on 15% to 25% in the IgG Fab regions of IgG35. What is more, the corresponding N-glycan structures can be exactly quantified by MALDI MS36. Thereby, we applied a rapid, robust and high throughput method through MALDI MS to study the alternation of IgG galactosylation in neuroblastoma.
The serum IgG Gal-ratios of 26 neuroblastoma patients were compared to 30 age-matched controls. Obviously, the Gal-ratios were significantly higher in neuroblastoma patients than controls, indicating the decrease of IgG galactosylation in neuroblastoma patients. The tendency is the same with which was observed in 12 types of adult cancers compared with non-malignant controls according to our previous reports16,20. This illustrates that the decrease of IgG galactosylation is not exclusively specific for adult cancers. Moreover, the diagnostic ability of IgG Gal-ratios was also evaluated. The AUC was 0.80 and the specificity was 60.00% at a sensitivity of 84.62%, demonstrating that IgG Gal-ratios may be applied to the diagnosis of neuroblastoma in the future. The molecular background of the alterations of serum IgG galactosylation in neuroblastoma is also of major interest. The discovery in this study may greatly provide new ideas and facilitate research into molecular mechanisms of this change.
In addition, it has been long reported that IgG galactosylation decreases with age during adulthood25,37,38. While other studies revealed a decrease of agalactosylated structures and a constant of monogalactosylated structures in IgG N-glycome with age during childhood and adolescence26,37,39. In this study, we observed a decrease of IgG Gal-ratios with age in children and adolescents. Hence, we considered that the IgG galactosylation decreased over the age of 12 to 204 months.
It is well known that neuroblastoma is very heterogeneous on the basis of biological and clinical characteristics40. The prognosis of neuroblastoma is conditioned by a lot of factors such as age at diagnosis, clinical stage, histological type and genotypic alteration41. These factors may also play roles in the alteration of serum IgG galactosylation in neuroblastoma patients. Unfortunately, due to the insufficient sample size in this study, we were unable to conduct stratified analyses according to those classifications. Thus, before the IgG Gal-ratios could be applied as a potential marker clinically, extensive investigations through carefully conducted prospective clinical trials are required. Likewise, further studies are also needed to validate the potential of the IgG Gal-ratio as a promising biomarker supplement to current neuroblastoma detection.
In conclusion, we revealed for the first time the increase of serum IgG Gal-ratios in neuroblastoma patients compared with control samples in a rapid, robust and high throughput analysis method through MALDI MS, indicating the decease of serum IgG galactosylation in neuroblastoma. Indeed, the diagnostic potential of IgG Gal-ratios was valued in our study as well. Thus, IgG Gal-ratios may have some implications for neuroblastoma diagnosis, and may be used as a non-invasive biomarker for neuroblastoma diagnosis under further validation.
Abbreviations
IgG: immunoglobulin G; NB: neuroblastoma; GNB: ganglioneuroblastoma; GN: ganglioneuroma; MALDI-QIT-TOF MS: matrix-assisted laser desorption/ ionization quadropole ion trap time of flight mass spectrometry; AUC: area under the curve; BCA: bicinchoninic acid; PNGase F: peptide-N-glycosidase F; PVDF: polyvinylidene fluoride; PGC: porous graphic carbon; TFA: trifluoroacetic acid; ACN: acetonitrile; 2,5-DHB: 2,5-dihydroxybenzoic acid; ROC: receiver-operator characteristics; CI: confidence intervals; SEM: standard error of mean; Asn: asparagine.
Supplementary Material
Supplementary table 1.
Acknowledgements
This work was supported by grants from National Key Research and Development Program (2016YFA0501303, 2016YFC1303100), National Natural Science Foundation of China (31630088, 31770858) and Zhixianbiotech.
Competing Interests
The authors have declared that no competing interest exists.
References
1. Westermann F, Schwab M. Genetic parameters of neuroblastomas. Cancer Lett. 2002;184(2):127-147
2. Kamijo T, Nakagawara A. Molecular and genetic bases of neuroblastoma. Int J Clin Oncol. 2012;17(3):190-195
3. Lonergan GJ, Schwab CM, Suarez ES, Carlson CL. Neuroblastoma, ganglioneuroblastoma, and ganglioneuroma: radiologic-pathologic correlation. Radiographics. 2002;22(4):911-934
4. Shimada H, Ambros IM, Dehner LP. et al. The International Neuroblastoma Pathology Classification (the Shimada system). Cancer. 1999;86(2):364-372
5. Modak S, Cheung NK. Neuroblastoma: Therapeutic strategies for a clinical enigma. Cancer Treat Rev. 2010;36(4):307-317
6. Ohali A, Avigad S, Ash S. et al. Telomere length is a prognostic factor in neuroblastoma. Cancer. 2006;107(6):1391-1399
7. Cohn SL, Pearson AD, London WB. et al. The International Neuroblastoma Risk Group (INRG) classification system: an INRG Task Force report. J Clin Oncol. 2009;27(2):289-297
8. Luksch R, Castellani MR, Collini P. et al. Neuroblastoma (Peripheral neuroblastic tumours). Crit Rev Oncol Hematol. 2016;107:163-181
9. Verly IR, van Kuilenburg AB, Abeling NG. et al. Catecholamines profiles at diagnosis: Increased diagnostic sensitivity and correlation with biological and clinical features in neuroblastoma patients. Eur J Cancer. 2017;72:235-243
10. Hakomori S. Aberrant glycosylation in tumors and tumor-associated carbohydrate antigens. Adv Cancer Res. 1989;52:257-331
11. An HJ, Kronewitter SR, de Leoz ML, Lebrilla CB. Glycomics and disease markers. Curr Opin Chem Biol. 2009;13(5-6):601-607
12. Chen YT, Chong YM, Cheng CW. et al. Identification of novel tumor markers for oral squamous cell carcinoma using glycoproteomic analysis. Clin Chim Acta. 2013;420:45-53
13. Peracaula R, Barrabes S, Sarrats A, Rudd PM, de Llorens R. Altered glycosylation in tumours focused to cancer diagnosis. Dis Markers. 2008;25(4-5):207-218
14. Qin R, Zhao J, Qin W. et al. Discovery of Non-invasive Glycan Biomarkers for Detection and Surveillance of Gastric Cancer. J Cancer. 2017;8(10):1908-1916
15. Huhn C, Selman MH, Ruhaak LR, Deelder AM, Wuhrer M. IgG glycosylation analysis. Proteomics. 2009;9(4):882-913
16. Qian Y, Wang Y, Zhang X. et al. Quantitative analysis of serum IgG galactosylation assists differential diagnosis of ovarian cancer. J Proteome Res. 2013;12(9):4046-4055
17. Kanoh Y, Mashiko T, Danbara M. et al. Changes in serum IgG oligosaccharide chains with prostate cancer progression. Anticancer Res. 2004;24(5B):3135-3139
18. Kodar K, Stadlmann J, Klaamas K, Sergeyev B, Kurtenkov O. Immunoglobulin G Fc N-glycan profiling in patients with gastric cancer by LC-ESI-MS: relation to tumor progression and survival. Glycoconj J. 2012;29(1):57-66
19. Arnold JN, Saldova R, Galligan MC. et al. Novel glycan biomarkers for the detection of lung cancer. J Proteome Res. 2011;10(4):1755-1764
20. Ren S, Zhang Z, Xu C. et al. Distribution of IgG galactosylation as a promising biomarker for cancer screening in multiple cancer types. Cell Res. 2016;26(8):963-966
21. Hu Y, Mayampurath A, Khan S, Cohen JK, Mechref Y, Volchenboum SL. N-linked glycan profiling in neuroblastoma cell lines. J Proteome Res. 2015;14(5):2074-2081
22. Shimada H, Ambros IM, Dehner LP, Hata J, Joshi VV, Roald B. Terminology and morphologic criteria of neuroblastic tumors: recommendations by the International Neuroblastoma Pathology Committee. Cancer. 1999;86(2):349-363
23. Brodeur GM, Pritchard J, Berthold F. et al. Revisions of the international criteria for neuroblastoma diagnosis, staging, and response to treatment. J Clin Oncol. 1993;11(8):1466-1477
24. Pucic M, Knezevic A, Vidic J. et al. High throughput isolation and glycosylation analysis of IgG-variability and heritability of the IgG glycome in three isolated human populations. Mol Cell Proteomics. 2011;10(10):M111 010090
25. Bakovic MP, Selman MH, Hoffmann M. et al. High-throughput IgG Fc N-glycosylation profiling by mass spectrometry of glycopeptides. J Proteome Res. 2013;12(2):821-831
26. Pucic M, Muzinic A, Novokmet M. et al. Changes in plasma and IgG N-glycome during childhood and adolescence. Glycobiology. 2012;22(7):975-982
27. Troelsen LN, Jacobsen S, Abrahams JL. et al. IgG glycosylation changes and MBL2 polymorphisms: associations with markers of systemic inflammation and joint destruction in rheumatoid arthritis. J Rheumatol. 2012;39(3):463-469
28. Sjowall C, Zapf J, von Lohneysen S. et al. Altered glycosylation of complexed native IgG molecules is associated with disease activity of systemic lupus erythematosus. Lupus. 2015;24(6):569-581
29. Martin K, Talukder R, Hay FC, Axford JS. Characterization of changes in IgG associated oligosaccharide profiles in rheumatoid arthritis, psoriatic arthritis, and ankylosing spondylitis using fluorophore linked carbohydrate electrophoresis. J Rheumatol. 2001;28(7):1531-1536
30. Lundstrom SL, Yang H, Lyutvinskiy Y. et al. Blood plasma IgG Fc glycans are significantly altered in Alzheimer's disease and progressive mild cognitive impairment. J Alzheimers Dis. 2014;38(3):567-579
31. Bones J, Byrne JC, O'Donoghue N. et al. Glycomic and glycoproteomic analysis of serum from patients with stomach cancer reveals potential markers arising from host defense response mechanisms. J Proteome Res. 2011;10(3):1246-1265
32. Vasseur JA, Goetz JA, Alley WR Jr, Novotny MV. Smoking and lung cancer-induced changes in N-glycosylation of blood serum proteins. Glycobiology. 2012;22(12):1684-1708
33. Schur PH. IgG subclasses. A historical perspective. Monogr Allergy. 1988;23:1-11
34. Takahashi N, Ishii I, Ishihara H. et al. Comparative structural study of the N-linked oligosaccharides of human normal and pathological immunoglobulin G. Biochemistry. 1987;26(4):1137-1144
35. Holland M, Yagi H, Takahashi N. et al. Differential glycosylation of polyclonal IgG, IgG-Fc and IgG-Fab isolated from the sera of patients with ANCA-associated systemic vasculitis. Biochim Biophys Acta. 2006;1760(4):669-677
36. Harvey DJ. Matrix-assisted laser desorption/ionization mass spectrometry of carbohydrates. Mass Spectrom Rev. 1999;18(6):349-450
37. Parekh R, Roitt I, Isenberg D, Dwek R, Rademacher T. Age-related galactosylation of the N-linked oligosaccharides of human serum IgG. J Exp Med. 1988;167(5):1731-1736
38. Kristic J, Vuckovic F, Menni C. et al. Glycans are a novel biomarker of chronological and biological ages. J Gerontol A Biol Sci Med Sci. 2014;69(7):779-789
39. de Haan N, Reiding KR, Driessen G, van der Burg M, Wuhrer M. Changes in Healthy Human IgG Fc-Glycosylation after Birth and during Early Childhood. J Proteome Res. 2016;15(6):1853-1861
40. Uccini S, Mannarino O, McDowell HP. et al. Clinical and molecular evidence for c-kit receptor as a therapeutic target in neuroblastic tumors. Clin Cancer Res. 2005;11(1):380-389
41. Cheung NK, Dyer MA. Neuroblastoma: developmental biology, cancer genomics and immunotherapy. Nat Rev Cancer. 2013;13(6):397-411
Author contact
![]() Corresponding author: Kuiran Dong, Department of Oncology, Children's Hospital, Fudan University, 399 Wanyuan Road, Shanghai 201102, P. R. China. E-mail: kuirandcom; Tel: +86-21- 64931990 and Shifang Ren: Key Laboratory of Glycoconjugate Research Ministry of Public Health, Department of Biochemistry and Molecular Biology, School of Basic Medical Sciences, Fudan University, 130 Dongan Road, Shanghai 200032, P. R. China. E-mail: renshifangedu.cn Tel: +86-21-54237701 Fax: +86-21-64437703.
Corresponding author: Kuiran Dong, Department of Oncology, Children's Hospital, Fudan University, 399 Wanyuan Road, Shanghai 201102, P. R. China. E-mail: kuirandcom; Tel: +86-21- 64931990 and Shifang Ren: Key Laboratory of Glycoconjugate Research Ministry of Public Health, Department of Biochemistry and Molecular Biology, School of Basic Medical Sciences, Fudan University, 130 Dongan Road, Shanghai 200032, P. R. China. E-mail: renshifangedu.cn Tel: +86-21-54237701 Fax: +86-21-64437703.