Impact Factor ISSN: 1837-9664

 Global reach, higher impact
J Cancer 2018; 9(6):1025-1032. doi:10.7150/jca.23229 This issue Cite
Research Paper
A Novel Risk prediction Model for Patients with Combined Hepatocellular-Cholangiocarcinoma
Meng-Xin Tian1*, Wen-Jun He2*, Wei-Ren Liu1*, Jia-Cheng Yin1, Lei Jin1, Zheng Tang1, Xi-Fei Jiang1, Han Wang1, Pei-Yun Zhou1, Chen-Yang Tao1, Zhen-Bin Ding1, Yuan-Fei Peng1, Zhi Dai1, Shuang-Jian Qiu1, Jian Zhou1,3, Jia Fan1,3 ![]() , Ying-Hong Shi1
, Ying-Hong Shi1 ![]()
1. Department of Liver Surgery, Liver Cancer Institute, Zhongshan Hospital, Fudan University; Key Laboratory of Carcinogenesis and Cancer Invasion of Ministry of Education, Shanghai, China;
2. Department of Medical Statistic and Epidemiology, School of Public Health, Sun Yat-sen University, Guangzhou, China;
3. Institutes of Biomedical Sciences, Fudan University, Shanghai, People's Republic of China.
* These authors contributed equally to this work.
Received 2017-10-8; Accepted 2018-1-28; Published 2018-2-28
Abstract
Backgrounds: Regarding the difficulty of CHC diagnosis and potential adverse outcomes or misuse of clinical therapies, an increasing number of patients have undergone liver transplantation, transcatheter arterial chemoembolization (TACE) or other treatments.
Objective: To construct a convenient and reliable risk prediction model for identifying high-risk individuals with combined hepatocellular-cholangiocarcinoma (CHC).
Methods: 3369 patients who underwent surgical resection for liver cancer at Zhongshan Hospital were enrolled in this study. The epidemiological and clinical characteristics of the patients were collected at the time of tumor diagnosis. Variables (P <0.25 in the univariate analyses) were evaluated using backward stepwise method. A receiver operating characteristic (ROC) curve was used to assess model discrimination. Calibration was performed using the Hosmer-Lemeshow test and a calibration curve. Internal validation was performed using a bootstrapping approach.
Results: Among the entire study population, 250 patients (7.42%) were pathologically defined with CHC. Age, HBcAb, red blood cells (RBC), blood urea nitrogen (BUN), AFP, CEA and portal vein tumor thrombus (PVTT) were included in the final risk prediction model (area under the curve, 0.69; 95% confidence interval, 0.51-0.77). Bootstrapping validation presented negligible optimism. When the risk threshold of the prediction model was set at 20%, 2.73% of the patients diagnosed with liver cancer would be diagnosed definitely, which could identify CHC patients with 12.40% sensitivity, 98.04% specificity, and a positive predictive value of 33.70%.
Conclusions: Herein, the study established a risk prediction model which incorporates the clinical risk predictors and CT/MRI-presented PVTT status that could be adopted to facilitate the diagnosis of CHC patients preoperatively.
Keywords: combined hepatocellular-cholangiocarcinoma, risk prediction model, liver cancer, preoperation.
Introduction
Combined hepatocellular-cholangiocarcinoma (CHC) is a rare primary liver malignancy with dual histologic differentiation: hepatocellular and biliary epithelial features[1, 2], accounting for 0.4-14.2% of all primary liver cancers in Asia and Western countries[1-4]. Since Allen and Lisa firstly reported this type of liver cancer, two histopathological classification schemes, Allen-Lisa and Goodman classifications, have been used for CHC classification [3, 5]. Over the past two decades, a growing number of retrospective studies have described this rare tumor[6-8].To date, most studies primarily focused on the demographic and clinical characteristics of CHC. However, in contrast to the established preoperative diagnostic prediction model of hepatocellular carcinoma (HCC) [9, 10], little is known about the preoperative diagnostic prediction of CHC.
The clinical features of CHC are similar to either HCC or intrahepatic cholangiocarcinoma (ICC), which implies that the risk factors (tumor biomarkers, etiology, characteristics and imaging tests) of CHC overlapped with those of HCC or ICC [1, 6, 11-14]. But the imaging features of CHC patients didn't present typical features compared with HCC or ICC patients, which manifested that preoperative diagnosis of CHC is very difficult [15]. Thus, patients who were diagnosed with CHC by pathological tests may potentially receive liver resection, transcatheter arterial chemoembolization (TACE) or liver transplantation according to HCC guideline[16-18], as TACE was less effective in the treatment of CHC patients than radical resection [1] [7]. In addition, CHC was associated with poorer prognosis and higher rate of tumor recurrence after liver transplantation[19]. Considering the poor response to TACE, the scarcity of liver donation[20] and the difficulty of preoperative diagnosis, it is necessary to establish a risk prediction tool that identifies CHC patients and available for clinical practice.
In the present study, patients were categorized into CHC and non-CHC cohorts. The aim of the present study was to investigate the essential differences between CHC and non-CHC populations based on epidemiologic and clinical characteristics at the time of tumor diagnosis. We also developed and validated the clinical preoperative CHC risk prediction model using bootstrap method.
Material and methods
Patients
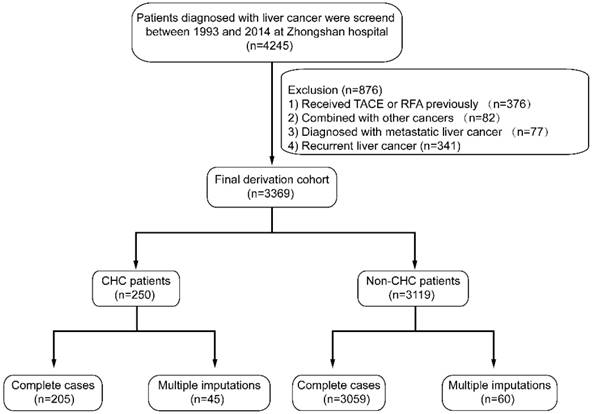
Between March 1993 and December 2014, 4245 patients with liver cancer were surgically treated and screened for enrollment in the Department of Liver Surgery, Zhongshan Hospital. The standard technique was adopted for hepatic resection[20], and the pathology of liver cancer was histologically defined according to World Health Organization criteria[21, 22]. Preoperative imaging studies included chest X-ray, abdominal ultrasonography, contrast-enhanced computer tomography (CT) or magnetic resonance imaging (MRI) and, in some cases, hepatic arteriography. Extrahepatic metastasis was diagnosed using chest X-ray, chest CT, and bone scintigraphy. Liver function was assessed using serum biochemical data, ascites, and prothrombin time. Patients with Child-Pugh class A underwent major hepatic resection (more than 3 segments) [23]. The flow chart of patient exclusion was shown in Figure 1. In the final dataset, 250 patients were classified as a CHC cohort, and 3119 patients were classified as a non-CHC cohort. The CHC cohort presented with 82.0% (205/250) complete cases, and non-CHC cohort presented 98.1% (3059/3119). This study was approved by the institutional review board of Zhongshan Hospital and complied with the standards of the Declaration of Helsinki and current ethical guidelines.
Flow chart of the study cohort. TACE, transcatheter arterial chemoembolization; RFA, radiofrequency ablation; CHC, combined hepatocellular-cholangiocarcinoma.
Follow-up
In our department, the entire patients underwent monthly follow-up in the first 6 months and every 3 months thereafter until death or dropout. Abdominal ultrasound, liver function tests, serum alpha-fetoprotein (AFP), carcinoembryonic antigen (CEA) and carbohydrate antigen 19-9 (CA19-9) levels were analyzed every 3 months, and abdominal magnetic resonance imaging (MRI) scanning was performed every 6 or 12 months. Recurrence was primarily diagnosed based on imaging findings from MRI or CT scans and increased serum AFP or CA19-9 levels. Chest CT and bone scintigraphy were used to evaluate extrahepatic recurrence. Depending on the type of recurrence, and liver function reserve, patients were treated with different therapies, including RFA, repeated resection, TACE, percutaneous ethanol injection (PEI), and chemotherapy for patients with extrahepatic metastatic disease.
Laboratory test and Data collection
The serum indicators and blood cell count were measured according to standard laboratory procedures. Routine examination included serum AFP, CEA and CA19-9. In all patients, hepatitis B surface antigen (HBsAg) and antibodies to hepatitis C virus were detected using standard test systems. Demographic, pathological and clinical patient data were collected. To evaluate the potential predicting variables, the clinical and imaging variables included the patient's age, sex, etiology, laboratory tests, tumor biomarkers, tumor size, tumor number and portal vein tumor thrombus (PVTT). In the initial imaging test, the existence of PVTT was confirmed using CT or MRI. All variables were available in the practice medical record at the time of initial liver cancer diagnosis.
Statistical analysis
Demographic, clinical and tumor characteristics were described as summary statistics and presented as percentages or mean values. In the present study, the statistical analysis was performed according to Boursi et al [24]. Briefly, we performed multiple imputation using the Monte Carlo approach and produced 20 datasets[25-27]. The imputation of missing values was completed using Gibbs sampling[28-30]. The variables with the missing values would be predicted with other variables. Continuous variables were imputed based on the mean of the predicted values, while the categorical variables were imputed using logistic regression. For model developing procedures, univariate analysis was used for initial variable selection, and all variables with P <0.25 were further evaluated using multivariable logistic regression. In each of the imputed datasets, we used a backward stepwise approach for the multivariable logistic regression with the Akaike information criterion (AIC). Predictors selected in ≥50% of the imputation models were included in the final multivariable model, and the results of the final multivariable model were pooled in 20 imputed datasets using the mice package. For model prediction performance, discrimination and calibration were evaluated. Discrimination reflects the ability of the risk score to differentiate between patients who do and do not experience CHC. The measure is quantified by calculating the area under the receiver operating characteristic curve statistic[31]. Calibration reflects the agreement between predicted probabilities from the model and observed outcomes. We used the Hosmer-Lemeshow test[24] to statistically determine the extent of agreement between the predicted and observed probabilities. For model validation, internal validation was adopted using a bootstrapping method[32]. The bootstrapping was performed using 100 bootstrap resamples of 3369 individuals, each time selecting variables and developing a model within the sample. The discrimination for each model was calculated both within the sample in the original cohort, enabling the calculation of the optimism according to Harrell's algorithm[33]. All analyses were performed using R software with rms, mice, and MASS packages (http://mirrors.ustc.edu.cn/CRAN/).
Results
Characteristics of the study cohort
The demographic and clinicopathological data for the entire cohort (3369) were shown in Table 1. Among the patients diagnosed with liver cancer, the mean age was 54.2 years (46.0, 62.0), men comprising 79.1% of the cohort. Based on WHO criteria, 250 (7.42%) patients were pathologically classified as CHC cohort and the remaining patients (3119 patients) were classified as the non-CHC cohort. In addition, 2489 (73.9%) patients were positive for hepatitis B surface antigen (HBsAg), and 45 (1.3%) patients were positive for the hepatitis C antibody; the mean serum AFP, CEA and CA19-9 levels were 1858.5 (3.3, 303.4), 8.1 (1.5, 3.5), 333.5 (10.9, 43.2), respectively.
Participant characteristics and effects of CHC risk in the univariable logistic regression analysis.
| Patient demographics | Entire cohort | Patients with CHC | Patients with Non-CHC | Missingness, n (%) | Crude OR (95%CI) | P value |
|---|---|---|---|---|---|---|
| Overall | 3264 | 250 | 3119 | |||
| Host factors | ||||||
| Age, yr | 54.2 (46.0, 62.0) | 52.0 (44.0, 60.0) | 54.4 (47.0, 62.0) | 1 (0.03%) | 0.74 (0.56, 0.99) | 0.043 |
| Sex (male), n (%) | 2665 (79.1%) | 189 (75.3%) | 2476 (79.4%) | 1 (0.03%) | 0.80 (0.60, 1.09) | 0.157 |
| Etiology | ||||||
| HBsAg (positive), n (%) | 2489 (73.9%) | 188 (74.9%) | 2301 (73.8%) | 15 (0.46%) | 1.08 (0.80, 1.46) | 0.622 |
| HBcAb (positive), n (%) | 3013 (89.4%) | 210 (83.7%) | 2803 (89.9%) | 18 (0.55%) | 0.56 (0.39, 0.80) | 0.001 |
| HCV (positive), n (%) | 45 (1.3%) | 5 (2.0%) | 40 (1.3%) | 20 (0.61%) | 1.56 (0.61, 3.99) | 0.352 |
| Liver cirrhosis (yes), n (%) | 2313 (68.7%) | 175 (69.7%) | 2138 (68.5%) | 1 (0.03%) | 1.09 (0.82,1.45) | 0.544 |
| Laboratory values | ||||||
| RBC, ×1012/L | 4.4 (4.1,4.8) | 4.3 (4.1, 4.8) | 4.4 (4.1, 4.8) | 14 (0.43%) | 0.71 (0.58, 0.88) | 0.002 |
| HB, g/L | 136.3 (127.0,148.0) | 135.3 (125.8, 149.0) | 136.4 (127.0, 148.0) | 12 (0.37%) | 1.00 (0.99, 1.00) | 0.343 |
| WBC, ×109/L | 6.1 (4.4, 6.9) | 5.9 (4.4, 6.8) | 6.1 (4.4, 6.9) | 37 (1.13%) | 0.97 (0.92, 1.02) | 0.298 |
| PLT, ×109/L | 154.3 (105.0, 193.0) | 148.9 (103.0, 186.8) | 154.7 (106.0, 193.0) | 12 (0.37%) | 0.90 (0.66, 1.22) | 0.505 |
| AFP, ng/mL | 1858.5 (3.3, 303.4) | 2327.3 (5.6, 365.6) | 1821.4 (3.2, 300.5) | 4 (0.12%) | 2.10 (1.57, 2.80) | <0.0001 |
| CEA, μg/mL | 8.1 (1.5, 3.5) | 5.8 (1.2, 3.9) | 8.3 (1.5, 3.5) | 7 (0.21%) | 1.52 (1.08, 2.14) | 0.016 |
| CA19-9, U/mL | 333.5 (10.9, 43.2) | 113.3 (12.1, 57.0) | 350.8 (10.7, 42.7) | 5 (0.15%) | 1.33 (1.01, 1.75) | 0.039 |
| Bilirubin, μmol/L | 18.2 (9.0, 15.7) | 14.8 (9.4, 15.9) | 18.5 (9.0, 15.7) | 1 (0.03%) | 1.04 (0.75, 1.43) | 0.814 |
| Albumin, g/L | 40.7 (38.0, 43.0) | 41.3 (38.0, 44.0) | 40.6 (38.0, 43.0) | 1 (0.03%) | 1.16 (0.89, 1.52) | 0.274 |
| PA, g/L | 0.3 (0.17,0.25) | 0.2 (0.17, 0.25) | 0.3 (0.17, 0.25) | 217 (6.65%) | 0.06 (0.01, 0.69) | 0.023 |
| ALT, IU/L | 51.5 (21.0, 50.0) | 45.5 (20.0, 51.0) | 51.9 (21.0, 50.0) | 1 (0.03%) | 0.97 (0.75, 1.26) | 0.813 |
| GGT, U/L | 110.7 (37.0, 116.0) | 102.1 (36.0, 128.3) | 111.4 (37.0, 118.0) | 3 (0.09%) | 0.95 (0.72, 1.26) | 0.736 |
| ALP, IU/L | 104.4 (66.0, 110.0) | 102.5 (72.0, 115.0) | 104.5 (66.0, 109.0) | 13 (0.40%) | 1.00 (1.00, 1.00) | 0.776 |
| APTT, s | 28.8 (26.0, 31.1) | 28.7 (25.5, 32.7) | 28.9 (26.0, 31.1) | 100 (3.06%) | 0.99 (0.97, 1.02) | 0.732 |
| PT, s | 12.3 (11.3, 12.7) | 12.0 (11.3, 12.6) | 12.3 (11.3, 12.7) | 6 (0.18%) | 0.93 (0.84, 1.02) | 0.101 |
| INR | 1.0 (0.97, 1.08) | 1.1 (0.96, 1.09) | 1.0 (0.97, 1.08) | 15 (0.46%) | 0.79 (0.61, 1.03) | 0.077 |
| BUN, nmol/L | 5.7 (4.4, 6.4) | 4.8 (4.0, 5.6) | 5.8 (4.5, 6.5) | 63 (1.93%) | 0.70 (0.63, 0.77) | <0.0001 |
| Cr, μmol/L | 72.1 (61.8, 80.6) | 73.0 (61.0, 80.0) | 72.1 (61.8, 80.6) | 35 (1.07%) | 1.00 (1.00, 1.01) | 0.380 |
| Tumor numbers (≤3), n (%) | 2961 (87.9%) | 207 (81.4%) | 2754 (88.4%) | 3 (0.09%) | 0.99 (0.61, 1.61) | 0.969 |
| Tumor diameter, cm | 6.1 (3.0, 8.0) | 6.5 (3.5, 8.1) | 6.1 (3.0, 8.0) | 1 (0.03%) | 1.03 (1.00, 1.06) | 0.101 |
| PVTT (positive), n (%) | 331 (9.8%) | 19 (7.6%) | 312 (10.0%) | 1 (0.03%) | 0.70 (0.43, 1.14) | 0.153 |
Values are presented as no. (%) or mean (Q1, Q3).
HBV, hepatitis B virus; HCV, hepatitis C virus; CH, chronic hepatitis; LC, liver cirrhosis; NL, normal liver; AFP, α-fetoprotein; CEA, carcino-embryonic antigen; CA19-9, carbohydrate 19-9; RBC, red blood cell; WBC, white blood cell; PLT, platelet; PA, pre-albumin; ALT, alanine aminotransferase; GGT, γ-glutamyl transpeptidase; ALP, alkaline phosphatase; PT, prothrombin time; INR, international normalized ratio; BUN, blood urea nitrogen; Cr, creatinine; PVTT, portal vein tumor thrombus.
In the present study, 27 candidate predictors with CHC were considered. The univariate logistic regression analysis is summarized in Table 1. With respect to factors associated with CHC risk, 13 variables achieved significance at P <0.25, including age, sex, HBcAb, AFP, CEA, CA19-9, PA, PT, INR, BUN, tumor numbers, tumor diameter, and PVTT.
Construction of an individualized model
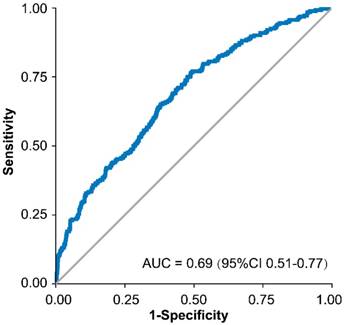
All factors selected above were entered into the multivariate logistic regression analysis using a backward stepwise approach, and the results were presented in Table 2. Fmi represented the fraction of missing information, and lambda reflected the proportion of total variance attributable to the missing data. Predictors in ≥50% of the 20 imputed datasets, including age (19/20, P=0.007), HBcAb (20/20, P<0.0001), AFP (20/20, P<0.0001), CEA (20/20, P=0.009), PVTT (20/20, P=0.03), RBC (19/20, P<0.001) and BUN (20/20, P=0.08), were selected in the final model. The area under the curve (AUC) of the model was 0.69 (95% CI, 0.51 to 0.77, Figure 2) and the P-values for the Hosmer-Lemeshow goodness of fit test were close to 1.00 in the 20 imputed datasets.
Final multivariable prediction modela and a case example.
| Predictor | β Coefficient | SE | OR | 95% CI | Nmis | Fmi | Lambda | P-value |
|---|---|---|---|---|---|---|---|---|
| Age (<60/≥60) | -0.0268068 | 0.0099689 | 1.265 | 1.172-1.365 | 3 | 0.003 | 0.003 | 0.007 |
| HBcAb (yes/no) | -0.0638200 | 0.0154336 | 0.974 | 0.957-0.988 | NA | 0.004 | 0.004 | <0.0001 |
| AFP (<20/≥20 ng/mL) | 0.0572810 | 0.0093992 | 1.059 | 1.040-1.079 | 37 | 0.049 | 0.048 | <0.0001 |
| CEA (<5/≥5 ng/mL) | 0.0354218 | 0.0135939 | 1.036 | 1.009-1.064 | 62 | 0.006 | 0.006 | 0.009 |
| RBC, ×1012/L | -0.0276869 | 0.0081596 | 0.974 | 0.955-0.993 | NA | 0.004 | 0.003 | <0.001 |
| BUN, nmol/L | -0.0010271 | 0.0006005 | 0.999 | 0.998-1.000 | NA | 0.044 | 0.044 | 0.087 |
| PVTT (yes/no) | -0.0322564 | 0.0151275 | 0.968 | 0.940-0.997 | NA | 0.001 | 0.0003 | 0.033 |
RBC, red blood cell; BUN, blood urea nitrogen; PVTT, portal vein tumor thrombus; OR, odds ratio. Nmis, number of missing; Fmi, fraction of missing information.
aThe formula of the resulting logistic model is:
P probability for CHC=e(χβ)/(1+ e(χβ)).
χβ=-0.02680679×age-0.06381997×HBcAb-0.02768688×RBC-0.00102712×BUN+0.05728100×AFP+0.03542176×CEA-0.03232564×PVTT+0.23481440.
Case example: a 65-year-old female diagnosed with liver cancer. The tumor was less than 3cm and enhanced MRI could not distinguish the tumor from HCC or other liver cancers. The laboratory test results were HBcAb positive, AFP 207 ng/mL, CEA 75 ng/mL, RBC 5.4 ×10¹²/L, and BUN 7.8 nmol/L. The imaging test of enhanced MRI suggested that the left portal vein contained tumor thrombus. According to the model, the patient's risk for CHC would be 51.2%.
Receiver operating characteristic curve of the final model.
Performance and validation of the risk prediction model
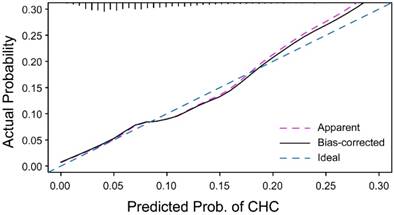
To validate the performance of this risk model, we performed internal validation using the bootstrap method with 100 repetitions. The model was validated with 20 imputed datasets, and the bootstrap-corrected C-index was between 0.66 and 0.69, which demonstrated good accuracy for assessing CHC risk. The calibration curve demonstrated that the apparent probability of CHC was close to the ideal probability (Figure 3). The optimism of C-index ranged from 0.0072 to 0.0122.
Calibration curve for the CHC risk model. With the dataset, the apparent calibration curve is similar to the ideal calibration curve for the CHC risk model.
Predictive curve for the CHC risk model
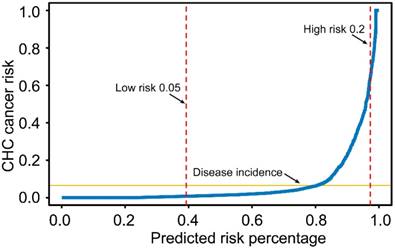
The predictive curve for the CHC risk prediction model was shown in Figure 4. If the risk threshold for further CHC examination was set at 20%, then 2.73% of the liver cancer population would undergo screening, and the sensitivity, specificity and positive predictive value of the model would be 12.40%, 98.04%, and 33.70%, respectively. For a risk threshold of 5%, 60.7% of the liver cancer population would undergo screening, and the corresponding sensitivity, specificity and positive predictive values would be 82.00%, 40.97%, and 10.02%, respectively. The sensitivity, specificity and positive predictive value for four different probability cutoffs are presented in Table 3 (5%, 10%, 15% and 20%).
Predictive curve for the CHC risk model in table 3. The risk thresholds for <5% for low risk and >20% for high risk are shown.
Model diagnostic performance at different predicted probability cut-offs.
| Probability cut-off | Diagnostic performance, % |
|---|---|
| 5% | |
| Sensitivity | 82.00 |
| Specificity | 40.97 |
| PPV | 10.02 |
| 10% | |
| Sensitivity | 45.20 |
| Specificity | 77.22 |
| PPV | 13.99 |
| 15% | |
| Sensitivity | 23.20 |
| Specificity | 93.91 |
| PPV | 23.39 |
| 20% | |
| Sensitivity | 12.40 |
| Specificity | 98.04 |
| PPV | 33.70 |
PPV=positive predictive value
Discussion
In the present study, we constructed and validated a novel risk prediction model for CHC patients. The model is based on demographic, clinical and imaging characteristics which is available at the time of tumor diagnosis. The final model presented good discrimination (0.69; 95%CI, 0.51-0.77) with negligible optimism (0.0072 to 0.0122) and adequate goodness of fit. To our knowledge, this is the first study to establish a preoperative risk prediction model of CHC.
In clinical practice, CHC is clinically asymptomatic until the advanced stage, and these patients lose the opportunity to receive curative surgical resection [34]. Considering its dual tumor features, the existing tumor biomarkers (including CA19-9, AFP and CEA) and imaging techniques (including ultrasound, CT or MRI) hinder the accurate preoperative diagnosis of CHC. Previous studies existed two drawbacks: the first is that was small populations (12~103), and the second shortage was that these studies generally focused on the clinical and pathological characteristics of CHC[6, 7, 11, 20, 35]. These issues make it difficult to identify the potential diagnostic predictors for CHC. Other than harboring the largest data set, we included 27 potential clinical risk factors and identified 7 risk predictors using multivariate logistic regression analysis based on a backward stepwise approach. For the missing data, the multiple imputation method was performed, and 20 imputed datasets were produced. The lambda values of 7 predictors were low (Table 2), indicating that the effect of missing data on the final model is negligible.
Due to the difficulty of preoperative diagnosis, these patients may initially be defined as HCC or ICC, and may receive TACE, radical resection, RFA or liver transplantation based on the experience of the clinicians.[19] Although CHC patients could acquire survival benefit similar to HCC patients who underwent liver transplantation[18], the study cohort was only confined to a strict selection criteria and small populations. In addition, although TACE may be effective for prolonging survival in unresectable CHC, the survival after TACE is significantly dependent on tumor size, vascularity and the presence or absence of portal vein invasion. Thus, a novel prediction models and screening methods for detection of CHC are urgently needed.
Conducting preoperative pathological diagnosis using costly and/or invasive tests (such as biopsy) would not be a practical approach. Recently, a predictive curve has been used to evaluate the efficiency of given biological markers, to assess the fit of models and estimate the clinical utility of a model in specific population[24, 36-39]. The prediction model shown in the present study provides a low-cost, convenient and low-risk solution to this problem by identifying high-risk individuals for definitive preoperative diagnosis. For example, using a 10% predicted risk of CHC as the threshold, approximately 23.98% patients would receive a definitive procedure. Despite the high screening percentage at 10%, a majority of patients with typical imaging or clinical characteristics for HCC or ICC would be excluded. If the threshold for proceeding with definitive testing was set as 20%, then only 2.73% of the entire cohort would receive the definitive procedure. Notably, this strategy would enable the efficient screening of these cancers.
In the present study, 7 different variables were identified as risk predictors for CHC. First, age has been demonstrated as an independent risk factor for CHC. In previous reports, the age of CHC patients was lower than that of HCC or ICC patients[7]. Age was an important variable for predicting disease-specific survival after liver resection[40], and similar results were presented in gastric[41], breast[42, 43], gallbladder[44] and colorectal cancers[45]. As a classical serological marker of HBV infection, HBcAb was identified as another risk predictor. Positive HBcAb correlated with vascular invasion and poor RFS in HCC patients after curative resection[46, 47]. In addition, these studies focused on the characteristics in CHC patients with respect to HCC or ICC patients. Elevated serum AFP and CEA were associated with poorer prognosis for ICC or HCC patients[48-51]. Although tumor biomarkers (AFP, CEA and CA19-9) may not be specific for CHC, these proteins are of diagnostic value. In the present study, AFP and CEA were demonstrated as risk predictors with an odds ratio of 1.06 and 1.04, respectively. The CHC cohort presented higher serum AFP level (2327.3, 5.6 to 365.6) and lower CEA level (5.8, 1.2 to 3.9) than that of the non-CHC cohort, while in other reports, the AFP levels in CHC patients were significantly lower compared with other groups. The result are consistent with the results of previous reports.
There are several limitations to the proposed risk-prediction model. First, the CHC cohort was derived from a single-center database in China with HBsAg positive patients accounting for 74.9% and HCV positive patients accounting for 2.0%; therefore, this model may not be applicable to other populations in western countries and further validation is warranted. Considering the small size population of CHC in previous investigations, external validation from other liver centers may not be feasible. Second, genetic polymorphisms, epigenetic changes, and information regarding circulating tumor cells, which may be essential for accurate diagnosis, were not included in our study. However, the risk-prediction model presents optimal predictive power. Finally, the model was not intended as a definitive diagnostic test but rather as part of a sequential approach to identify individuals at high-risk for CHC.
Conclusion
In conclusion, we established a risk-prediction model based on clinical, imaging characteristics, and etiology factors for predicting CHC. To date, there existed no defined criteria to discriminate patients with CHC from other liver cancer patients yet, this novel model may be useful in clinical practice as it may tail appropriate therapy for each CHC patients.
Abbreviations
CHC: combined hepatocellular-carcinoma; TACE: transcatheter arterial chemoembolization; ROC: receiver operating characteristic curve; HCC: hepatocellular carcinoma; ICC: intrahepatic cholangiocarcinoma; CT: computer tomography; MRI: magnetic resonance imaging; PVTT: portal vein tumor thrombus; AIC: akaike information criterion.
Acknowledgements
This work was supported by the grants from National Natural Science Foundation of China (No. 81773067, 81472674, 81502486), National Key Sci-Tech Project (2012ZX10002011-002); the Shanghai Committee of Science and Technology, China (No. 16JC1404000).
Ethical standards
The study with clinical data was approved by the Ethics Committee of the Zhongshan Hospital, Fudan University. We clarify that all clinical data in this study was collected in patients who had given written informed consent.
Competing Interests
The authors have declared that no competing interest exists.
References
1. Kim KH, Lee SG, Park EH, Hwang S, Ahn CS, Moon DB. et al. Surgical treatments and prognoses of patients with combined hepatocellular carcinoma and cholangiocarcinoma. Annals of surgical oncology. 2009;16:623-9
2. Aoki K, Takayasu K, Kawano T, Muramatsu Y, Moriyama N, Wakao F. et al. Combined hepatocellular carcinoma and cholangiocarcinoma: clinical features and computed tomographic findings. Hepatology (Baltimore, Md). 1993;18:1090-5
3. Goodman ZD, Ishak KG, Langloss JM, Sesterhenn IA, Rabin L. Combined hepatocellular-cholangiocarcinoma. A histologic and immunohistochemical study. Cancer. 1985;55:124-35
4. Liver Cancer Study Group of J. Primary liver cancer in Japan. Clinicopathologic features and results of surgical treatment. Annals of surgery. 1990;211:277-87
5. Allen RA, Lisa JR. Combined liver cell and bile duct carcinoma. The American journal of pathology. 1949;25:647-55
6. Jarnagin WR, Weber S, Tickoo SK, Koea JB, Obiekwe S, Fong Y. et al. Combined hepatocellular and cholangiocarcinoma: demographic, clinical, and prognostic factors. Cancer. 2002;94:2040-6
7. Yin X, Zhang BH, Qiu SJ, Ren ZG, Zhou J, Chen XH. et al. Combined hepatocellular carcinoma and cholangiocarcinoma: clinical features, treatment modalities, and prognosis. Annals of surgical oncology. 2012;19:2869-76
8. Lee SD, Park SJ, Han SS, Kim SH, Kim YK, Lee SA. et al. Clinicopathological features and prognosis of combined hepatocellular carcinoma and cholangiocarcinoma after surgery. Hepatobiliary & pancreatic diseases international: HBPD INT. 2014;13:594-601
9. Lee MH, Yang HI, Liu J, Batrla-Utermann R, Jen CL, Iloeje UH. et al. Prediction models of long-term cirrhosis and hepatocellular carcinoma risk in chronic hepatitis B patients: risk scores integrating host and virus profiles. Hepatology. 2013;58:546-54
10. Berhane S, Toyoda H, Tada T, Kumada T, Kagebayashi C, Satomura S. et al. Role of the GALAD and BALAD-2 Serologic Models in Diagnosis of Hepatocellular Carcinoma and Prediction of Survival in Patients. Clin Gastroenterol Hepatol. 2016;14(e6):875-86
11. Ariizumi S, Kotera Y, Katagiri S, Nakano M, Yamamoto M. Combined hepatocellular-cholangiocarcinoma had poor outcomes after hepatectomy regardless of Allen and Lisa class or the predominance of intrahepatic cholangiocarcinoma cells within the tumor. Annals of surgical oncology. 2012;19:1628-36
12. Nakamura S, Suzuki S, Sakaguchi T, Serizawa A, Konno H, Baba S. et al. Surgical treatment of patients with mixed hepatocellular carcinoma and cholangiocarcinoma. Cancer. 1996;78:1671-6
13. Ebied O, Federle MP, Blachar A, Brancatelli G, Grazioli L, Cazals-Hatem D. et al. Hepatocellular-cholangiocarcinoma: helical computed tomography findings in 30 patients. J Comput Assist Tomogr. 2003;27:117-24
14. Nishie A, Yoshimitsu K, Asayama Y, Irie H, Aibe H, Tajima T. et al. Detection of combined hepatocellular and cholangiocarcinomas on enhanced CT: comparison with histologic findings. AJR Am J Roentgenol. 2005;184:1157-62
15. Li R, Yang D, Tang CL, Cai P, Ma KS, Ding SY. et al. Combined hepatocellular carcinoma and cholangiocarcinoma (biphenotypic) tumors: clinical characteristics, imaging features of contrast-enhanced ultrasound and computed tomography. BMC cancer. 2016;16:158
16. EASL-EORTC clinical practice guidelines. management of hepatocellular carcinoma. Journal of hepatology. 2012;56:908-43
17. Kim JH, Yoon HK, Ko GY, Gwon DI, Jang CS, Song HY. et al. Nonresectable combined hepatocellular carcinoma and cholangiocarcinoma: analysis of the response and prognostic factors after transcatheter arterial chemoembolization. Radiology. 2010;255:270-7
18. Sapisochin G, de Lope CR, Gastaca M, de Urbina JO, Lopez-Andujar R, Palacios F. et al. Intrahepatic cholangiocarcinoma or mixed hepatocellular-cholangiocarcinoma in patients undergoing liver transplantation: a Spanish matched cohort multicenter study. Annals of surgery. 2014;259:944-52
19. Sapisochin G, Fidelman N, Roberts JP, Yao FY. Mixed hepatocellular cholangiocarcinoma and intrahepatic cholangiocarcinoma in patients undergoing transplantation for hepatocellular carcinoma. Liver transplantation: official publication of the American Association for the Study of Liver Diseases and the International Liver Transplantation Society. 2011;17:934-42
20. Liu CL, Fan ST, Lo CM, Ng IO, Lam CM, Poon RT. et al. Hepatic resection for combined hepatocellular and cholangiocarcinoma. Archives of surgery (Chicago, Ill: 1960). 2003;138:86-90
21. Yeh MM. Pathology of combined hepatocellular-cholangiocarcinoma. Journal of gastroenterology and hepatology. 2010;25:1485-92
22. Theise N, Nakashima O, Park YN, Nakanuma Y. WHO classification of tumours of the digestive system. Lyon, France: IARC: 225-7. 2010
23. Poon RT, Fan ST, Ng IO, Wong J. Prognosis after hepatic resection for stage IVA hepatocellular carcinoma: a need for reclassification. Annals of surgery. 2003;237:376-83
24. Boursi B, Finkelman B, Giantonio BJ, Haynes K, Rustgi AK, Rhim AD. et al. A Clinical Prediction Model to Assess Risk for Pancreatic Cancer Among Patients with New-onset Diabetes. Gastroenterology. 2016
25. Glance LG, Osler TM, Mukamel DB, Meredith W, Dick AW. Impact of statistical approaches for handling missing data on trauma center quality. Annals of surgery. 2009;249:143-8
26. Edwards JK, Cole SR, Westreich D, Crane H, Eron JJ, Mathews WC. et al. Multiple Imputation to Account for Measurement Error in Marginal Structural Models. Epidemiology. 2015;26:645-52
27. Cole SR, Chu H, Greenland S. Multiple-imputation for measurement-error correction. Int J Epidemiol. 2006;35:1074-81
28. Tang W, Wu X, Jiang R, Li Y. Epistatic module detection for case-control studies: a Bayesian model with a Gibbs sampling strategy. PLoS Genet. 2009;5:e1000464
29. Qian G, Rao CR, Sun X, Wu Y. Boosting association rule mining in large datasets via Gibbs sampling. Proceedings of the National Academy of Sciences of the United States of America. 2016;113:4958-63
30. Anchang B, Sadeh MJ, Jacob J, Tresch A, Vlad MO, Oefner PJ. et al. Modeling the temporal interplay of molecular signaling and gene expression by using dynamic nested effects models. Proceedings of the National Academy of Sciences of the United States of America. 2009;106:6447-52
31. Metz CE. Basic principles of ROC analysis. Semin Nucl Med. 1978;8:283-98
32. Woo Y, Son T, Song K, Okumura N, Hu Y, Cho GS. et al. A Novel Prediction Model of Prognosis After Gastrectomy for Gastric Carcinoma: Development and Validation Using Asian Databases. Annals of surgery. 2016;264:114-20
33. Harrell FE Jr, Lee KL, Mark DB. Multivariable prognostic models: issues in developing models, evaluating assumptions and adequacy, and measuring and reducing errors. Stat Med. 1996;15:361-87
34. Kassahun WT, Hauss J. Management of combined hepatocellular and cholangiocarcinoma. Int J Clin Pract. 2008;62:1271-8
35. Koh KC, Lee H, Choi MS, Lee JH, Paik SW, Yoo BC. et al. Clinicopathologic features and prognosis of combined hepatocellular cholangiocarcinoma. Am J Surg. 2005;189:120-5
36. Empereur-Mot C, Guillemain H, Latouche A, Zagury JF, Viallon V, Montes M. Predictiveness curves in virtual screening. J Cheminform. 2015;7:52
37. Pepe MS, Feng Z, Huang Y, Longton G, Prentice R, Thompson IM. et al. Integrating the predictiveness of a marker with its performance as a classifier. Am J Epidemiol. 2008;167:362-8
38. Huang Y, Pepe MS. A parametric ROC model-based approach for evaluating the predictiveness of continuous markers in case-control studies. Biometrics. 2009;65:1133-44
39. Viallon V, Latouche A. Discrimination measures for survival outcomes: connection between the AUC and the predictiveness curve. Biometrical journal Biometrische Zeitschrift. 2011;53:217-36
40. Kattan MW, Gonen M, Jarnagin WR, DeMatteo R, D'Angelica M, Weiser M. et al. A nomogram for predicting disease-specific survival after hepatic resection for metastatic colorectal cancer. Annals of surgery. 2008;247:282-7
41. Novotny AR, Schuhmacher C, Busch R, Kattan MW, Brennan MF, Siewert JR. Predicting individual survival after gastric cancer resection: validation of a U.S.-derived nomogram at a single high-volume center in Europe. Annals of surgery. 2006;243:74-81
42. Albert JM, Liu DD, Shen Y, Pan IW, Shih YC, Hoffman KE. et al. Nomogram to predict the benefit of radiation for older patients with breast cancer treated with conservative surgery. Journal of clinical oncology: official journal of the American Society of Clinical Oncology. 2012;30:2837-43
43. Graesslin O, Abdulkarim BS, Coutant C, Huguet F, Gabos Z, Hsu L. et al. Nomogram to predict subsequent brain metastasis in patients with metastatic breast cancer. Journal of clinical oncology: official journal of the American Society of Clinical Oncology. 2010;28:2032-7
44. Wang SJ, Lemieux A, Kalpathy-Cramer J, Ord CB, Walker GV, Fuller CD. et al. Nomogram for predicting the benefit of adjuvant chemoradiotherapy for resected gallbladder cancer. Journal of clinical oncology: official journal of the American Society of Clinical Oncology. 2011;29:4627-32
45. Kawai K, Ishihara S, Yamaguchi H, Sunami E, Kitayama J, Miyata H. et al. Nomogram prediction of metachronous colorectal neoplasms in patients with colorectal cancer. Annals of surgery. 2015;261:926-32
46. Li T, Wang SK, Zhou J, Sun HC, Qiu SJ, Ye QH. et al. Positive HBcAb is associated with higher risk of early recurrence and poorer survival after curative resection of HBV-related HCC. Liver international: official journal of the International Association for the Study of the Liver. 2015
47. Nishikawa H, Osaki Y, Arimoto A, Kita R, Kimura T. Relation between antibody to hepatitis B core antigen and survival after curative therapy for non-B non-C hepatocellular carcinoma. Anticancer research. 2013;33:2211-9
48. Gross-Goupil M, Saffroy R, Azoulay D, Precetti S, Emile JF, Delvart V. et al. Real-time quantification of AFP mRNA to assess hematogenous dissemination after transarterial chemoembolization of hepatocellular carcinoma. Annals of surgery. 2003;238:241-8
49. Lu MD, Yin XY, Xie XY, Xu HX, Xu ZF, Liu GJ. et al. Percutaneous thermal ablation for recurrent hepatocellular carcinoma after hepatectomy. The British journal of surgery. 2005;92:1393-8
50. Zhou XD, Tang ZY, Fan J, Zhou J, Wu ZQ, Qin LX. et al. Intrahepatic cholangiocarcinoma: report of 272 patients compared with 5,829 patients with hepatocellular carcinoma. Journal of cancer research and clinical oncology. 2009;135:1073-80
51. Wang Y, Li J, Xia Y, Gong R, Wang K, Yan Z. et al. Prognostic nomogram for intrahepatic cholangiocarcinoma after partial hepatectomy. Journal of clinical oncology: official journal of the American Society of Clinical Oncology. 2013;31:1188-95
Author contact
![]() Corresponding author: Dr. Ying-Hong Shi, Department of Liver Surgery, Liver Cancer Institute, Zhongshan Hospital, Fudan University, 180 FengLin Road, Shanghai, 200032, China. Tel.: (+86)-21-64041990-608621; Fax: (+86)-21-64037181. E-mail: shi.yinghongsh.cn or to Dr. Jia Fan, Department of Liver Surgery, Liver Cancer Institute, Zhongshan Hospital, Fudan University, 180 FengLin Road, Shanghai, 200032, China. Tel.: (+86)-21-64041990-680774; Fax: (+86)-21-64037181; E-mail: fan.jiash.cn
Corresponding author: Dr. Ying-Hong Shi, Department of Liver Surgery, Liver Cancer Institute, Zhongshan Hospital, Fudan University, 180 FengLin Road, Shanghai, 200032, China. Tel.: (+86)-21-64041990-608621; Fax: (+86)-21-64037181. E-mail: shi.yinghongsh.cn or to Dr. Jia Fan, Department of Liver Surgery, Liver Cancer Institute, Zhongshan Hospital, Fudan University, 180 FengLin Road, Shanghai, 200032, China. Tel.: (+86)-21-64041990-680774; Fax: (+86)-21-64037181; E-mail: fan.jiash.cn