Impact Factor ISSN: 1837-9664

 Global reach, higher impact
J Cancer 2018; 9(9):1667-1679. doi:10.7150/jca.24109 This issue Cite
Research Paper
Surgical management of periampullary adenocarcinoma: defining an optimal prognostic lymph node stratification schema
Chaobin He*, Yize Mao*, Jun Wang, Xin Huang, Xiaojun Lin, Shengping Li ![]()
Department of Hepatobiliary and Pancreatic Surgery, State Key Laboratory of Oncology in South China, Collaborative Innovation Center for Cancer Medicine, Sun Yat-sen University Cancer Center, Guangzhou, Guangdong, 510060, P.R. China.
*These authors contributed equally to this work.
Received 2017-11-30; Accepted 2018-1-23; Published 2018-4-18
Abstract
Background: Lymph node (LN) metastasis is a strong predictor of unfavorable prognosis for patients with periampullary adenocarcinoma after surgical resection. We sought to assess the prognostic performance of several LN staging systems, including American Joint Committee on Cancer (AJCC)/ International Union Against Cancer (7th edition) N stage, the total number of LN (TLN), the number of metastatic LN (MLN), the lymph node ratio (LNR) and the log odds of MLNs (LODDS), in patients with periampullary adenocarcinoma after surgical resection and identify the optional LN staging system to accurately stratify patients with different prognoses.
Methods: We retrospectively analyzed 205 patients with periampullary adenocarcinoma after surgical resection. The predictive effects of several LN staging systems on overall survival (OS) and progression free survival (PFS) for all included patients and patients with more than 12 TLNs examined were evaluated and compared using the time-dependent receive operating characteristic (ROC) curve and decision curve analysis (DCA), respectively.
Results: Eighty-nine patients (43.4%) had LN metastasis and their survival was not significantly decreased compared with patients without LN metastasis. LODDS and LNR were able to stratify patients into various subgroups with significant differences of both OS and PFS. When assessed using ROC curve and DCA, LODDS outperformed LNR and other LN staging systems in predicting OS and PFS. In addition, when analyzed in patients with more than 12 TLNs examined, LODDS had a higher value of area under ROC curve (AUC) and showed better performance of DCA.
Conclusion: LODDS performs better than other LN staging systems in predicting OS and PFS for patients with periampullary adenocarcinoma after surgical resection. Adequate LN dissection is necessary for curative surgery, as well as to achieve a more accurate staging of the disease and a more precise prediction of survival for these patients.
Keywords: Periampullary adenocarcinoma, Lymph node metastasis, Lymph node staging system, Number of metastatic lymph node
Introduction
The periampullary region is a complex region which is composed of distinct anatomical structures: the head of the pancreas, distal common bile duct (CBD), second portion of the duodenum, and ampulla of vater. Periampullary adenocarcinoma is now classified by their anatomic location of origin according to the 7th edition of American Joint Committee on Cancer (AJCC) staging system [1]. Although periampullary adenocarcinoma accounts for approximately 0.2% of all gastrointestinal tract tumors [2] and is a relatively uncommon neoplasm, there is an increasing trend of occurrence in recent years [3]. Periampullary adenocarcinoma is the most common malignancy for which patients receive pancreaticoduodenectomy (PD). The resectability is often limited by early local invasion of the surrounding anatomical structures, such as superior mesenteric vein and superior mesenteric artery. Only 15-20% of the periampullary adenocarcinomas are resectable at diagnosis due to the absence of early detection methods [4]. What is more, although the advances in surgical technique and adjuvant therapies have improved the outcomes of those patients, the progress has been slow. Accurate staging and establishing clinically useful prognostic factors are essential. Many negative prognostic factors, such as positive resection margins, microvascular invasion, perineural and lymphatic invasion, larger tumor size and low histological differentiation, have been clearly clarified for patients with periampullary adenocarcinoma [2, 5-8]. When compared with other prognostic factors, the presence of lymph node (LN) metastasis has been suggested as one of strongest predictors of survival in patients with periampullary adenocarcinoma [9-11].
Traditionally, the 7th edition of AJCC staging system provides LN classification according to absence or presence of metastasis of LN [1]. The utilization of LN status (positive vs. negative) or the absolute number of positive LNs for prognostic purposes may lead to dispute. Inadequate surgical lymphadenectomy or inadequate histopathologic examination of the resected specimen may contribute to the under-staging of patients. Rather than a simple binary designation of LN status, the lymph node ratio (LNR) which was defined as the ratio of number of metastatic LNs (MLN) relative to the total number of LN (TLN) examined, has been proposed to be a sensitive indicator of survival in patients with periampullary adenocarcinoma in many studies [12, 13]. However, LNR may lead to misunderstanding for predicting the prognosis of patients with all MLNs or without MLNs [14]. What is more, the log odds of MLNs (LODDS) was also proved as an alternative LN staging method with prognostic value, which was defined as the natural logarithm of the ratio of the probability of an LN to contain tumor cells versus the probability of an LN to be free of tumor cells [15, 16].
The lymphadenectomy is recommended for patients with periampullary adenocarcinoma. However, the minimum number of TLN examined in PD is controversial. The AJCC staging system recommends at least 12 harvested nodes for accurate staging because insufficient LNs may lead to under-stage the N category in many kinds of tumors, such as gastric carcinoma or pancreatic carcinoma [1, 17-20]. In some studies, the overall number of TLN was relatively small when PD was performed [11, 12]. There are few reports which focused on the prognostic value of LODDS in patients with periampullary adenocarcinoma after surgical resection and its comparison with other LN staging methods. Therefore, the aim of this study was to examine the discriminatory power of various LN staging methods, including the AJCC pN stage, MLN, TLN, NLR and LODDS, in patients with periampullary adenocarcinoma after surgical resection. Specifically, we sought to define the prognostic performance of various LN staging methods in patients with more than 12 TLNs examined to identify the best LN staging schema.
Materials and methods
Patients
Consecutive patients with newly pathologically proven periampullary adenocarcinoma after pancreatoduodenectomy carried out between February 2009 and September 2016 at the Department of Hepatobiliary and Pancreatic surgery of Sun Yat-sen University Cancer Center were enrolled into this study. Exclusion criteria are as follows: (1) patients with major vascular invasion (superior mesenteric vein, superior mesenteric artery, or inferior vena cava) (n=28); (2) patients who underwent limited surgery (e.g. ampullectomy) (n=5); (3) microscopic or macroscopic incomplete resection (n=2); (4) patients diagnosed with distant metastasis with or without palliative therapy (n=25); (5) pathologic cell types was not adenocarcinoma (n=65); (6) patients diagnosed with other concurrent primary tumors (n=12); (7) lost to follow-up (n=18). All patients were followed up for at least 1 year after treatment. A total of 205 patients were included in this study. This study was approved by the Institutional Review Board of Sun Yat-sen University Cancer Center. All procedures performed in the present study involving human participants were in accordance with the ethical standards of institutional and/or national research committees and the 1964 Helsinki Declaration and its later amendments or similar ethical standards.
Clinical data collection
All clinical and pathological data for diagnosis were retrieved from medical records archived at Sun Yat-sen University Cancer Center. The following clinical and pathological data were collected and analyzed: age, gender, white blood cell (WBC) count, platelet (PLT) count, alanine transaminase (ALT), aspartate aminotransferase (AST), alkaline phosphatase (ALP), gamma-glutamyl transpeptidase (GGT), albumin (ALB), total bilirubin (TBIL), indirect bilirubin (IBIL), C-reactive protein (CRP), serum levels of carbohydrate antigen 19-9 (CA19-9), anatomical location, tumor differentiation, tumor diameter, macrovascular invasion, microvascular invasion, perineural and lymphatic invasion, LN metastasis, TLN, MLN, LNR, LODDS, tumor-node-metastasis (TNM) stage and chemotherapy after operation. The TNM stage was categorized according to the pathological TNM staging system issued by 7th edition of AJCC [1]. The LNR was calculated as the number of MLNs divided by the total number of TLNs [21]. The optimal cutoff value for LNR was determined using time-dependent receiver operating characteristic (ROC) curve analysis. The LODDS was calculated as log[(MLN+0.5)/(TLN-MLN+0.5)] [22]. Patients were classified on the basis of following intervals: LODDS1, LODDS < -3; LODDS2, -3 ≤ LODDS < -2; LODDS3, -2 ≤ LODDS < -1; LODDS4, -1 ≤ LODDS < 0 and LODDS5, LODDS ≥ 0. Moreover, the impact of the number of MLNs on the prognosis was evaluated using the following cut-off values: 0, 1 - 3 and > 3 MLNs, which was similar to previous studies [23]. Finally, the impact of different LN staging schemas on prognosis was analyzed in patients with more than 12 TLNs examined.
Treatment procedure
Resection was performed when there were no evidence of metastasis and no arterial involvement. A classical Whipple operation was the standard resection which was performed for all the included patients. Regional lymphadenectomy included dissection of the LNs in the hepatoduodenal ligament, along the superior mesenteric vessels, and on the surface of the pancreas. After resection a pancreaticojejunostomy, hepaticojejunostomy and gastrojejunostomy were performed. After anastomotic reconstruction, two or three silicone abdominal drains were left posterior to the pancreaticojejunostomy and hepaticojejunostomy. There were no patients who received neoadjuvant treatment in this study. After surgical resection, adjuvant chemotherapy was done according to the discretion of the attending surgeon. It was primarily recommended to patients with tumors of T2 or higher stages and/or those with LN metastasis.
Follow-up
Patients were followed up at least every 2 months during the first year and every 3 months thereafter. CA19-9 test, liver ultrasonography, CT, and MRI were selectively performed as needed. Overall survival (OS) was defined as the duration from the date of operation until death or the last follow-up. Progression free survival (PFS) was defined as the duration from the date of operation until the date when tumor progression was diagnosed or the last follow-up. The median follow-up period was 533 days. The last follow-up was completed on August 31, 2017.
Statistical analysis
SPSS version 22 software (SPSS Inc., Chicago, IL, USA) was used to analyze the data. The laboratory threshold was used as cutoff value for each clinical data. Variables between two independent groups were compared using the Pearson Chi-squared test, Fisher's exact test, or the Mann-Whitney U test as appropriate. OS and PFS were estimated using the Kaplan-Meier method and compared using the log-rank test. Analyses for survival curves were performed using MedCalc software version 11.4.2.0 (MedCalc, Ostend, Belgium). The Cox regression analysis was used for both univariate analyses and multivariate analyses. Multivariate analysis was performed for variables which were significantly associated with OS or PFS in the univariate analysis, and the corresponding 95% confidence intervals (CIs) were calculated. Two-tailed P values less than 0.05 were considered statistically significant.
The discriminatory ability of the LN staging schemas was quantified by the values of areas under ROC curves (AUC). The analyses and comparisons of the time-dependent ROC curves and the decision curve analyses (DCA) were performed using R version 3.4.2 software (The R Foundation for Statistical Computing, Vienna, Austria. http://www.r-project.org).
Results
Patient characteristics
Of the 205 patients with periampullary adenocarcinoma who underwent pancreatoduodenectomy, 116 patients had no LN metastasis (56.6%) and 89 patients had LN metastasis (43.4%). Ampullary adenocarcinoma was the most common diagnosis (123 patients, 60%), followed by pancreatic adenocarcinoma (67 patients, 32.7%) and duodenal adenocarcinoma (15 patients, 7.3%). Baseline characteristics of patients are shown in Table 1. The median age of all patients was 56.2 years (range 25-84 years). Most of the patients (128 patients, 62.4%) were men in the whole study cohort. Patients who had LN metastasis were more likely to have pathological microvascular invasion (P < 0.001), perineural and lymphatic invasion (P < 0.001) and a more advanced TNM stage (P < 0.001). The proportion of receiving chemotherapy was higher for patients with LN metastasis (P = 0.004). Both groups were similar with respect to age, gender, WBC, PLT, ALT, AST, ALP, GGT, ALB, TBIL, IBIL, CRP, CA19-9, anatomic location, tumor differentiation, pathological macrovascular invasion and tumor diameter.
The relationship between clinicolpathological factors and LN metastasis
| Variables | N | LN metastasis | P | ||
|---|---|---|---|---|---|
| Absent | Present | ||||
| Total | 205 | 116 | 89 | ||
| Age (year) | < 60 | 127 | 65 | 62 | 0.059 |
| ≥ 60 | 78 | 51 | 27 | ||
| Gender | Male | 128 | 72 | 56 | 1.000 |
| Female | 77 | 44 | 33 | ||
| WBC (×109/L) | < 10 | 172 | 97 | 75 | 1.000 |
| ≥ 10 | 33 | 19 | 14 | ||
| PLT (×109/L) | < 300 | 119 | 65 | 54 | 0.569 |
| ≥ 300 | 86 | 51 | 35 | ||
| ALT (U/L) | < 40 | 49 | 30 | 19 | 0.510 |
| ≥ 40 | 156 | 86 | 70 | ||
| AST (U/L) | < 45 | 47 | 30 | 17 | 0.315 |
| ≥ 45 | 158 | 86 | 72 | ||
| ALP (U/L) | < 100 | 31 | 17 | 14 | 0.846 |
| ≥ 100 | 174 | 99 | 75 | ||
| GGT (U/L) | < 50 | 25 | 16 | 9 | 0.520 |
| ≥ 50 | 180 | 100 | 80 | ||
| ALB (g/L) | < 35 | 52 | 33 | 19 | 0.262 |
| ≥ 35 | 153 | 83 | 70 | ||
| TBIL (mmol/L) | <20.5 | 38 | 25 | 13 | 0.277 |
| ≥20.5 | 167 | 91 | 76 | ||
| IBIL (mmol/L) | <15 | 87 | 49 | 38 | 1.000 |
| ≥15 | 118 | 67 | 51 | ||
| CRP (mg/L) | < 8 | 58 | 37 | 21 | 0.213 |
| ≥ 8 | 147 | 79 | 68 | ||
| CA19-9 (IU/ml) | < 35 | 63 | 41 | 22 | 0.127 |
| ≥ 35 | 142 | 75 | 67 | ||
| Anatomic location | Panceatic adenocarcinoma | 67 | 36 | 31 | 0.836 |
| Duodenal adenocarcinoma | 15 | 9 | 6 | ||
| Ampullary adenocarcinoma | 123 | 71 | 52 | ||
| Tumor differentiation | Well | 5 | 4 | 1 | 0.236 |
| Well-Moderate | 8 | 5 | 3 | ||
| Moderate | 108 | 67 | 41 | ||
| Moderate-Poor | 63 | 31 | 32 | ||
| Poor | 21 | 9 | 12 | ||
| Macrovascular invasion | Absent | 194 | 113 | 81 | 0.060 |
| Present | 11 | 3 | 8 | ||
| Microvascular invasion | Absent | 143 | 94 | 49 | <0.001 |
| Present | 62 | 22 | 40 | ||
| Perineural and lymphatic invasion | Absent | 132 | 87 | 45 | <0.001 |
| Present | 73 | 29 | 44 | ||
| TNM stage | IA | 7 | 7 | 0 | <0.001 |
| IB | 54 | 50 | 4 | ||
| IIA | 54 | 52 | 2 | ||
| IIB | 74 | 0 | 74 | ||
| III | 15 | 6 | 9 | ||
| IV | 1 | 1 | 0 | ||
| Chemotherapy | No | 120 | 78 | 42 | 0.004 |
| Yes | 85 | 38 | 47 | ||
| Tumor diameter (cm) | < 2 | 69 | 38 | 31 | 0.768 |
| ≥ 2 | 136 | 78 | 58 | ||
LN, lymph node; WBC, white blood cell count; PLT, platelet; ALT, alanine transaminase; AST, aspartate aminotransferase; ALP, alkaline phosphatase; GGT, gamma-glutamyl transpeptidase; ALB, albumin; TBIL, total bilirubin; IBIL, indirect bilirubin; CRP, C-reactive protein; CA19-9, carbohydrate antigen 19-9, TNM, tumor-node-metastasis.
OS analysis
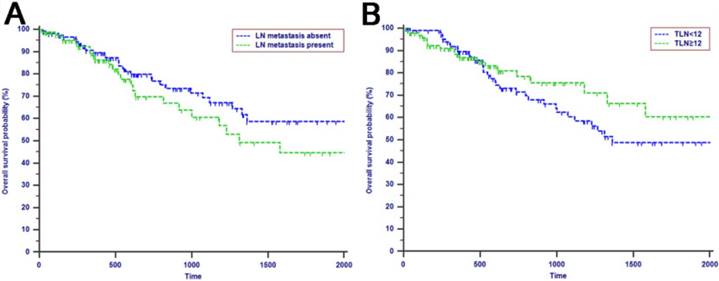
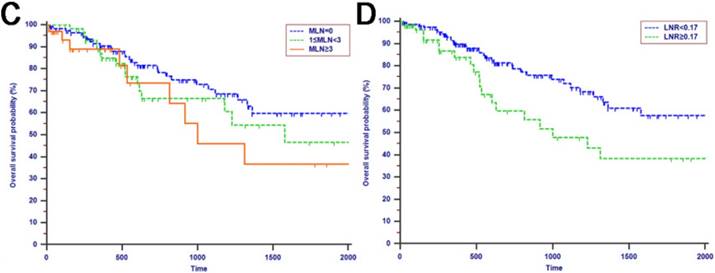
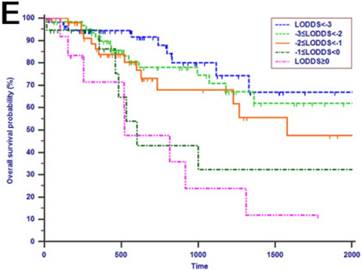
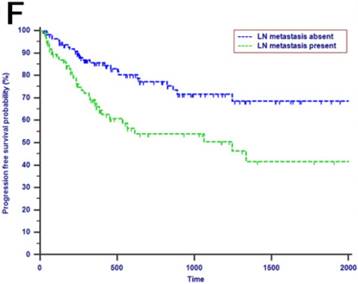
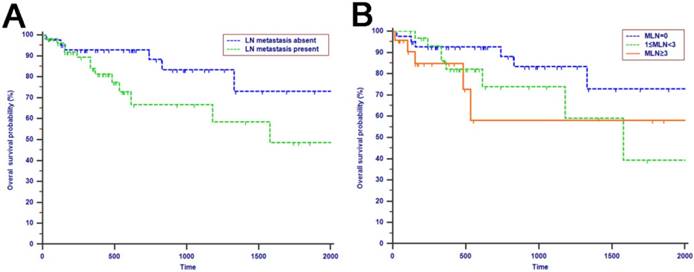
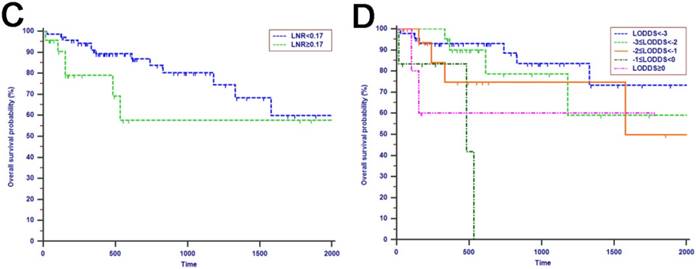
The median OS time was 533 days and the 1-year, 2-years and 3-years OS rates were 88.2%, 75.2% and 66.0%, respectively. In the univariate analysis, age, gender, WBC, PLT, ALT, AST, ALP, GGT, ALB, TBIL, IBIL, CRP, tumor differentiation, tumor diameter, macrovascular invasion, microvascular invasion, perineural and lymphatic invasion, chemotherapy, LN metastasis, TLN and MLN were not related to OS (P > 0.05). However, CA19-9, anatomic location, LNR and LODDS were significantly associated with OS (Table 2). These four risk factors were entered into the multivariate Cox regression analysis. After a stepwise removal of variables, only LODDS (HR = 1.613, 95% CI = 1.120-2.324, P = 0.010) remained as significant predictor for OS (Table 3). All the included Patients were further stratified by LN staging systems for OS analysis in this study. The differences of OS of patients who were stratified by LN metastasis, TLN and MLN were all not significant. However, the OS of patients with higher LNR values or LODDS values were significantly poorer than those with lower values of LNR (P = 0.015, Fig. 1D) or LODDS (P < 0.001, Fig. 1E). What is more, there was a significant difference in OS according to LODDS (P = 0.005) other than LNR (P = 0.074) in patients with more than 12 TLNs examined (Fig. 2).
Univariate analysis for OS and PFS in the study cohort
| Variables | OS | PFS | |||
|---|---|---|---|---|---|
| HR (95% CI) | P | HR (95% CI) | P | ||
| Age (year) | < 60/ ≥ 60 | 1.496 (0.867-2.582) | 0.148 | 0.643 (0.362-1.141) | 0.131 |
| Gender | male/ female | 1.478 (0.857-2.547) | 0.160 | 0.738 (0.425-1.283) | 0.282I |
| WBC (×109/L) | < 10/ ≥ 10 | 0.951 (0.429-2.109) | 0.902 | 1.181 (0.598-2.330) | 0.632 |
| PLT (×109/L) | < 300/ ≥ 300 | 0.683(0.387-1.207) | 0.189 | 4.766(0.660-34.444) | 0.122 |
| ALT (U/L) | < 40/ ≥ 40 | 0.869 (0.478-1.580) | 0.645 | 1.929 (0.949-3.919) | 0.069 |
| AST (U/L) | < 45/ ≥ 45 | 0.670 (0.376-1.193) | 0.174 | 1.397(0.727-2.688) | 0.316 |
| ALP (U/L) | < 100/ ≥ 100 | 0.761 (0.382-1.156) | 0.438 | 1.73(0.744-4.023) | 0.203 |
| GGT (U/L) | < 50/ ≥ 50 | 0.571 (0.294-1.109) | 0.098 | 0.906(0.430-1.909) | 0.796 |
| ALB (g/L) | < 35/ ≥ 35 | 0.987 (0.535-1.819) | 0.966 | 0.747(0.430-1.299) | 0.302 |
| TBIL (mmol/L) | <20.5/ ≥20.5 | 0.772 (0.419-1.422) | 0.406 | 2.106 (0.957-4.634) | 0.064 |
| CRP (mg/L) | < 8/ ≥ 8 | 0.914 (0.508-1.645) | 0.765 | 1.096 (0.618-1.943) | 0.753 |
| CA19-9 (U/ml) | < 35/ ≥ 35 | 2.362 (1.235-4.159) | 0.009 | 2.095(1.147-3.829) | 0.016 |
| Anatomic location | Pancreatic/Duodenal/Ampullary | 0.694(0.520-0.925) | 0.013 | 0.605 (0.460-0.794) | <0.001 |
| Tumor differentiation | W/W-M/M/M-H/H | 1.005 (0.976-1.035) | 0.740 | 1.030(1.005-1.057) | 0.020 |
| Tumor diameter (cm) | < 2/≥ 2 | 0.991 (0.557-1.765) | 0.976 | 1.486(0.828-2.666) | 0.184 |
| Macrovascular invasion | Absent / Present | 1.904 (0.265-4.518) | 0.901 | 2.169(0.865-5.439) | 0.099 |
| Microvascular invasion | Absent / Present | 1.528 (0.839-2.780) | 0.166 | 1.874(1.108-3.170) | 0.019 |
| Perineural and lymphatic invasion | Absent / Present | 1.257 (0.680-2.325) | 0.465 | 2.575(1.528-4.338) | <0.001 |
| Chemotherapy | No/Yes | 0.910 (0.529-1.566) | 0.734 | 3.886(2.191-6.890) | <0.001 |
| LN metastasis | Absent / Present | 1.408 (0.819-2.423) | 0.216 | 2.328 (1.391-3.895) | 0.001 |
| TLN | < 12/≥ 12 | 0.755 (0.430-1.324) | 0.327 | 0.802 (0.478-1.344) | 0.402 |
| MLN | 0/1-3/>3 | 1.244 (0.974-1.587) | 0.080 | 1.380 (1.111-1.716) | 0.004 |
| LNR | < 0.17/≥ 0.17 | 1.982 (1.13-3.479) | 0.017 | 1.880(1.098-3.220) | 0.021 |
| LODDS | <-3/-3~-2/-2~-1/-1~0/≥ 0 | 1.535 (1.236-1.906) | <0.001 | 1.563(1.273-1.919) | <0.001 |
TLN, total number of LN; MLN, metastatic LNs; LNR, lymph node ratio; LODDS, log odds of MLNs; W, well; M, moderate; P, poor; HR, hazard ratio; CI, confidence interval; Other abbreviations as in Table 1
Multivariate analysis for OS and PFS in the study cohort
| Variables | OS | PFS | |||
|---|---|---|---|---|---|
| HR (95% CI) | P | HR (95% CI) | P | ||
| CA19-9 (U/ml) | < 35/ ≥ 35 | 1.854 (0.951-3.613) | 0.07 | 1.516(0.793-2.901) | 0.208 |
| Anatomical location | Pancreatic/Duodenal/Ampullary | 0.767(0.576-1.021) | 0.069 | 0.761 (0.556-1.402) | 0.088 |
| Tumor differentiation | W/W-M/M/M-H/H | - | NI | 1.021(0.993-1.050) | 0.141 |
| Microvascular invasion | Absent / Present | - | NI | 1.437(0.748-2.761) | 0.276 |
| Perineural and lymphatic invasion | Absent / Present | - | NI | 1.301(0.685-2.471) | 0.422 |
| Chemotherapy | No/Yes | - | NI | 3.246(1.767-5.964) | <0.001 |
| LN metastasis | Absent / Present | - | NI | 1.118 (0.491-2.546) | 0.790 |
| MLN | 0/1-3/>3 | - | NI | 0.686 (0.413-1.142) | 0.147 |
| LNR | < 0.17/≥ 0.17 | 0.696 (0.274-1.764) | 0.446 | 0.820(0.304-2.209) | 0.694 |
| LODDS | <-3/-3~-2/-2~-1/-1~0/≥ 0 | 1.613 (1.120-2.324) | 0.010 | 1.827(1.256-2.656) | 0.002 |
NI, not include; Other abbreviations as in Table 2
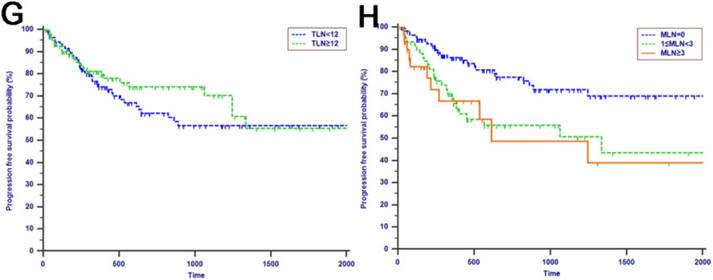
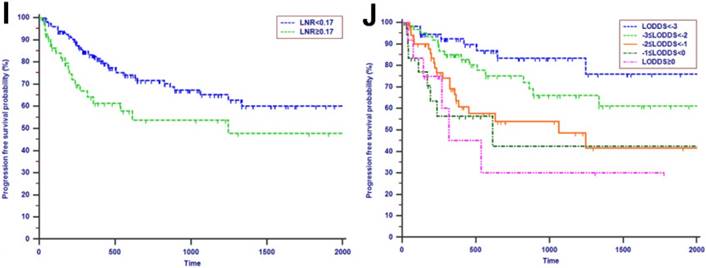
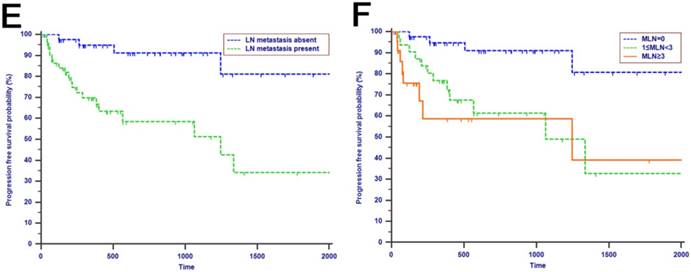
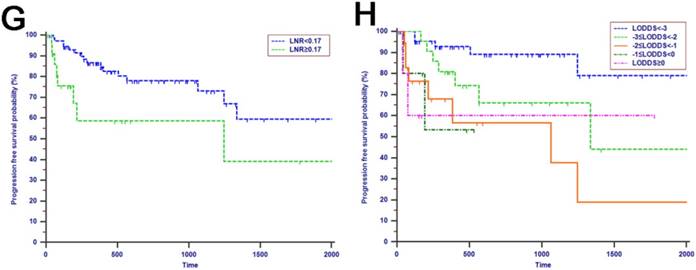
Kaplan-Meier curves of patients with periampullary adenocarcinoma after surgical resection were stratified by the LN staging system for OS analysis (A, LN metastasis, P=0.214; B, TLN, P=0.325; C, MLN, P=0.197; D, LNR, P=0.015; E, LODDS, P<0.001) and PFS analysis (F, LN metastasis, P<0.001; G, TLN, P=0.401; H, MLN, P=0.003; I, LNR, P=0.019; J, LODDS, P<0.001).
Kaplan-Meier curves of patients with more than 12 TLNs examined were stratified by the LN staging system for OS analysis (A, LN metastasis, P=0.068; B, MLN, P=0.216; C, LNR, P=0.074; D, LODDS, P=0.005) and PFS analysis (E, LN metastasis, P<0.001; F, MLN, P=0.002; G, LNR, P=0.023; H, LODDS, P=0.006).
PFS analysis
Tumor progression was observed in 60 (29.3%) patients of the whole study cohort. The median progression time was 418 days. The 1-year, 2-years and 3-years PFS rates were 77.2%, 67.3% and 62.6%, respectively. The univariate analysis revealed that CA19-9, anatomic location, tumor differentiation, microvascular invasion, perineural and lymphatic invasion, chemotherapy, LN metastasis, MLN, LNR and LODDS were all associated with PFS (P < 0.050, Table 2). Multivariate analysis was then performed in order to delineate various prognostic indicators. Variables which were significantly associated with survival status in the univariate Cox analyses were included. After adjusting for other risk factors, the multivariate analysis showed that both LODDS (HR = 1.827, 95% CI = 1.256-2.656, P = 0.002) and chemotherapy (HR = 3.246, 95% CI = 1.767-5.964, P < 0.001) remained independently associated with PFS. What is more, LODDS was the independently predictive factor for both OS and PFS (Table 3). All the included patients were further stratified by LN metastasis (P < 0.001, Fig. 1F), TLN (P = 0.401, Fig. 1G), MLN (P = 0.003, Fig. 1H), LNR (P = 0.019, Fig. 1I) and LODDS (P < 0.001, Fig. 1J), respectively for PFS analysis. The differences of PFS rates were all significant except TLN. While the PFS rates were better for patients with lower values than with higher values of all LN staging systems when they had more than 12 TLNs examined (P < 0.050, Fig. 2E-H).
ROC curve analysis of all LN staging systems
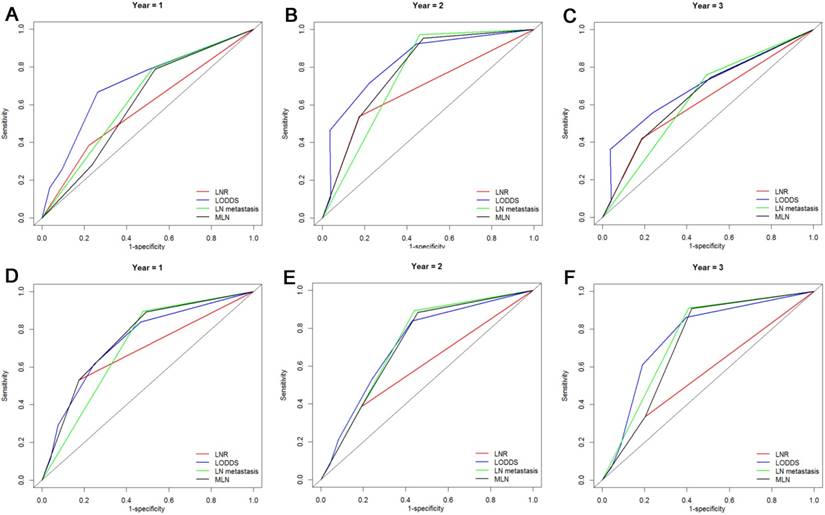
The prognostic value of LN staging systems was compared by analyzing the values of AUC at 1-year, 2-years and 3-years follow-up (Fig. 3). As shown in Table 4, the LODDS was the variable with the highest value of AUC for OS analysis and PFS analysis. What is more, the results of the cross-validated ROC analyses for patients with more than 12 TLNs examined showed that LODDS consistently had higher values of AUC at 1-year, 2-years and 3-years follow-up compared with other LN staging systems for OS analysis and PFS analysis (Fig. 4). The comparison of values of AUC implied that the AUC values had been elevated when analyzed in patients with more than 12 TLNs examined compared with the whole patients (Table 4).
Comparisons of the AUC values between LN staging systems for OS analysis at 1-year (A), 2-years (B) and 3-years (C) and PFS analysis at 1-year (D), 2-years (E) and 3-years (F) for patients with periampullary adenocarcinoma after surgical resection.
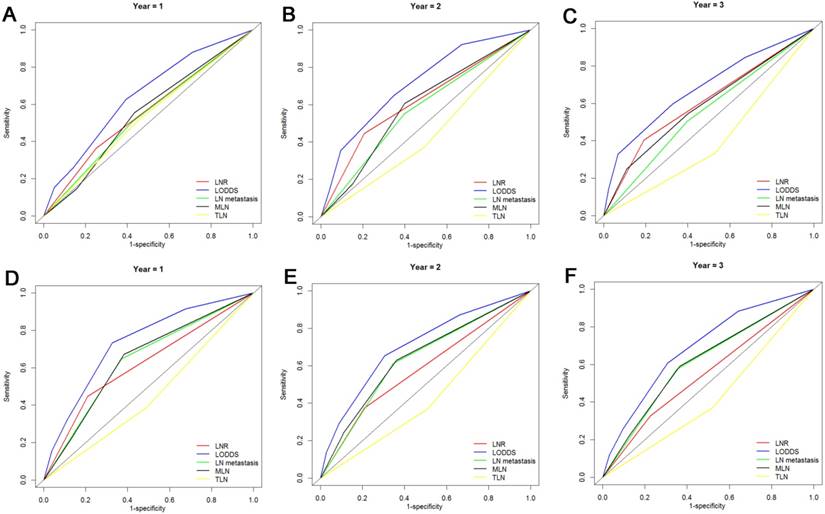
Comparison of the AUC values between LN staging systems
| LN staging system | Overall survival | Progression free survival | ||||
|---|---|---|---|---|---|---|
| 1 year | 2 years | 3 years | 1 year | 2 years | 3 years | |
| All patients | ||||||
| LN metastasis | 0.541 | 0.576 | 0.553 | 0.639 | 0.633 | 0.612 |
| TLN | 0.531 | 0.440 | 0.402 | 0.448 | 0.429 | 0.425 |
| MLN | 0.548 | 0.593 | 0.592 | 0.643 | 0.643 | 0.616 |
| LNR | 0.557 | 0.620 | 0.607 | 0.619 | 0.582 | 0.550 |
| LODDS | 0.645 | 0.714 | 0.683 | 0.732 | 0.705 | 0.692 |
| Patients with more than 12 TLNs examined | ||||||
| LN metastasis | 0.635 | 0.757 | 0.633 | 0.709 | 0.740 | 0.753 |
| MLN | 0.609 | 0.783 | 0.653 | 0.753 | 0.716 | 0.722 |
| LNR | 0.581 | 0.683 | 0.617 | 0.678 | 0.597 | 0.566 |
| LODDS | 0.711 | 0.829 | 0.696 | 0.738 | 0.720 | 0.762 |
All abbreviations as in Table 2
Comparisons of the AUC values between LN staging systems for OS analysis at 1-year (A), 2-years (B) and 3-years (C) and PFS analysis at 1-year (D), 2-years (E) and 3-years (F) for patients with more than 12 TLNs examined.
DCA of all LN staging systems
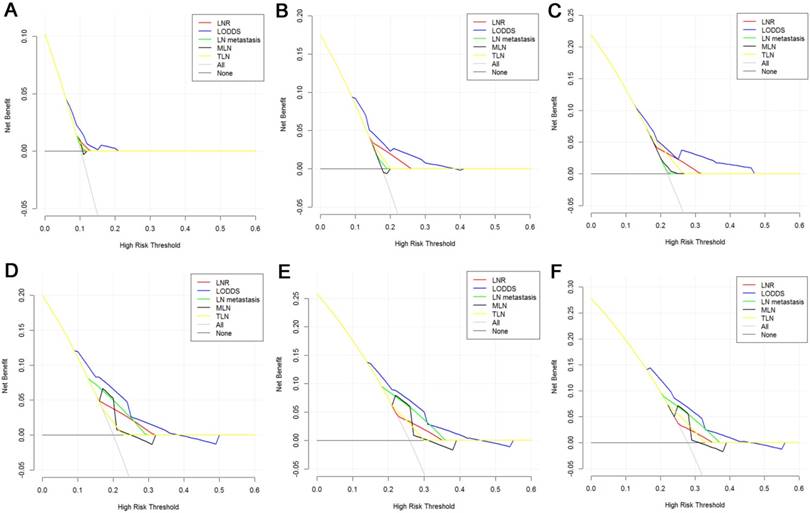
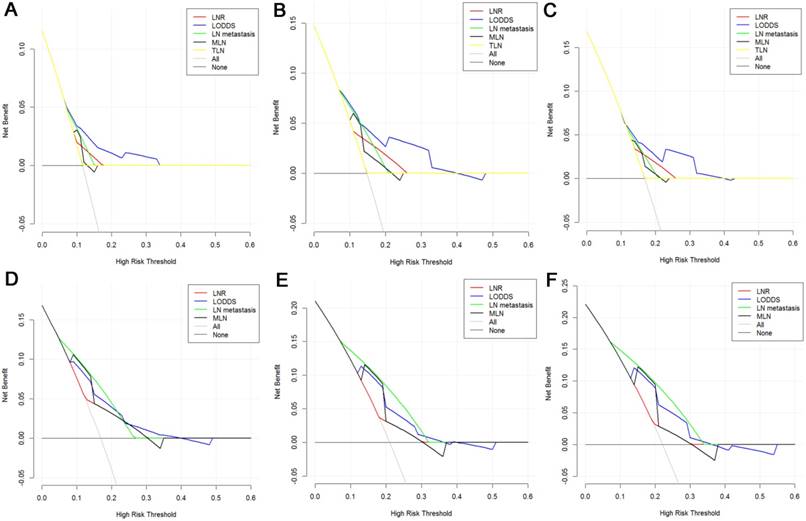
The DCA, a novel method to evaluate prediction models from the perspective of clinical consequences, revealed that compared with other models, LODDS showed superior net clinical benefit across a wider range of threshold probabilities for predicting 1-year, 2-years and 3-years OS and PFS in all patients (Fig. 5). Moreover, the LODDS also showed improved performance for OS prediction for patients with more than 12 TLNs examined. The curves of LN metastasis and LODDS remained close regardless of the threshold selected for 1-year PFS prediction while LN metastasis performed even better than LODDS in predicting 2-years and 3-years PFS (Fig. 6).
Decision curve analysis of LN staging systems for OS analysis at 1-year (A), 2-years (B) and 3-years (C) and PFS analysis at 1-year (D), 2-years (E) and 3-years (F) for patients with periampullary adenocarcinoma after surgical resection. Colored lines: clinical net benefits across a range of threshold probabilities of LN staging systems; the horizontal solid black line: to assume no patients will experience the event; the solid gray line: to assume all patients will experience the event.
Decision curve analysis of LN staging systems for OS analysis at 1-year (A), 2-years (B) and 3-years (C) and PFS analysis at 1-year (D), 2-years (E) and 3-years (F) for patients with more than 12 TLNs examined. Colored lines: clinical net benefits across a range of threshold probabilities of LN staging systems; the horizontal solid black line: to assume no patients will experience the event; the solid gray line: to assume all patients will experience the event.
Discussion
The annual incidence of periampullary adenocarcinoma is steadily on the rise [3]. The only curative therapy for periampullary adenocarcinoma is surgical resection, usually performed as PD while the curative resectable rate was only 20% [24]. The long-term survival rate is relatively poor [25] and is greatly influenced by the rate of early progression [26, 27]. Wide range of factors which predicted prognosis of patients with periampullary adenocarcinoma after surgical resection had been discussed in previous reports [28-31]. What is more, the role of LN metastasis in predicting survival in patients with periampullary adenocarcinoma was generally recognized [32-34]. However, the insufficient number of nodes harvested at the time of surgery or a relatively small number of the included patients in some studies may lead to misunderstanding of the role of LN stage [35]. Moreover, the predictive power of LN staging systems had not been discussed and compared. The “ideal” LN staging system remains controversial.
Assessment of LN involvement is considered a key factor for prognostic stratification of patients with periampullary adenocarcinoma after surgical resection. The prognostic role of some LN staging systems had been discussed in the previous studies. LNR was found to be an independent factor in pancreatic and periampullary cancer [9, 11, 33]. In the study by J.Kwon [36], LNR was proved to be associated with survival and performed well in predicting survival of patients with ampullary adenocarcinoma. Similar to previous reports, patients with LNR > 0.17 had significantly decreased OS and PFS even after adjusting for other prognostic factors in our study. However, some reports had also reported that there was no association between survival and LNR in patients with pancreatic cancer [37, 38]. Maybe the small sample size, multicollinearity of statistical analysis and the variable definition of R1 resection resulted in this discrepancy. Moreover, the LNR may be misleading when used as a prognostic tool for patients who have no metastatic LNs or all metastatic LNs regardless of the number of TLN [39]. This disadvantage may dilute the predictive power of LNR for survival analysis. Similarly, in this study, LNR was associated with OS and PFS in univariate analysis while multivariate analysis showed that LNR was not an independent indicator for OS or PFS.
There are a few studies [36] which focused on the prognostic impact of MLN in patients with periampullary adenocarcinoma. The predictive power of MLN varies greatly due to the different cutoff values adopted for survival analyses. Some reports explored the prognostic efficacy of MLN and LNR, showing that MLN outperformed LNR for survival prediction [35, 40]. However, in the study of Pawlik TM [10], LNR was showed to be able to stratify patients with similar MLN into subgroups with different prognosis.
The comparison of AUC values of LN staging systems in the present study showed that the AUC value of LNR was a little higher than that of MLN for OS analysis while the predictive efficacy of MLN for PFS analysis was even higher. It was believed that MLN could stratify patients into groups with significant survival differences, similar to the conclusion of the study with the largest cohort [41], while the predictive power could be influenced by the differences of adopted cutoff values and the scale of the study cohort.
More recently, LODDS has been actively evaluated as alternative means to interpret LN data [21, 22, 42]. The present study was the first to evaluate and compare the specific prognostic efficacy of LN metastasis, the number of TLN, the number of MLN, LNR and LODDS in patients with periampullary adenocarcinoma after surgical resection. Specifically, using a relatively large population-based cohort of patients with periampullary adenocarcinoma after surgical resection, we demonstrated that both LODDS and LNR were able to stratify patients with significantly different OS and PFS. What is more, the extensive statistical analysis which involved two different approaches (ROC curve analysis [43] and DCA [44] ), illustrated that LODDS staging system showed superior prognostic discriminatory ability for both OS and PFS analyses compared with other LN staging systems. Compared with MLN and TLN, LODDS and LNR are mathematical tools which are less influenced by the extension of LN dissection and are able to increase the LN staging reliability, while the number MLN or TLN is more frequently depending on the number of retrieved LNs. What is more, LODDS performed even better than LNR in discrimination of prognosis, especially for patients with LNR 0 or 1. In this study, it was shown that LODDS was proved to be the independent factor for both OS and PFS prediction for patients with periampullary adenocarcinoma after surgical resection. This conclusion was consistent with the result from other gastrointestinal and hepatobiliary malignancies [15, 16, 45].
On the other hand, some studies had showed that TLN was also associated with the survival and recurrence in patients with ampulla vater carcinoma [46]. The present study adopted 12 as the cutoff value of TLN for survival analysis according to the AJCC recommendation [1]. In addition, TLN > 12 was shown to associate with an even better survival [47, 48]. The long-term survival rates of patients with more than 12 TLNs examined were higher than those of patients with less than 12 TLNs examined, while the differences of survival rates were not significant in this study. Moreover, the OS of patients with LN metastasis were not significantly longer than those of patients without LN metastasis though the differences of OS were huge in this study. There was a discrepancy between our result and those of previous studies. A potential explanation for the discrepancy is that an even larger proportion of patients with LN metastasis had received chemotherapy after surgical resection which could have an effect on the long-term survival for patients. For patients with more than 12 TLNs examined, the prognostic power of LN staging systems was also compared. LODDS outperformed other LN staging systems for both OS and PFS predictions. What is more, the AUC values of survival prediction for patients with more than 12 TLNs examined were higher than those for all patients included in this study at each time point during the whole follow-up period. This suggested that LODDS performed even better as prognosticator of OS and PFS wherein TLN > 12. It was advocated that more LNs should be harvested during the process of operation or histopathologic examination of the resected specimen to obtain a more precise prediction of OS or PFS. The curves of DCA showed that LN metastasis performed better than LODDS in predicting 2-years and 3-years PFS. At the same time, the AUC value of LODDS for 2-years PFS prediction was higher than that of LN metastasis while the AUC value of LN metastasis for 3-years PFS prediction was a little higher. This implied that the efficacy was similar between LODDS and LN metastasis for PFS prediction for patients with more than 12 TLNs examined. This result needs to be validated in a larger study cohort.
This study had several limitations which should be considered when interpreting the results. First, the inherent selection bias was inevitable due to the nature of retrospective study. Second, the whole cohort was consisted of patients who were diagnosed with pancreatic adenocarcinoma, ampullary adenocarcinoma and duodenal adenocarcinoma. It will be more practical to evaluate the predictive efficacy of LN staging systems in patients with specific carcinoma. The third limitation is the lack of external validation. The conclusions in this study need to be validated in a larger scale study.
In conclusion, LODDS is superior to AJCC pN stage and other LN staging systems in the prediction of OS and PFS for patients with periampullary adenocarcinoma after surgical resection. Adequate LN dissection is necessary for curative surgery, as well as to achieve a more accurate staging of the disease and a more precise prediction of survival for patients with periampullary adenocarcinoma after surgical resection.
Acknowledgements
This work was supported by grants from the National Natural Science Foundation of China (81171890; 81672390) and the Major National Scientific Research Projects of China (No. 2013CB910304).
Competing Interests
The authors have declared that no competing interest exists.
References
1. Edge SB BD, Comptom CC, Fritz AG, Greene FL, Trotti A, eds. AJCC Cancer Staging Manual. 7th ed. New York, NY: Springer. 2010
2. Yeo CJ, Sohn TA, Cameron JL, Hruban RH, Lillemoe KD, Pitt HA. Periampullary adenocarcinoma: analysis of 5-year survivors. Annals of surgery. 1998;227:821-31
3. Siegel RL, Miller KD, Jemal A. Cancer statistics, 2016. CA: a cancer journal for clinicians. 2016;66:7-30
4. Westgaard A, Tafjord S, Farstad IN, Cvancarova M, Eide TJ, Mathisen O. et al. Pancreatobiliary versus intestinal histologic type of differentiation is an independent prognostic factor in resected periampullary adenocarcinoma. BMC cancer. 2008;8:170
5. Ueda M, Endo I, Nakashima M, Minami Y, Takeda K, Matsuo K. et al. Prognostic factors after resection of pancreatic cancer. World journal of surgery. 2009;33:104-10
6. Kure S, Kaneko T, Takeda S, Inoue S, Nakao A. Analysis of long-term survivors after surgical resection for invasive pancreatic cancer. HPB: the official journal of the International Hepato Pancreato Biliary Association. 2005;7:129-34
7. Allema JH, Reinders ME, van Gulik TM, van Leeuwen DJ, Verbeek PC, de Wit LT. et al. Results of pancreaticoduodenectomy for ampullary carcinoma and analysis of prognostic factors for survival. Surgery. 1995;117:247-53
8. Carter JT, Grenert JP, Rubenstein L, Stewart L, Way LW. Tumors of the ampulla of vater: histopathologic classification and predictors of survival. Journal of the American College of Surgeons. 2008;207:210-8
9. House MG, Gonen M, Jarnagin WR, D'Angelica M, DeMatteo RP, Fong Y. et al. Prognostic significance of pathologic nodal status in patients with resected pancreatic cancer. Journal of gastrointestinal surgery: official journal of the Society for Surgery of the Alimentary Tract. 2007;11:1549-55
10. Pawlik TM, Gleisner AL, Cameron JL, Winter JM, Assumpcao L, Lillemoe KD. et al. Prognostic relevance of lymph node ratio following pancreaticoduodenectomy for pancreatic cancer. Surgery. 2007;141:610-8
11. Sierzega M, Popiela T, Kulig J, Nowak K. The ratio of metastatic/resected lymph nodes is an independent prognostic factor in patients with node-positive pancreatic head cancer. Pancreas. 2006;33:240-5
12. Tol JA, Brosens LA, van Dieren S, van Gulik TM, Busch OR, Besselink MG. et al. Impact of lymph node ratio on survival in patients with pancreatic and periampullary cancer. The British journal of surgery. 2015;102:237-45
13. Shamseddine AI, Mukherji D, Melki C, Elias E, Eloubeidi M, Dimassi H. et al. Lymph node ratio is an independent prognostic factor after resection of periampullary malignancies: data from a tertiary referral center in the middle East. American journal of clinical oncology. 2014;37:13-8
14. Spolverato G, Ejaz A, Kim Y, Squires MH, Poultsides G, Fields RC. et al. Prognostic Performance of Different Lymph Node Staging Systems After Curative Intent Resection for Gastric Adenocarcinoma. Annals of surgery. 2015;262:991-8
15. Kim Y, Spolverato G, Amini N, Margonis GA, Gupta R, Ejaz A. et al. Surgical Management of Intrahepatic Cholangiocarcinoma: Defining an Optimal Prognostic Lymph Node Stratification Schema. Annals of surgical oncology. 2015;22:2772-8
16. Aurello P, Petrucciani N, Nigri GR, La Torre M, Magistri P, Tierno S. et al. Log odds of positive lymph nodes (LODDS): what are their role in the prognostic assessment of gastric adenocarcinoma? Journal of gastrointestinal surgery: official journal of the Society for Surgery of the Alimentary Tract. 2014;18:1254-60
17. Datta J, Lewis RS Jr, Mamtani R, Stripp D, Kelz RR, Drebin JA. et al. Implications of inadequate lymph node staging in resectable gastric cancer: a contemporary analysis using the National Cancer Data Base. Cancer. 2014;120:2855-65
18. Slidell MB, Chang DC, Cameron JL, Wolfgang C, Herman JM, Schulick RD. et al. Impact of total lymph node count and lymph node ratio on staging and survival after pancreatectomy for pancreatic adenocarcinoma: a large, population-based analysis. Annals of surgical oncology. 2008;15:165-74
19. Eskander MF, de Geus SW, Kasumova GG, Ng SC, Al-Refaie W, Ayata G. et al. Evolution and impact of lymph node dissection during pancreaticoduodenectomy for pancreatic cancer. Surgery. 2017;161:968-76
20. Liu P, Zhang X, Shang Y, Lu L, Cao F, Sun M. et al. Lymph node ratio, but not the total number of examined lymph nodes or lymph node metastasis, is a predictor of overall survival for pancreatic neuroendocrine neoplasms after surgical resection. Oncotarget. 2017;8:89245-55
21. Wang J, Hassett JM, Dayton MT, Kulaylat MN. Lymph node ratio: role in the staging of node-positive colon cancer. Annals of surgical oncology. 2008;15:1600-8
22. Wang J, Hassett JM, Dayton MT, Kulaylat MN. The prognostic superiority of log odds of positive lymph nodes in stage III colon cancer. Journal of gastrointestinal surgery: official journal of the Society for Surgery of the Alimentary Tract. 2008;12:1790-6
23. Conci S, Ruzzenente A, Sandri M, Bertuzzo F, Campagnaro T, Bagante F. et al. What is the most accurate lymph node staging method for perihilar cholangiocarcinoma? Comparison of UICC/AJCC pN stage, number of metastatic lymph nodes, lymph node ratio, and log odds of metastatic lymph nodes. European journal of surgical oncology: the journal of the European Society of Surgical Oncology and the British Association of Surgical Oncology. 2017;43:743-50
24. Kamisawa T, Wood LD, Itoi T, Takaori K. Pancreatic cancer. Lancet (London, England). 2016;388:73-85
25. van Geenen RC, van Gulik TM, Offerhaus GJ, de Wit LT, Busch OR, Obertop H. et al. Survival after pancreaticoduodenectomy for periampullary adenocarcinoma: an update. European journal of surgical oncology: the journal of the European Society of Surgical Oncology and the British Association of Surgical Oncology. 2001;27:549-57
26. Fischer R, Breidert M, Keck T, Makowiec F, Lohrmann C, Harder J. Early recurrence of pancreatic cancer after resection and during adjuvant chemotherapy. Saudi journal of gastroenterology: official journal of the Saudi Gastroenterology Association. 2012;18:118-21
27. Shimada K, Sakamoto Y, Sano T, Kosuge T. The role of paraaortic lymph node involvement on early recurrence and survival after macroscopic curative resection with extended lymphadenectomy for pancreatic carcinoma. Journal of the American College of Surgeons. 2006;203:345-52
28. Park JS, Yoon DS, Kim KS, Choi JS, Lee WJ, Chi HS. et al. Factors influencing recurrence after curative resection for ampulla of Vater carcinoma. Journal of surgical oncology. 2007;95:286-90
29. Qiao QL, Zhao YG, Ye ML, Yang YM, Zhao JX, Huang YT. et al. Carcinoma of the ampulla of Vater: factors influencing long-term survival of 127 patients with resection. World journal of surgery. 2007;31:137-43 discussion 44-6
30. Hsu HP, Yang TM, Hsieh YH, Shan YS, Lin PW. Predictors for patterns of failure after pancreaticoduodenectomy in ampullary cancer. Annals of surgical oncology. 2007;14:50-60
31. Bourgouin S, Ewald J, Mancini J, Moutardier V, Delpero JR, Le Treut YP. Disease-free survival following resection in non-ductal periampullary cancers: A retrospective multicenter analysis. International journal of surgery (London, England). 2017;42:103-9
32. Riediger H, Keck T, Wellner U, zur Hausen A, Adam U, Hopt UT. et al. The lymph node ratio is the strongest prognostic factor after resection of pancreatic cancer. Journal of gastrointestinal surgery: official journal of the Society for Surgery of the Alimentary Tract. 2009;13:1337-44
33. Berger AC, Watson JC, Ross EA, Hoffman JP. The metastatic/examined lymph node ratio is an important prognostic factor after pancreaticoduodenectomy for pancreatic adenocarcinoma. The American surgeon. 2004;70:235-40 discussion 40
34. Wennerblom J, Saksena P, Jonsson C, Thune A. Lymph node 8a as a prognostic marker for poorer prognosis in pancreatic and periampullary carcinoma. Scandinavian journal of gastroenterology. 2017:1-6
35. Zhou J, Zhang Q, Li P, Shan Y, Zhao D, Cai J. Prognostic relevance of number and ratio of metastatic lymph nodes in resected carcinoma of the ampulla of Vater. Chinese journal of cancer research = Chung-kuo yen cheng yen chiu. 2013;25:735-42
36. Kwon J, Kim K, Chie EK, Kim BH, Jang JY, Kim SW. et al. Prognostic relevance of lymph node status for patients with ampullary adenocarcinoma after radical resection followed by adjuvant treatment. European journal of surgical oncology: the journal of the European Society of Surgical Oncology and the British Association of Surgical Oncology. 2017;43:1690-6
37. Kang MJ, Jang JY, Chang YR, Kwon W, Jung W, Kim SW. Revisiting the concept of lymph node metastases of pancreatic head cancer: number of metastatic lymph nodes and lymph node ratio according to N stage. Annals of surgical oncology. 2014;21:1545-51
38. Wagner M, Redaelli C, Lietz M, Seiler CA, Friess H, Buchler MW. Curative resection is the single most important factor determining outcome in patients with pancreatic adenocarcinoma. The British journal of surgery. 2004;91:586-94
39. Amini N, Spolverato G, Kim Y, Gupta R, Margonis GA, Ejaz A. et al. Lymph node status after resection for gallbladder adenocarcinoma: prognostic implications of different nodal staging/scoring systems. Journal of surgical oncology. 2015;111:299-305
40. Sakata J, Shirai Y, Wakai T, Ajioka Y, Akazawa K, Hatakeyama K. Assessment of the nodal status in ampullary carcinoma: the number of positive lymph nodes versus the lymph node ratio. World journal of surgery. 2011;35:2118-24
41. Kang HJ, Eo SH, Kim SC, Park KM, Lee YJ, Lee SK. et al. Increased number of metastatic lymph nodes in adenocarcinoma of the ampulla of Vater as a prognostic factor: a proposal of new nodal classification. Surgery. 2014;155:74-84
42. Morales-Oyarvide V, Rubinson DA, Dunne RF, Kozak MM, Bui JL, Yuan C. et al. Lymph node metastases in resected pancreatic ductal adenocarcinoma: predictors of disease recurrence and survival. British journal of cancer. 2017;117:1874-82
43. Kamarudin AN, Cox T, Kolamunnage-Dona R. Time-dependent ROC curve analysis in medical research: current methods and applications. BMC medical research methodology. 2017;17:53
44. Vickers AJ, Elkin EB. Decision curve analysis: a novel method for evaluating prediction models. Medical decision making: an international journal of the Society for Medical Decision Making. 2006;26:565-74
45. La Torre M, Nigri G, Petrucciani N, Cavallini M, Aurello P, Cosenza G. et al. Prognostic assessment of different lymph node staging methods for pancreatic cancer with R0 resection: pN staging, lymph node ratio, log odds of positive lymph nodes. Pancreatology: official journal of the International Association of Pancreatology (IAP) [et al]. 2014;14:289-94
46. Falconi M, Crippa S, Dominguez I, Barugola G, Capelli P, Marcucci S. et al. Prognostic relevance of lymph node ratio and number of resected nodes after curative resection of ampulla of Vater carcinoma. Annals of surgical oncology. 2008;15:3178-86
47. Partelli S, Crippa S, Capelli P, Neri A, Bassi C, Zamboni G. et al. Adequacy of lymph node retrieval for ampullary cancer and its association with improved staging and survival. World journal of surgery. 2013;37:1397-404
48. Doepker MP, Thompson ZJ, Centeno BA, Kim RD, Wong J, Hodul PJ. Clinicopathologic and survival analysis of resected ampullary adenocarcinoma. Journal of surgical oncology. 2016;114:170-5
Author contact
![]() Corresponding author: Shengping Li, Department of Hepatobiliary and Pancreatic Surgery, State Key Laboratory of Oncology in South China, Collaborative Innovation Center for Cancer Medicine, Sun Yat-sen University Cancer Center, Guangzhou, Guangdong, 510060, P.R. China. E-mail: lishporg.cn
Corresponding author: Shengping Li, Department of Hepatobiliary and Pancreatic Surgery, State Key Laboratory of Oncology in South China, Collaborative Innovation Center for Cancer Medicine, Sun Yat-sen University Cancer Center, Guangzhou, Guangdong, 510060, P.R. China. E-mail: lishporg.cn