Impact Factor ISSN: 1837-9664

 Global reach, higher impact
J Cancer 2018; 9(10):1737-1744. doi:10.7150/jca.24836 This issue Cite
Research Paper
A predicting model of bone marrow malignant infiltration in 18F-FDG PET/CT images with increased diffuse bone marrow FDG uptake
Mingge Zhou1*, Yumei Chen1*, Jianjun Liu1, Gang Huang1,2,3 ![]()
1. Department of Nuclear Medicine, Ren Ji Hospital, School of Medicine, Shanghai Jiao Tong University, Shanghai, China
2. Department of Cancer Metabolism, Institute of Health Sciences, Chinese Academy of Sciences and Shanghai Jiao Tong University School of Medicine, Shanghai, China
3. Key Lab. For Molecular Biology & Imaging, Shanghai University of Medicine and Health Sciences, Shanghai, China
*Zhou M and Chen Y contributed equally to this work.
Received 2018-1-9; Accepted 2018-2-1; Published 2018-4-19
Abstract
Purpose: To demonstrate the relationship between the etiologies of increased diffuse bone marrow (BM) 18F-FDG uptake and PET/CT imaging/clinical features, as well as to explore a predicting model of BM malignant infiltration (MI) based on decision tree.
Methods: 84 patients with increased diffuse BM uptake were retrospectively enrolled. Their complete case record and PET/CT images were reviewed, with the maximal standardized uptake values of bone marrow (SUVmaxBM) and other imaging/clinical features were noted. At the same time, the differences in imaging/clinical features between bone marrow MI and non-MI groups were compared. The decision tree for predicting MI was established by C5.0 component of SPSS Clementine.
Results: In patients with homogenously increased BM uptake, 21 patients had MI resulted from leukemia, lymphoma and small cell lung cancer (SCLC). MI group had higher SUVmaxBM than non-MI group (6.7±3.1 vs 4.2±0.9, p=0.001). However, a considerable proportion of MI patients had similar SUVmaxBM to non-MI patients, which were mainly seen in lymphoplasmacytic lymphoma/Waldenström macroglobulinemia (LPL/WM), chronic myeloid leukemia (CML) and multiple myeloma (MM). There were significant differences in other factors between the two groups. MI patients were highly associated with SUVmaxAP/AX≥1 (the ratio of SUVmaxBM of appendicular skeleton to that of axial skeleton), hepatosplenomegaly, older age and lower rate of fever. The decision tree combining SUVmaxBM, SUVmaxAP/AX, fever and hepatosplenomegaly achieved a sensitivity of 81.0%, a specificity of 98.4% and an accuracy of 94.0% for predicting MI.
Conclusion: Increased diffuse BM 18F-FDG uptake can be attributed to both bone marrow MI and benign etiologies. A decision tree based on C5.0 algorithm, combining PET/CT imaging and clinical features, is of potential use in discriminating BM malignant infiltration from patients with increased diffuse BM uptake.
Keywords: bone marrow, malignant infiltration, predicting model, PET/CT, SUVmax
Introduction
18F-FDG is the main radioactive tracer used in PET/CT imaging in detecting the elevated metabolic level that is a hallmark of cancer [1]. It has been widely used in the diagnosis of malignancies. However, increased FDG accumulation doesn't necessarily imply malignant tumors. It can also be caused by a variety of increased metabolic states, thus sometimes leading to false positive.
PET/CT images with homogenously diffuse FDG bone marrow uptake higher than normal liver uptake are often seen in our clinical practice. Increased BM uptake reflects elevated glucose metabolism, which can be attributed to many reasons including bone marrow hyperplasia, inflammation/infection and malignant infiltration [2-6]. Recent administration of hematopoietic cytokines also causes the increased diffuse BM uptake and often mimics BM malignant infiltration [7, 8]. It has been proven that the BM malignant infiltration is often associated with poor outcomes in a variety of malignancies such as lymphoma and breast cancer [9, 10]. Some studies showed that many patients with increased diffuse BM uptake had malignant infiltration [2, 4, 5, 11]. Bone marrow biopsy (BMB) is the gold standard for diagnosing BM malignant infiltration, however it is an invasive procedure with complications such as pain, hemorrhage and infection[12]. Therefore, finding a noninvasive diagnosing method is crucial for patients with high risk of bone marrow MI as it helps guide BM biopsy and omits unnecessary BMB tests. By far, no studies were available to evaluate the diagnostic value of PET/CT imaging on identifying the malignant infiltration from the patients with increased diffuse BM uptake.
In this study, we use C5.0 to establish a decision tree to diagnose BM malignant infiltration. C5.0 is a top-down induction algorithm. It selects an attribute that best separates the classes of data to build a decision tree [13]. The present study is aimed at exploring a predicting model for increased diffuse BM uptake based on the decision tree, and evaluating the ability of the model in discriminating patients with high risk of bone marrow malignant infiltration.
Materials and methods
Study Population
The study has been approved by the institutional review board of Ren Ji Hospital, School of Medicine, Shanghai Jiao Tong University. Maximum intensity projection (MIP) images from the PET/CT imaging database, between 2012 and 2015, were reviewed. Totally, 14304 MIP images were reviewed, and 483 patients exhibited diffuse BM pattern. The inclusion criteria were as follows: the FDG uptake on BM was diffusely increased (higher than that on normal liver); no recent administration of hematopoietic cytokines before PET/CT examinations; bone marrow biopsy was done within one week; complete case records and clinical follow-up of at least 6 months were available. 297 patients were excluded due to recent administration of hematopoietic cytokines, and 32 patients were due to the loss of follow-up. 70 patients did not receive BM biopsy and were also be excluded. Finally 84 patients (mean age, 49 years; age range, 18-80 years) were enrolled in the present study. There were 41 men (mean age, 51 years; age range, 18-78 years) and 43 women (mean age, 48 years; age range, 19-80 years). There was no significant difference in age between men and women (p=0.326). The bone marrow MI was confirmed by BMB. The types of leukemia were confirmed by morphology, immunology, cytogenetics and molecular (MICM). Patients with no positive BMB results nor disease progress in clinical follow-up of at least 6 months were considered to have no bone marrow MI.
18F-FDG PET/CT Procedures
All PET/CT images were acquired by dedicated PET/CT scanner (Biograph 64 rows of PET/CT; Siemens, Germany). All patients received an intravenous injection of 18F FDG (0.1mCi/kg, 3.7MBq/kg) after fasting for at least six hours. Blood glucose was measured before the injection to confirm it was lower than 7.0 mmol/L. PET/CT scans were performed about 50 minutes post-injection. CT scans were acquired 120 kV and 140 mA with a section width of 5.0 mm. PET images were reconstructed iteratively with CT data for attenuation correction.
18F-FDG PET/CT interpretations
The 18F-FDG PET/CT images were independently analyzed by two experienced nuclear medicine physicians blinded from any clinical information. SUVmaxBM was measured on axial, appendicular skeleton and normal liver. When measuring SUVmaxBM, we excluded the bone regions with the degenerative changes in the region of interest (ROI). SUVmaxAP/AX, as was defined above, and SUVmaxBM/Liver (the ration of SUVmax of BM to that of normal liver in the same patient), were calculated. The obvious hepatosplenomegaly was also recorded.
Statistical analysis
The data were presented as mean±SD. The differences in imaging and clinical features between two groups were compared by Pearson's chi-square test and two-sided t test. ROC curve was used to estimate cutoff values for diagnosis. P<0.05 was considered to be statistically significant. All the statistical analyses above were conducted by SPSS version 20.0 (IBM corporation, NY, USA). The decision tree in our study was built by C5.0 component of SPSS Clementine version 12.0 (SPSS Inc., Chicago, IL, USA).
Results
Patient Diagnosis
Among 84 patients with increased diffuse BM uptake, 21 (25%) were diagnosed as bone marrow malignant infiltration. These included 5 leukemia, 15 non-Hodgkin lymphoma (NHL) and 1 diffuse bone marrow metastasis by SCLC. In 63 (75%) patients without bone marrow MI, there were 21 non-hematological malignancies, 10 hematological malignancies, 20 infection, 9 hematological benign diseases, 2 rheumatologic diseases and 1 Crohn's disease. All the detailed diagnoses were summarized in Table 1.
Patient diagnosis (N=84)
| Type | Diagnosis | N |
|---|---|---|
| Bone marrow MI group (N=21) | Acute lymphoblastic leukemia | 3 |
| Chronic myeloid leukemia | 2 | |
| Diffuse large B cell lymphoma | 5 | |
| T-cell lymphoma | 3 | |
| Lymphoplasmacytic lymphoma/ Waldenström macroglobulinemia | 4 | |
| Multiple myeloma | 3 | |
| Small cell lung cancer | 1 | |
| Non-MI group (N=63) | Infection | 20 |
| Non-hematological maglinancies | 21 | |
| T-cell lymphoma | 2 | |
| Diffuse large B cell lymphoma | 4 | |
| Follicular lymphoma | 3 | |
| Hodgkin's lymphoma | 1 | |
| Allergic purpura | 1 | |
| Hypersplenism | 2 | |
| Anemia | 3 | |
| Idiopathic thrombocytopenic purpura | 3 | |
| Systemic lupus erythematosus | 1 | |
| Adult onset Still's disease | 1 | |
| Crohn's disease | 1 |
Imaging and clinical features in relation to BM malignant infiltration
When clinical factors between MI and non-MI groups were compared, we found that the MI patients were older than the non-MI patients (56±13 vs 48±17, p=0.049) and the MI group had a lower rate of recent fever than non-MI group (28.6% vs 55.6%, p=0.032). There was no difference in sex between two groups. Then the relationship between PET/CT imaging features and BM malignant infiltration were investigated. T-test showed that the MI group had a higher SUVmaxBM and SUVmaxBM/Liver than non-MI group (6.7±3.1 vs 4.2±0.9, p=0.001; 2.5±1.6 vs 1.7±0.5, p=0.039, respectively). SUVmaxAP/AX≥1 and hepatosplenomegaly were proven to be seen more frequently in MI group than in non-MI group (76.2% vs 20.6%, p=0.000; 61.9% vs 34.9%, p=0.03, respectively). Table 2 revealed that all the differences in imaging and clinical features between MI and non-MI groups.
Comparison of imaging/clinical features between MI and non-MI groups
| Imaging and clinical features | Total (N=85) | MI group (N=21) | Non-MI group (N=63) | P |
|---|---|---|---|---|
| Age (y) | 0.049 | |||
| Mean±SD | 49±17 | 56±13 | 48±17 | |
| Range | 18-80 | 34-76 | 6-80 | |
| Sex | 0.166 | |||
| Male | 41 (48.9%) | 13 (61.9%) | 28 (44.4%) | |
| Female | 43 (51.1%) | 8 (38.1%) | 35 (55.6%) | |
| Recent Fever | 0.032 | |||
| Yes | 41 (48.9%) | 6 (28.6%) | 35 (55.6%) | |
| No | 43 (51.1%) | 15 (71.4%) | 28 (44.4%) | |
| SUVmaxBM | 0.001 | |||
| Mean±SD | 4.8±2.0 | 6.7±3.1 | 4.2±0.9 | |
| Range | 2.3-13.7 | 3.5-13.7 | 2.3-6.1 | |
| SUVmaxBM/Liver | 0.039 | |||
| Mean±SD | 1.9±0.9 | 2.5±1.6 | 1.7±0.5 | |
| Range | 0.77-6.85 | 1.21-6.85 | 0.77-3.06 | |
| SUVmaxAP/AX | 0.000 | |||
| ≥1 | 29 (34.5%) | 16 (76.2%) | 13 (20.6%) | |
| <1 | 55 (65.5%) | 5 (23.8%) | 50 (79.4%) | |
| Hepatosplenomegaly | 0.030 | |||
| Yes | 35 (41.7%) | 13 (61.9%) | 22 (34.9%) | |
| No | 49 (58.3%) | 8 (38.1%) | 41 (65.1%) |
Analysis of increased diffuse BM uptake using SUVmax
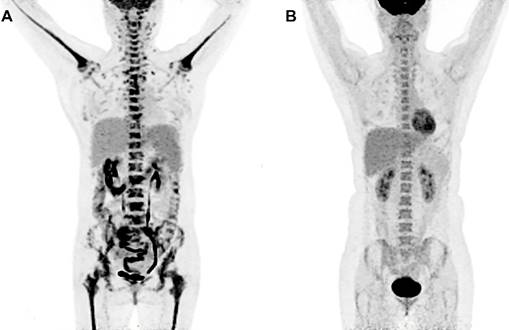
PET/CT metabolic parameters including SUVmaxBM and SUVmaxBM/Liver were summarized in TABLE 3. The receiver operating characteristic (ROC) curve showed that SUVmaxBM had higher area under curve (AUC) for diagnosing bone marrow MI (AUC=0.772, 95%CI: 0.645-0.899) with the best cutoff value of 6.15. Using SUVmaxBM of 6.15, the sensitivity and specificity for diagnosing MI were 47.6% (10/21) and 100% (63/63). Figure 1 shows two patients diagnosed with acute lymphoblastic leukemia and bone marrow hyperplasia, in which the SUVmaxBM were 9.1 and 4.5, respectively.
The ROC curve of PET parameters for diagnosing bone marrow MI
| PET parameter | mean±SD | AUC | P | Cutoff | Sensitivity | Specificity |
|---|---|---|---|---|---|---|
| SUVmaxBM | 4.8±2.0 | 0.772 | 0.000 | 6.15 | 47.6% (10/21) | 100% (64/64) |
| SUVmaxBM/Liver | 1.9±0.9 | 0.676 | 0.023 | 2.14 | 50.0% (9/18) | 84.4% (54/64) |
Increased diffuse BM uptake on PET images. (A) A 49-year-old woman was diagnosed with lymphoblastic leukemia from bone marrow biopsy. Both axial and appendicular skeleton had diffuse FDG accumulation. The SUVmax of bone marrow was 9.1, which was higher than the cutoff value (6.15). (B) A 41-year-old woman was diagnosed with bone marrow hyperplasia by bone marrow biopsy. Diffuse FDG accumulation was distributed mainly in axial skeleton. The SUVmax of bone marrow was 4.5, which was lower than the cutoff value (6.15).
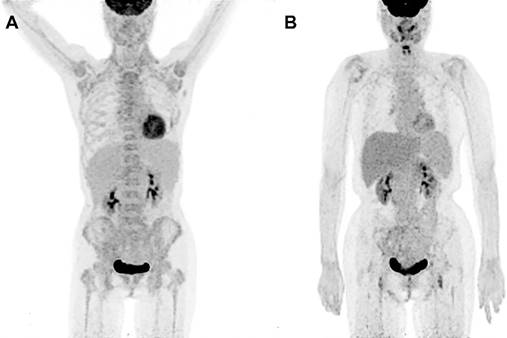
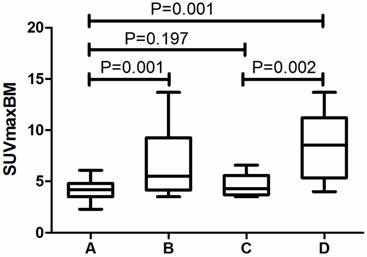
Because of the relatively low sensitivity in SUVmaxBM, we argued whether there were other imaging features that can help in increasing the sensitivity. Table 3 revealed that half of the MI patients did not have great FDG accumulation in bone marrow. We found Lymphoplasmacytic lymphoma/Waldenström macroglobulinemia, chronic myeloid leukemia and multiple myeloma had a considerable proportion of patients with SUVmaxBM lower than the cutoff value. Figure 2 exhibits the PET image of a patient diagnosed with LPL/WM. The PET images before chemotherapy showed increased diffuse BM uptake in axial and appendicular skeleton with SUVmaxBM of 3.7 (Figure 2A). After the chemotherapy, we've seen no increased diffuse BM uptake (Figure 2B). As the SUVmaxBM seemed to be dependent on diseases, we then divided the MI patients into two groups (group C and group D in Figure 3) to compare their SUVmaxBM. Although MI group had higher SUVmaxBM than non-MI groups, group C (including 4 LPL/WM, 2 CML and 3 MM with bone marrow MI) had similar SUVmaxBM to non-MI group (4.7±1.1 vs 4.2±0.9, p=0.197) (Figure 3).
PET images in a 66-year-old woman diagnosed with LPL/WM before and after therapy. (A) PET image before chemotherapy showed mildly increased bone marrow uptake both in axial and appendicular skeleton, with a SUVmax of 3.7. (B) No increased bone marrow uptake was seen on PET image after chemotherapy.
Comparison of SUVmaxBM in different groups. A, non-MI group (N=63). B, MI group (N=21). C, Patients diagnosed with LPL/WM, multiple myeloma and CML in MI group (N=9). D. Other patients in MI group (N=12).
Decision tree for diagnosing bone marrow MI
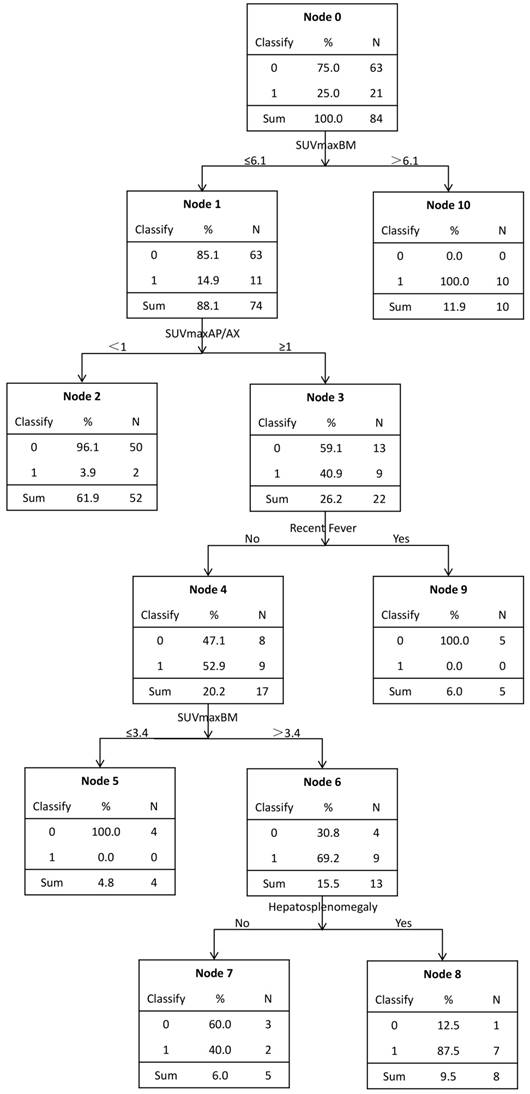
The decision tree was shown in Figure 4. This predicting model indicated that SUVmaxBM, SUVmaxAP/AX, hepatosplenomegaly and fever were important variables to diagnose bone marrow MI, and it had a sensitivity of 81.0% (17/21), a specificity of 98.4% (62/63) and an accuracy of 94.0% (79/84). 100% (10/10) of the patients with SUVmaxBM>6.1 had bone marrow malignant infiltration. Those patients with SUVmaxBM≤6.1 and also SUVmaxAP/AX<1 were almost of no bone marrow MI (50/52, 96.2%). All (5/5) patients with SUVmaxBM≤6.1, SUVmaxAP/AX≥1 and fever had no MI. Patients (4/4, 100%) with SUVmaxBM≤3.4, SUVmaxAP/AX>1 and no fever had no MI. However, 69.2% (9/13) of the patients with SUVmaxBM 3.4-6.1, SUVmaxAP/AX≥1 and no fever had MI. In these patients, hepatosplenomegaly should be taken into consideration. 87.5% (7/8) of the patients with hepatosplenomegaly were proved to have MI.
A model for predicting bone marrow malignant infiltration based on decision tree. It was executed by C5.0 component of SPSS Clementine.
SUVmax of bone marrow in MI patients.
| Diagnosis | N | SUVmaxBM (<6.15) | SUVmaxBM (>6.15) | False Negative |
|---|---|---|---|---|
| LPL/WM | 4 | 3.5, 3.7, 4.3, 5.0 | / | 5/5 (100%) |
| Multiple myeloma | 3 | 3.7, 4.9 | 6.6 | 2/3 (66.7%) |
| CML | 2 | 4.0 | 6.2 | 1/2 (50.0%) |
| DLBCL | 5 | 4.0, 5.5 | 9.4, 10.0, 13.7 | 2/5 (40%) |
| T-cell lymphoma | 3 | 4.3 | 7.2, 11.7 | 1/3 (33.3%) |
| ALL | 3 | 5.3 | 8.0, 9.1 | 1/3 (33.3%) |
| SCLC | 1 | / | 11.6 | 0/1 (0%) |
Discussion
Increased diffuse BM uptake is associated with both malignant infiltration and benign diseases. BM malignant infiltration has been proved to be a negative prognostic factor (9, 10), and has been reported to make up 36.8% of mildly and moderately diffuse BM uptake, and 93.5% of super BM uptake in a previous study [11]. In our study, we found 25% patients with BM malignant infiltration; among them, hematological malignancies made up for 95.2%. So BM malignant infiltration makes up a considerable proportion of the etiologies in diffuse BM uptake pattern. In order to help identify patients with high risk of BM malignant infiltration and to guide BMB tests, we analyzed imaging/clinical features associated with MI, and established a new model based on decision tree. To our knowledge, no studies are available on investigating the predicting model for increased diffuse BM FDG uptake.
Our results demonstrated that MI patients had higher SUVmaxBM than non-MI patients, which was consistent with the previous study [11]. SUVmaxBM has a high specificity (100%) and a low sensitivity (47.6%). Alam's research also reported similar sensitivity and specificity, shown as 95.7% and 43.3%, respectively [11]. The MI patients with SUVmaxBM lower than the cut off value in our study mainly included CML, LPL/WM and multiple myeloma, accounting for 63.6%. We found no significant difference in SUVmaxBM between the MI patients diagnosed with the above three diseases and the non-MI patients. Therefore, using only the SUVmaxBM is not enough to identify MI. Some studies had also revealed the low sensitivity of PET/CT to detect BM involvement of indolent NHL especially the diffuse type of involvement [14-16]. Nakajo et al reported the mildly diffuse bone marrow uptake of two patients with chronic myeloid leukemia [17]. The low SUVmaxBM could be explained by the relatively low FDG accumulation per cell and the low-density marrow infiltration [16, 18].
The present study proved that MI patients has a much higher rate of SUVmaxAP/AX≥1 than non-MI patients, which usually had more FDG accumulation in axial skeleton than appendicular skeleton, while MI patients also had high FDG accumulation in appendicular skeleton. We attributed this phenomenon to the distribution of red BM and malignant cells in BM. As non-MI group had a significantly lower level of Hb than the normal level (men: 105.5±23.8 vs 120, p=0.047; women: 94.1±26.7 vs 110, p=0.002, respectively), benign BM hyperplasia caused by anemia may be the main reason for diffuse BM pattern in non-MI patients. Red BM is mainly distributed in axial skeleton, so benign BM hyperplasia usually leads to more FDG accumulation mainly in axial skeleton. When BM is malignantly infiltrated, FDG accumulation in malignant cells could be exhibited in not only axial skeleton, but also appendicular skeleton. Arimoto and colleagues also found that leukemia patients had greater distribution of FDG accumulation on BM [19]. Therefore, SUVmaxAP/AX≥1 might be a new characteristic of bone marrow MI in PET/CT.
Other diagnostic influential factors included hepatosplenomegaly, age and fever. Using these characteristics, we executed a decision tree by C5.0 component of SPSS Clementine. According to the decision tree, we found that the SUVmaxBM could be separated into three parts. Firstly, SUVmaxBM>6.1 was considered as a dangerous zone, in which all the patients had bone marrow MI (10/10,100%). The study conducted by Alam also reported that 'super bone marrow uptake' was a highly specific indicator for diagnosing MI, which is consistent with our study [11]. Secondly, SUVmaxBM between 3.4 and 6.1 is classified into a grey zone, in which 15.4%(11/71) of the patients had bone marrow MI and BMB should be selectively conducted to confirm BM malignant infiltration. In the grey zone, SUVmaxAP/AX<1 was considered a protective factor since nearly all patients with FDG accumulation mainly in axial skeleton had no malignant infiltration while in patients with SUVmaxAP/AX≥1, MI made up 40.9% (9/22). For these patients, other characteristics should be taken into consideration. Patients with fever had no malignant infiltration (4/4,100%). The relationship between increased BM uptake and inflammation/infection has been reported [6, 20, 21]. In patients without fever, hepatosplenomegaly is a risk factor as 87.5% (7/8) patients with hepatosplenomegaly has MI. Lastly, SUVmaxBM≤3.4 fell into a safe zone. All patients from the safe zone had no BM infiltration and BMB could be safely omitted. Interestingly, Salaun et al also reported that, in Hodgkin's lymphoma, no bone marrow MI was found in patients with SUVmax below 3.4 [6]. In conclusion, the decision tree best separated the patients with increased diffuse BM uptake, and provided clinicians with a diagnostic strategy for these patients.
Our study generated important findings in evaluating the diagnostic value of the imaging and clinical features of patients with increased diffuse BM uptake, and depicting a predicting model in the form of decision tree. Nonetheless, this study also has some limitations. Firstly, our study is a retrospective study with inevitable selection bias, and the sample size is relatively small. Secondly, the sample is heterogeneous, with patients diagnosed as a variety of diseases. Lastly, the predicting model is not perfect, as the application of decision tree may be difficult.
In conclusion, our study indicates that both BM malignant infiltration and benign diseases can lead to the increased diffuse BM uptake. PET/CT has the potential to predict BM malignant infiltration from patients with increased diffuse BM uptake. According to PET/CT imaging and clinical features, the decision tree provides a strategy to identify patients with high risk of BM malignant infiltration and is useful in BMB guidance. Future efforts should be made to simplify the application of the predicting model, and to confirm its value in prospective and multicenter studies with large sample.
Abbreviations
18F-FDG PET/CT: 18F-fluorodeoxyglucose positron emission tomography/computed tomography; SUV: standardized uptake value; BM: bone marrow; MI: malignant infiltration; BMB: bone marrow biopsy; NHL: non-Hodgkin lymphoma; DLBCL: diffuse large B-cell lymphoma; LPL/WM: lymphoplasmacytic lymphoma/Waldenström macroglobulinemia; CML: chronic myeloid leukemia; MM: multiple myeloma; SCLC: small cell lung cancer; MIP: maximum intensity projection; MICM: morphology, immunology, cytogenetics and molecular; ROI: region of interest; ROC curve: receiver operating characteristic curve; AUC: area under curve.
Acknowledgements
We would like to acknowledge Mrs. Yan Li from Department of Nuclear Medicine, Ren Ji Hospital, School of Medicine, Shanghai Jiao Tong University for help with polishing our article.
Funding Support
Supported by the National Natural Science Foundation of China (30830038, 30970842, 81071180, 81571710, 81530053, 81471685, 81471687), the Major State Basic Research Development Program of China (2012CB932604), the New Drug Discovery Project (2012ZX09506-001-00), and the Shanghai Science and Technology Commission, China (Grant No. 17411953200).
Competing Interests
The authors have declared that no competing interest exists.
References
1. Akin O, Brennan SB, Dershaw DD. et al. Advances in oncologic imaging: update on 5 common cancers. CA: a cancer journal for clinicians. 2012;62:364-93
2. Chiang SB, Rebenstock A, Guan L. et al. Diffuse bone marrow involvement of Hodgkin lymphoma mimics hematopoietic cytokine-mediated FDG uptake on FDG PET imaging. Clinical nuclear medicine. 2003;28:674-6
3. Elstrom RL, Tsai DE, Vergilio J-A. et al. Enhanced Marrow [18F]Fluorodeoxyglucose Uptake Related to Myeloid Hyperplasia in Hodgkin's Lymphoma Can Simulate Lymphoma Involvement in Marrow. Clinical Lymphoma. 2004;5:62-4
4. Takalkar A, Yu JQ, Kumar R. et al. Diffuse bone marrow accumulation of FDG in a patient with chronic myeloid leukemia mimics hematopoietic cytokine-mediated FDG uptake on positron emission tomography. Clinical nuclear medicine. 2004;29:637-9
5. Su K, Nakamoto Y, Nakatani K. et al. Diffuse homogeneous bone marrow uptake of FDG in patients with acute lymphoblastic leukemia. Clinical nuclear medicine. 2013;38:e33
6. Salaun PY, Gastinne T, Bodet-Milin C. et al. Analysis of 18F-FDG PET diffuse bone marrow uptake and splenic uptake in staging of Hodgkin's lymphoma: a reflection of disease infiltration or just inflammation? European journal of nuclear medicine and molecular imaging. 2009;36:1813-21
7. Blodgett TM, Ames JT, Torok FS. et al. Diffuse bone marrow uptake on whole-body F-18 fluorodeoxyglucose positron emission tomography in a patient taking recombinant erythropoietin. Clinical nuclear medicine. 2004;29:161
8. Yi C, Shi X, Wang X. et al. The alteration of 18F-FDG uptake in bone marrow after treatment with interleukin 11. Clinical nuclear medicine. 2014;39:934
9. Kang BW, Lee YJ, Chae YS. et al. Prognostic impact of bone marrow involvement for patients with diffuse large B-cell lymphoma in the era of rituximab. Journal of Clinical Oncology Official Journal of the American Society of Clinical Oncology. 2011;29:e18514
10. Braun S, Vogl FD, Pantel K. Presence of bone marrow micrometastasis (BMM) in breast cancer patients predicts a poor-prognosis pattern of first distant metastasis: Results from the pooled analysis. Journal of Clinical Oncology. 2006;45:351-2
11. Alam MS, Fu L, Ren YY. et al. 18F-FDG super bone marrow uptake: A highly potent indicator for the malignant infiltration. Medicine. 2016;95:e5579
12. Bain BJ. Morbidity associated with bone marrow aspiration and trephine biopsy - a review of UK data for 2004. Haematologica. 2006;91:1293-4
13. Frey L, Edgerton ME, Fisher DH. et al. Using prior knowledge and rule induction methods to discover molecular markers of prognosis in lung cancer. Amia Annu Symp Proc. 2004:256-60
14. Delorme S, Baur-Melnyk A. Imaging in multiple myeloma. European journal of radiology. 2009;70:401-8
15. Elena Z, Cristina N, Francesca P. et al. A prospective comparison of 18F-fluorodeoxyglucose positron emission tomography-computed tomography, magnetic resonance imaging and whole-body planar radiographs in the assessment of bone disease in newly diagnosed multiple myeloma. Haematologica. 2007;92:50
16. Chen YK, Yeh CL, Tsui CC. et al. F-18 FDG PET for evaluation of bone marrow involvement in non-Hodgkin lymphoma: a meta-analysis. Clinical nuclear medicine. 2011;36:553-9
17. Nakajo M, Jinnouchi S, Inoue H. et al. FDG PET findings of chronic myeloid leukemia in the chronic phase before and after treatment. Clinical nuclear medicine. 2007;32:775
18. Sachpekidis C, Mai EK, Goldschmidt H. et al. (18)F-FDG dynamic PET/CT in patients with multiple myeloma: patterns of tracer uptake and correlation with bone marrow plasma cell infiltration rate. Clinical nuclear medicine. 2015;40:300-7
19. Arimoto MK, Nakamoto Y, Nakatani K. et al. Increased bone marrow uptake of 18F-FDG in leukemia patients: preliminary findings. SpringerPlus. 2015;4:521
20. Inoue K, Goto R, Okada K. et al. A bone marrow F-18 FDG uptake exceeding the liver uptake may indicate bone marrow hyperactivity. Annals of nuclear medicine. 2009;23:643-9
21. Cheng G. Using a cut-off SUV level to define bone marrow lesions on FDG PET is not appropriate. Annals of hematology. 2013;92:283-4
Author contact
![]() Corresponding author: Gang Huang, 1630 Dongfang Road, Shanghai 200127, China, Tel: +86 21 63867812, 63853125, Fax: +86 21 63842916, E-mail: huang2802com and Jianjun Liu, 1630 Dongfang Road, Shanghai 200127, China. Tel: +86 21 68383530; Fax: +86 21 63842916; E-mail: nuclearjcom
Corresponding author: Gang Huang, 1630 Dongfang Road, Shanghai 200127, China, Tel: +86 21 63867812, 63853125, Fax: +86 21 63842916, E-mail: huang2802com and Jianjun Liu, 1630 Dongfang Road, Shanghai 200127, China. Tel: +86 21 68383530; Fax: +86 21 63842916; E-mail: nuclearjcom