Impact Factor ISSN: 1837-9664

 Global reach, higher impact
J Cancer 2018; 9(13):2237-2248. doi:10.7150/jca.24690 This issue Cite
Research Paper
Optimal biopsy strategy for prostate cancer detection by performing a Bayesian network meta-analysis of randomized controlled trials
Yi Wang1*, Jundong Zhu1,2*, Zhiqiang Qin1*, Yamin Wang1, Chen Chen1, Yichun Wang1, Xiang Zhou1, Qijie Zhang1, Xianghu Meng1 ![]() , Ninghong Song1
, Ninghong Song1 ![]()
1. Department of Urology, The First Affiliated Hospital of Nanjing Medical University, Nanjing, 210029, China
2. Current affiliation: Department of Urology, The Third Affiliated Hospital of Soochow University, Changzhou, 213000, China
* Yi Wang, Jundong Zhu and Zhiqiang Qin contributed equally to this work.
Received 2018-1-2; Accepted 2018-3-16; Published 2018-6-5
Abstract
Objective: With the increasing recognition of the over-diagnosis and over-treatment of prostate cancer (PCa), the choice of a better prostate biopsy strategy had confused both the patients and clinical surgeons. Hence, this network meta-analysis was conducted to clarify this question.
Methods: In the current network meta-analysis, twenty eligible randomized controlled trials (RCTs) with 4,571 participants were comprehensively identified through Pubmed, Embase and Web of Science databases up to July 2017. The pooled odds ratio (OR) with 95% credible interval (CrI) was calculated by Markov chain Monte Carlo methods. A Bayesian network meta-analysis was conducted by using R-3.4.0 software with the help of package “gemtc” version 0.8.2.
Results: Six different PCa biopsy strategies and four clinical outcomes were ultimately analyzed in this study. Although, the efficacy of different PCa biopsy strategies by ORs with corresponding 95% CrIs had not yet reached statistical differences, the cumulative rank probability indicated that overall PCa detection rate from best to worst was FUS-GB plus TRUS-GB, FUS-GB, CEUS, MRI-GB, TRUS-GB and TPUS-GB. In terms of clinically significant PCa detection, CEUS, FUS-GB or FUS-GB plus TRUS-GB had a higher, whereas TRUS-GB or TPUS-GB had a relatively lower significant detection rate. Meanwhile, TPUS-GB or TRUS-GB had a higher insignificant PCa detection rate. As for TRUS-guided biopsy, the general trend was that the more biopsy cores, the higher overall PCa detection rate. As for targeted biopsy, it could yield a comparable or even a better effect with fewer cores, compared with traditional random biopsy.
Conclusion: Taken together, in a comprehensive consideration of four clinical outcomes, our outcomes shed light on that FUS-GB or FUS-GB plus TRUS-GB showed their superiority, compared with other puncture methods in the detection of PCa. Moreover, TPUS or TRUS-GB was more easily associated with the over-diagnosis and over-treatment of PCa. In addition, targeted biopsy was obviously more effective than traditional random biopsy. The subsequent RCTs with larger sample sizes were required to validate our findings.
Keywords: prostate cancer, prostate cancer detection, network meta-analysis, randomized controlled trials
Introduction
Prostate cancer (PCa) is the most common solid tumor diagnosed in the male population, which is also a major public health issue that presented many challenges in the developed world [1]. Although most PCa followed an indolent course with an estimated 5-year survival rate of 98.9%, it still ranked second leading cause of mortality in the western countries [2]. With the widespread usage of the diagnostic methods of PCa, including serum prostate-specific antigen (PSA) measurement, abnormal digital rectal examination (DRE) finding and transrectal ultrasound-guided biopsies (TRUS-GB), it had improved the detection rate of early PCa [3]. As recommended by the European Association of Urology Guidelines, TRUS-GB sampling 6-12 cores, 1-2 for each sextant, was the current standard diagnostic approach in suspicion of PCa [4]. Meanwhile, it was a low-cost, practical tool for visualizing the boundaries of the prostate and its adjacent structures [5]. However, this protocol still had low sensitivity with a detection rate of 27% - 40.3%, which could easily cause a high rate of missed cancer, especially in the anterior areas of the prostate gland [6]. Moreover, it was more easily associated with over-diagnosis of clinically insignificant cancers and failure of detecting clinically significant cancers, which was defined as cancer volume ≥ 0.5 ml for Gleason=6 or any cancer volume for Gleason≥7 on step-sectional analysis of radical prostatectomy(RP) [7, 8]. Thus, the ideal biopsy strategy for PCa detection remained to be completely defined.
Currently, biopsy strategy of PCa detection included TRUS-GB, transperineal ultrasound-guided biopsies (TPUS-GB), sonographic contrast (CEUS), magnetic resonance imaging-guided biopsy (MRI-GB), MRI-ultrasound fusion-guided biopsy (FUS-GB) and so on [9-12]. All these available biopsy strategy in the detection of PCa had their individual advantages and disadvantages. As for TPUS-GB, it was another primary way to obtain prostate tissue specimen randomly and its pathway was targeted to the lateral, apico-dorsal peripheral and transition zones of PCa, which was expected to increase PCa detection rates [13]. Nevertheless, the results of several clinical randomized controlled trials (RCTs) on the comparison of TRUS-GB and TPUS-GB had remained inconsistent. As for CEUS, it helped to define and characterize neoplastic areas within the periphery of the prostate by amplifying the hypervascular signal provided by Power Doppler [14]. Furthermore, several RCTs had demonstrated its advantage of detecting more cancers than systematic biopsy (SB) with a reduced number of biopsy cores [15]. As for multi-parametric MRI (mp-MRI), it had been demonstrated to be very sensitive and specific for detecting anterior and posterior cancers. Besides, it had been shown that for a volume greater than 0.5 cm3, sensitivity, specificity and the negative predictive value were 86%, 94% and 95%, respectively [16]. Nowadays, two different MRI-guided biopsy techniques had been established: direct MRI-guided biopsy and MRI-ultrasound fusion-guided biopsy (FUS-GB) [17]. The current drawbacks of MRI were its inability to differentiate between prostate cancer and prostatitis or inflammation and meanwhile it was costly, time-consuming, operator-dependent [16, 18]. Last but not least, FUS-GB plus TRUS-GB, which combined MRI-guided targeted biopsy and systematic TRUS-GB within one biopsy session, had been reported a 60% detection rate of PCa in 106 patients undergoing FUS-GB with additional systematic biopsy by Hadaschik et al [19].
Along with the increasing recognition of PCa's over-diagnosis and over-treatment, various imaging-guided biopsy methods had been utilized in an attempt to increase the cancer detection rate and meanwhile surgeons and patients were eager to understand which strategy was relatively the best choice to diagnose PCa accurately and reasonably [20]. Due to the absence of direct statistical analysis and limited evidence, it was harder for physicians to provide the optimal biopsy strategy. Hence, we took advantage of network meta-analysis and anticipated it to provide a hierarchy of different puncture methods in a broad spectrum of the population [21, 22]. Six different PCa biopsy strategies consisted of TRUS-GB, TPUS-GB, CEUS, MRI-GB, FUS-GB as well as FUS-GB plus TRUS-GB, and four clinical outcomes composed of overall PCa detection, significant PCa detection, insignificant PCa detection as well as comparison of different TRUS-guided biopsy cores, were ultimately analyzed in this study. As a result, our analysis was anticipated to provide some references for clinical practice.
Material and methods
Search strategy
Relevant articles were comprehensively retrieved from Pubmed, Embase, Web of Science, up to July 2017. The search strategy consisted of three parts (biopsy strategy, prostate cancer detection, and a specific filter for randomized controlled trials), using the following keywords in combination with Medical Subject Headings(MeSH) terms and text words: transrectal ultrasound-guided biopsy (TRUS-GB), transperineal ultrasound-guided biopsies (TPUS-GB), sonographic contrast (CEUS), magnetic resonance imaging-guided biopsy (MRI-GB), MRI-ultrasound fusion-guided biopsy (FUS-GB), prostate cancer detection, and randomized controlled trials (RCTs). Two reviewers independently screened titles and abstracts of retrieved articles in an initial search. Amongst them, irrelevant studies would be ruled out, and the remaining full text articles were evaluated, according to inclusion criteria.
Inclusion and exclusion criteria
Studies enrolled in this meta-analysis had to meet the following criteria: (1) The language of the article was limited to English; (2) Sufficient data could be extracted from each included original study; (3) The study was designed as randomized controlled trials; (4) At least two of different biopsy methods were mentioned and compared; (5) Clinical outcomes including overall PCa detection, significant PCa detection, insignificant PCa detection and comparison of different TRUS-guided biopsy cores should be extracted in these involved articles.
Studies would be excluded if they met the following criteria: (1) The language of the article was non-English; (2) The publication types of studies were reviews or letters or case reports or comments or editorials; (3) No sufficient and qualified data could extracted from these studies.
Data extraction and quality assessment
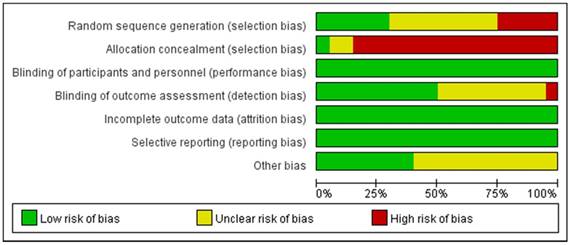
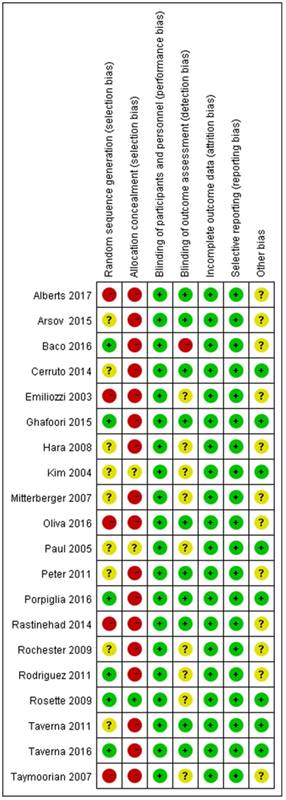
All eligible studies were independently reviewed by two blind reviewers (Y.W, JD.Z), according to the inclusion and exclusion criterion. Besides, the discrepancies were handled by a discussion with a third reviewer (ZQ.Q). All data were centrally extracted from the included publications, including first author's name, publication year, treatment, puncture method, overall PCa detection, clinically significant PCa detection, insignificant PCa detection and endpoints. All of the aforementioned data were comprehensively presented in Table 1. According to the Cochrane Handbook [23], the quality of eligible studies was evaluated the potential source of bias as follows: (1) Random sequence generation; (2) Allocation concealment; (3) Blinding of participants and personnel; (4) Blinding of outcome assessment; (5) Incomplete outcome data; (6) Selective reporting; (7) Other bias. The judgments were graded as a low, high or unclear risk of bias (http://www.cochrane-handbook.org; Figure 1, 2). The flow diagram of the literature selection process was detailed in Figure 3.
Main characteristics of individual studies included in the network meta-analysis.
| Study | Year | Treatment | Method | Overall PCa detection | Significant PCa | Insignificant PCa | Endpoints | |||
|---|---|---|---|---|---|---|---|---|---|---|
| Responders | SampleSize | Responders | SampleSize | Responders | SampleSize | |||||
| Alberts | 2017 | TRUS-GB (6-core) | RB | 49 | 179 | 19 | 179 | 30 | 179 | ①②③④ |
| TRUS-GB (12-core) | RB | 64 | 158 | 19 | 158 | 45 | 158 | |||
| FUS-GB | TB | 28 | 48 | 17 | 48 | 11 | 48 | |||
| Porpiglia | 2016 | FUS-GB | TB | 49 | 81 | 46 | 81 | 3 | 81 | ①②③ |
| TRUS-GB (12-core) | RB | 31 | 105 | 19 | 105 | 12 | 105 | |||
| Oliva | 2016 | CEUS-targeted | TB | 44 | 179 | NA | NA | NA | NA | ① |
| TRUS-GB (10-core) | RB | 75 | 179 | NA | NA | NA | NA | |||
| Taverna | 2016 | MRI-GB | TB | 15 | 100 | NA | NA | NA | NA | ① |
| TRUS-GB (12-core) | RB | 26 | 100 | NA | NA | NA | NA | |||
| Baco | 2016 | MRI-GB | TB | 51 | 86 | 38 | 86 | 13 | 86 | ①②③ |
| TRUS-GB (12-core) | RB | 48 | 89 | 44 | 89 | 4 | 89 | |||
| Arsov | 2015 | MRI-GB | TB | 39 | 106 | 31 | 106 | 8 | 106 | ①②③ |
| FUS-GB+TRUS-GB | RB+TB | 41 | 104 | 33 | 104 | 8 | 104 | |||
| FUS-GB | TB | 35 | 104 | 27 | 104 | 8 | 104 | |||
| TRUS-GB (12-core) | RB | 36 | 104 | 26 | 104 | 10 | 104 | |||
| Ghafoori | 2015 | TRUS-GB (6-core) | RB | 8 | 60 | NA | NA | NA | NA | ④ |
| TRUS-GB (12-core) | RB | 21 | 60 | NA | NA | NA | NA | |||
| TRUS-GB (18-core) | RB | 24 | 60 | NA | NA | NA | NA | |||
| Rastinehad | 2014 | TRUS-GB (12-core) | RB | 51 | 105 | 34 | 105 | 17 | 105 | ①②③ |
| FUS-GB | TB | 53 | 105 | 47 | 105 | 6 | 105 | |||
| FUS-GB+TRUS-GB | RB+TB | 66 | 105 | 51 | 105 | 15 | 105 | |||
| Cerruto | 2014 | TRUS-GB (14-core) | RB | 25 | 54 | NA | NA | NA | NA | ① |
| TPUS-GB (14-core) | RB | 24 | 54 | NA | NA | NA | NA | |||
| Peter | 2011 | TRUS-GB (12-core) | RB | 45 | 101 | NA | NA | NA | NA | ① |
| FUS-GB | TB | 45 | 101 | NA | NA | NA | NA | |||
| Taverna | 2011 | TRUS-GB (12-core) | RB | 29 | 100 | NA | NA | NA | NA | ① |
| CEUS-targeted | TB | 31 | 100 | NA | NA | NA | NA | |||
| Rodriguez | 2011 | TRUS-GB (12-core) | RB | 23 | 75 | 20 | 75 | 3 | 75 | ④ |
| TRUS-GB (18-core) | RB | 36 | 75 | 27 | 75 | 9 | 75 | |||
| Rosette | 2009 | TRUS-GB (8-core) | RB | 45 | 132 | NA | NA | NA | NA | ④ |
| TRUS-GB (12-core) | RB | 49 | 128 | NA | NA | NA | NA | |||
| Rochester | 2009 | TRUS-GB (12-core) | RB | 63 | 122 | NA | NA | NA | NA | ④ |
| TRUS-GB (15-core) | RB | 50 | 122 | NA | NA | NA | NA | |||
| Hara | 2008 | TRUS-GB (12-core) | RB | 58 | 120 | NA | NA | NA | NA | ① |
| TPUS-GB (12-core) | RB | 53 | 126 | NA | NA | NA | NA | |||
| Taymoorian | 2007 | TRUS-GB (12-core) | RB | 8 | 95 | NA | NA | NA | NA | ① |
| CEUS-targeted | TB | 24 | 95 | NA | NA | NA | NA | |||
| Mitterberger | 2007 | CEUS-targeted | TB | 16 | 50 | 8 | 50 | 8 | 50 | ①②③ |
| TRUS-GB (12-core) | RB | 13 | 50 | 4 | 50 | 9 | 50 | |||
| Paul | 2005 | TRUS-GB (6-core) | RB | 32 | 100 | NA | NA | NA | NA | ④ |
| TRUS-GB (10-core) | RB | 40 | 100 | NA | NA | NA | NA | |||
| Kim | 2004 | TRUS-GB (6-core) | RB | 17 | 118 | NA | NA | NA | NA | ④ |
| TRUS-GB (12-core) | RB | 21 | 122 | NA | NA | NA | NA | |||
| Emiliozzi | 2003 | TRUS-GB (6-core) | RB | 34 | 107 | 15 | 107 | 19 | 107 | ①②③ |
| TPUS-GB (6-core) | RB | 41 | 107 | 19 | 107 | 22 | 107 | |||
TRUS-GB: transrectal ultrasound-guided biopsy; TPUS-GB: transperineal ultrasound-guided biopsy; CEUS: sonographic contrast; MRI-GB: magnetic resonance imaging-guided biopsy; FUS-GB: MRI-ultrasound fusion-guided biopsy; RB: random biopsy; TB: targeted biopsy; NA: not available.①Overall PCa detection; ②Significant PCa detection; ③Insignificant PCa detection; ④Comparison of different TRUS-guided biopsy cores.
Risk of bias graph. Review author's judgement for each risk of bias item presented as percentages of all included studies.
Risk of bias summary. Review author's judgement for each risk of bias item for individual studies.
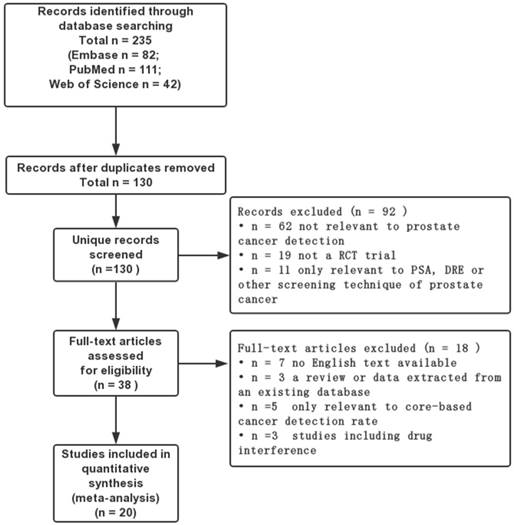
The flow diagram of the literature selection process.
Statistical analysis
A pair-wise meta-analysis was performed to make direct comparison between two biopsy strategies, and the results were evaluated by the pooled odds ratio (OR) with 95% confidence interval (CI). The Chi-square test and I-square test were used to assess the heterogeneity; If I2>50% or Chi-square test P>0.10, it was considered as existence of significant heterogeneity. With the presence of the heterogeneity, the random-effects model was applied and ORs was calculated by the DerSimonian-Laird method; whereas in the non-existence of heterogeneity, the fixed-effects model (the Mantel-Haenszel method) was conducted. Publication bias was examined by Begg's and Egger's test [24]. P values were adopted by a two-sided test and P<0.05 was regarded as statistically significant. In addition, calculations of traditional meta-analysis were conducted by Stata software (version 12.0; StataCorp LP, College Station, TX).
In addition to traditional meta-analysis, a network meta-analysis concerning multiple treatments was performed by a random-effect model within a Bayesian framework , using package “gemtc” version 0.8.2 of R software (version 3.4.0; R Foundation, Vienna, Austria) [25, 26]. Odds ratio (OR) with 95% credible interval (CrI) was calculated by Markov chain Monte Carlo methods. The function mtc.run would be used to generate samples by means of the Markov chain Monte Carlo sampler. We set 10,000 simulations for each chain as the “burn-in” period, yielding 40,000 iterations to obtain the OR of model parameters, when three Markov chains run simultaneously. The model convergence was accessed by Brooks-Gelman-Rubin plots method, trace plot and density plot (Supplement Figure 1, 2) [27]. In addition, the rank probabilities would be calculated to obtain the hierarchy of each treatment. Based on the results of rank probabilities, clinical surgeons could make the choice which puncture method could be best, second and so on [28]. The matrix of rank probabilities and the plot of rank probabilities were provided by the “gemtc” package simultaneously. From direct plot of rank probabilities, we could easily find the ranking of each biopsy strategy [29]. From cumulative rank plot, we could easily find the proportion of each ranking [30].
The pooled ORs from network meta-analysis and traditional meta-analysis were compared to estimate the consistency between direct and indirect comparisons. To access the inconsistency, the node-splitting method was implemented by reporting its Bayesian P value, by means of separating the evidence concerning certain comparison into direct and indirect evidence, when a loop connecting three arms existed [31]. Last but not least, the mtc.anohe command of the “gemtc” package would be utilized to evaluate the global heterogeneity, based on the bias of the magnitude of heterogeneity variance parameter I2.
Results
Search results and study characteristics
The literature search yielded 235 citations, through online databases using previous search strategy. Amongst them, 197 records were excluded because of reviews, letters, case-reports, duplicates and so on, after screening the tittles and abstracts. The full texts of the remaining 38 articles were evaluated by the reviewers, and finally 20 RCTs were eligible for this meta-analysis (Figure 3) [2, 10, 11, 32-48]. Meanwhile, the detailed characteristics of the enrolled 20 studies with 4,571 participants were summarized in Table 1. All of these enrolled studies were RCTs and the quality of evidence was evaluated by the Cochrane Handbook and graded each potential source of bias as low, high or unclear. The details were displayed in Figure 1, 2. Clinical outcomes of involved articles included overall PCa detection, clinically significant PCa detection, insignificant PCa detection and comparison of different TRUS-guided biopsy cores.
Network structure diagrams
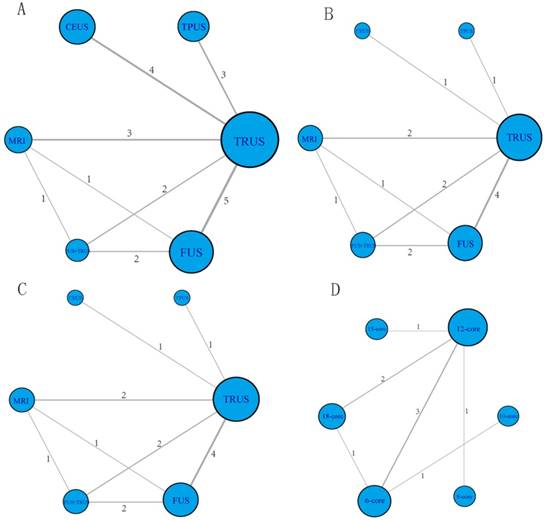
These enrolled studies covered six different PCa biopsy strategies: TRUS-GB, TPUS-GB, CEUS, MRI-GB, FUS-GB and FUS-GB plus TRUS-GB. The network structure diagrams, which presented the direct association between different puncture methods, were displayed in Figure 4. Besides, the thicknesses of the lines were proportional to the number of comparisons, and the diameters of the circles were proportional to the number of treatments included in the network meta-analysis.
Network structure diagrams. (A) Overall PCa detection; (B) Significant PCa detection; (C) Insignificant PCa detection; (D) Comparison of different TRUS-guided biopsy cores. The thicknesses of the lines were proportional to the number of comparisons; the diameters of the circles were proportional to the number of treatments.
Overall PCa detection
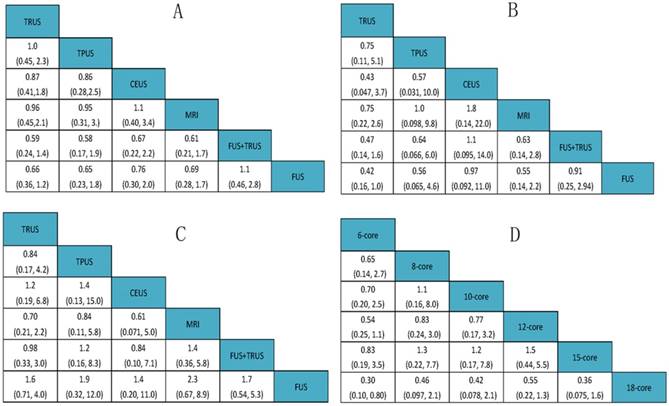
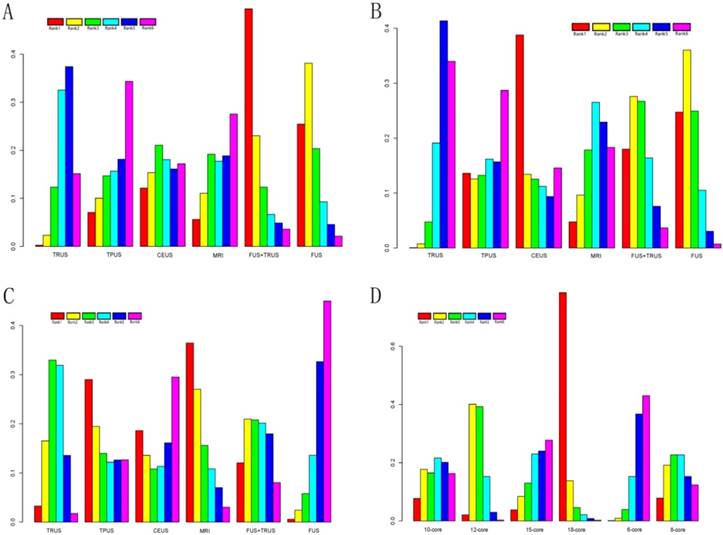
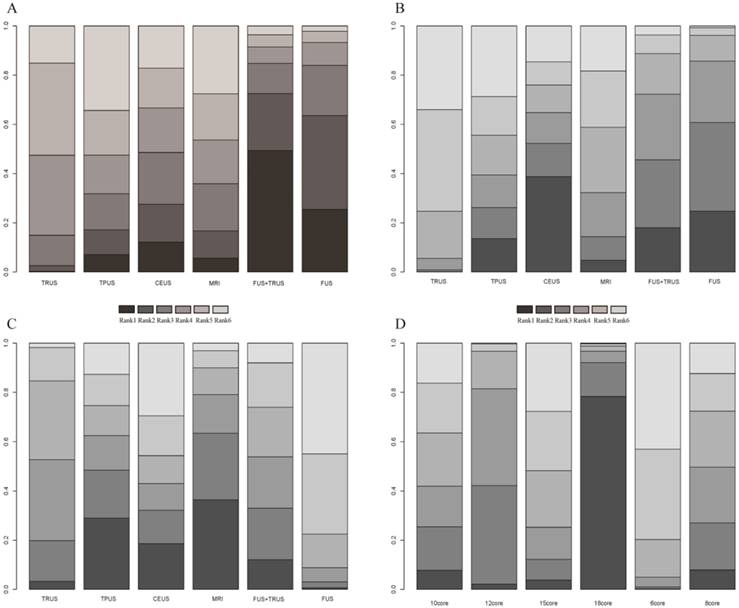
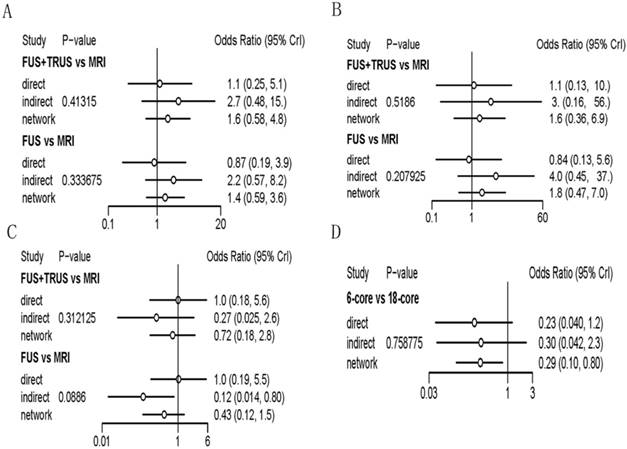
A total of 14 studies including six different PCa biopsy strategies contributed to the analysis of overall PCa detection. The efficacy of different PCa biopsy strategies by ORs and corresponding 95% CrIs was displayed in Figure 5. The detailed rankings of different biopsy strategies were presented in Table 2A. Based on it, Figure 6A and Figure 7A were established. Figure 6A was a direct plot of rank probabilities, from which we could easily find the ranking of each biopsy strategy. Figure 7A was a cumulative rank plot, from which we could easily find the proportion of each ranking. As a result, the cumulative rank probability of overall PCa detection from best to worst was FUS-GB plus TRUS-GB, FUS-GB, CEUS, MRI-GB, TRUS-GB and TPUS-GB. Bayesian P values of node-splitting method were all>0.05, which indicated that the direct and indirect evidence was consistent (Figure 8A).
The efficacy of different PCa biopsy strategies by ORs and corresponding 95% CrIs. (A) Overall PCa detection; (B) Significant PCa detection; (C) Insignificant PCa detection; (D) Comparison of different TRUS-guided biopsy cores.
Detailed rank probability. (A) Rank probability of Overall PCa detection; (B) Rank probability of Significant PCa detection; (C) Rank probability of Insignificant PCa detection; (D) Rank probability of Different TRUS-guided biopsy cores.
| (A) Rank probability of Overall PCa detection; | ||||||
| Rank | Rank1 | Rank2 | Rank3 | Rank4 | Rank5 | Rank6 |
| TRUS | 0.002633333 | 0.02333333 | 0.1232833 | 0.32525833 | 0.37414167 | 0.1513500 |
| TPUS | 0.070983333 | 0.10034167 | 0.1469250 | 0.15677500 | 0.18146667 | 0.3435083 |
| CEUS | 0.121400000 | 0.15379167 | 0.2107167 | 0.18086667 | 0.16117500 | 0.1720500 |
| MRI | 0.056216667 | 0.11049167 | 0.1920333 | 0.17726667 | 0.18855000 | 0.2754417 |
| FUS+TRUS | 0.494175000 | 0.23072500 | 0.1233583 | 0.06666667 | 0.04895000 | 0.0361250 |
| FUS | 0.254591667 | 0.38131667 | 0.2036833 | 0.09316667 | 0.04571667 | 0.0215250 |
| (B) Rank probability of Significant PCa detection; | ||||||
| Rank | Rank1 | Rank2 | Rank3 | Rank4 | Rank5 | Rank6 |
| TRUS | 0.00065000 | 0.007583333 | 0.0473500 | 0.1911667 | 0.41345000 | 0.339800000 |
| TPUS | 0.13615000 | 0.125683333 | 0.1323833 | 0.1619167 | 0.15675000 | 0.287116667 |
| CEUS | 0.38793333 | 0.134416667 | 0.1255500 | 0.1124500 | 0.09385000 | 0.145800000 |
| MRI | 0.04768333 | 0.096200000 | 0.1783667 | 0.2653167 | 0.22931667 | 0.183116667 |
| FUS+TRUS | 0.18015000 | 0.275866667 | 0.2670833 | 0.1640500 | 0.07605000 | 0.036800000 |
| FUS | 0.24743333 | 0.360250000 | 0.2492667 | 0.1051000 | 0.03058333 | 0.007366667 |
| (C) Rank probability of Insignificant PCa detection; | ||||||
| Rank | Rank1 | Rank2 | Rank3 | Rank4 | Rank5 | Rank6 |
| TRUS | 0.032800000 | 0.16516667 | 0.32948333 | 0.3188833 | 0.13570000 | 0.01796667 |
| TPUS | 0.290133333 | 0.19466667 | 0.13993333 | 0.1219000 | 0.12653333 | 0.12683333 |
| CEUS | 0.185966667 | 0.13585000 | 0.10823333 | 0.1134667 | 0.16130000 | 0.29518333 |
| MRI | 0.364416667 | 0.27033333 | 0.15621667 | 0.1082833 | 0.07036667 | 0.03038333 |
| FUS+TRUS | 0.120716667 | 0.20961667 | 0.20800000 | 0.2015500 | 0.17976667 | 0.08035000 |
| FUS | 0.005966667 | 0.02436667 | 0.05813333 | 0.1359167 | 0.32633333 | 0.44928333 |
| (D) Rank probability of Different TRUS-guided biopsy cores. | ||||||
| Rank | Rank1 | Rank2 | Rank3 | Rank4 | Rank5 | Rank6 |
| 10-core | 0.07755833 | 0.176958333 | 0.16499167 | 0.2162083 | 0.201375000 | 0.162908333 |
| 12-core | 0.02122500 | 0.400733333 | 0.39244167 | 0.1526250 | 0.029825000 | 0.003150000 |
| 15-core | 0.03799167 | 0.084308333 | 0.13004167 | 0.2302167 | 0.240158333 | 0.277283333 |
| 18-core | 0.78315833 | 0.137866667 | 0.04596667 | 0.0214750 | 0.008716667 | 0.002816667 |
| 6-core | 0.00137500 | 0.008958333 | 0.03950833 | 0.1526750 | 0.367250000 | 0.430233333 |
| 8-core | 0.07869167 | 0.191175000 | 0.22705000 | 0.2268000 | 0.152675000 | 0.123608333 |
TRUS: transrectal ultrasound-guided biopsy; TPUS: transperineal ultrasound-guided biopsy; CEUS: sonographic contrast; MRI: magnetic resonance imaging-guided biopsy; FUS: MRI-ultrasound fusion-guided biopsy;
Rank of probability for effective outcomes. (A) Overall PCa detection; (B) Significant PCa detection; (C) Insignificant PCa detection; (D) Comparison of different TRUS-guided biopsy cores.
Cumulative rank plot for effective outcomes. (A) Overall PCa detection; (B) Significant PCa detection; (C) Insignificant PCa detection; (D) Comparison of different TRUS-guided biopsy cores.
Node-splitting method in comparison between direct and indirect evidence. (A) Overall PCa detection; (B) Significant PCa detection; (C) Insignificant PCa detection; (D) Comparison of different TRUS-guided biopsy cores.
Significant PCa detection
Seven studies including six different PCa biopsy strategies were involved in the analysis of clinically significant PCa detection. The efficacy of all PCa biopsy strategies by ORs and corresponding 95% CrIs was showed in Figure 5B. The detailed rankings of different biopsy strategies were presented in Table 2B. Besides, Figure 6B was a direct plot of rank probabilities and Figure 7B was a cumulative rank plot. As a result, the cumulative rank probability results indicated that CEUS, FUS-GB or FUS-GB plus TRUS-GB had a higher, whereas TRUS or TPUS-guided biopsy had a relatively lower significant PCa detection rate. The results of node-splitting method were all above 0.05, indicating the consistency of the direct and indirect evidence (Figure 8B).
Insignificant PCa detection
The results of insignificant PCa detection were calculated by seven studies including six different PCa biopsy strategies. The ORs and corresponding 95% CrIs were displayed in Figure 5C. The detailed rankings of different biopsy strategies were presented in Table 2C. Besides, Figure 6C was a direct plot of rank probabilities and Figure 7C was a cumulative rank plot. As a result, rank probability results indicated that MRI-GB, TPUS-GB or TRUS-GB had a higher, whereas FUS-GB or CEUS had a lower relatively insignificant PCa detection rate. Node-splitting method indicated the consistency of the direct and indirect evidence (Figure 8C).
Comparison of different TRUS-guided biopsy cores
A total of seven studies including six different TRUS-guided biopsy strategies (6-core, 8-core, 10-core, 12-core, 15-core, 18-core) contributed to the analysis of the overall PCa detection of different TRUS-guided biopsy cores. The efficacy of different TRUS-guided biopsy strategies by ORs and corresponding 95% CrIs was displayed in Figure 5D. The detailed rankings of different biopsy strategies were presented in Table 2D. Besides, Figure 6D was a direct plot of rank probabilities and Figure 7D was a cumulative rank plot. As a result, rank probability results showed the general trend was that the more the biopsy cores, the higher the overall PCa detection rate, in addition to 15-core biopsy strategy which might be the shortage of sufficient data. The Bayesian P value of node-splitting method was > 0.05, indicating that the direct and indirect evidence was consistent (Figure 8D).
Node-splitting method
When a loop connecting three arms existed, the node-splitting method was implemented by reporting its Bayesian P value, by means of separating the evidence concerning certain comparison into direct and indirect evidence, to access the inconsistency. We could easily find that all the P values of node-splitting method were above 0.05, which indicated the consistency of the direct and indirect evidence (Figure 8).
Discussion
Currently, TRUS-guided systematic biopsy was the gold standard biopsy strategy in the detection of PCa, recommended by the European Association of Urology guidelines [4]. Although it was a low-cost, practical tool, a large proportion of PCa patients were still missed by conventional TRUS-GB, especially in the anterior areas of the prostate gland. In addition, the harm of unnecessary biopsies and over-diagnosis of PCa had generally outweighed the benefit of reducing mortality of PCa in elderly men by traditional method [33]. Along with the development of technology, various different biopsy techniques had come out in an attempt to increase the cancer detection. However, due to the lack of direct comparisons of different biopsy strategies, both the clinical surgeons and their patients were still confused in the choice of a better puncture method. Hence, this network meta-analysis was performed to solve the dilemma.
To the best of our knowledge, this was the first network meta-analysis comparing the efficacy and accuracy of different biopsy strategies in the detection of PCa. A total of 20 RCTs including 4,571 patients were ultimately enrolled. Besides, six different PCa biopsy strategies (TRUS-GB, TPUS-GB, CEUS, MRI-GB, FUS-GB as well as FUS-GB plus TRUS-GB) and four clinical outcomes (overall PCa detection, significant PCa detection, insignificant PCa detection as well as comparison of different TRUS-guided biopsy cores), were simultaneously analyzed in this study. In terms of overall PCa detection and significant PCa detection rate, our results indicated that FUS-GB or FUS-GB plus TRUS-GB showed their superiority. As for TRUS-GB or TPUS-GB, compared with others, they had the lowest overall detection rate, not to mention its inferiority in significant PCa detection.
In the detection of insignificant PCa, the rate of MRI-GB, TPUS-GB or TRUS-GB was relatively higher. Coupled with previous results, we found that TPUS-GB or TRUS-GB had a relatively lower overall or significant PCa detection rate and a relatively higher insignificant PCa detection rate. Associated with the increasing recognition of over-diagnosis and over-treatment of PCa, these two conventional random biopsy strategies might easily contribute to the formation of this situation. Strangely, our results also presented the negative role of MRI-GB in the detection of insignificant PCa. Usually, MRI-GB had a higher degree of accuracy in the detection of clinically significant PCa and several researches had demonstrated it [16]. After re-checking our original data, this could contribute its insufficient data. More relevant data of MRI-GB were required in subsequent researches to rectify our results.
Last but not least, as for TRUS-guided biopsy, the general trend was that the more cores, the higher the detection rate. Nevertheless the 15-core TRUS-guided biopsy showed a relatively lower detection rate which could attribute to two reasons. On the one hand, the more the cores, the higher rate of occurring adverse reactions. On the other hand, RCTs regarding the different cores of TRUS-guided biopsy was quite sparse. Therefore, upcoming prospective RCTs were required to provide more available data. As showed in the results, we could easily find that a combination of different biopsy strategies could easily enhance the PCa detection rate, which brought us a novel idea with respect to increasing its effectiveness. Furthermore, complications and adverse reactions should be carefully evaluated before applying this kind of method into clinical use.
The advent of new biopsy technology such as FUS-GB or MRI-GB and so on, had changed strategies of prostate biopsy, which allowed clinical surgeons to operate biopsy directly to the suspected areas rather than randomly [49, 50]. Usually, it seemed reasonable that the more cores, the higher the PCa detection rate in terms of conventional random biopsy. However, when compared with random biopsy, it was interesting that targeted biopsy could yield a significantly higher positivity rate for detecting PCa and thus require fewer cores [11]. Moreover, compared with traditional random biopsy, targeted biopsy had greater potential to improve benefit-to-harm ratio, in the era of PCa's over-diagnosis and over-treatment [32]. Obviously, this observation was in line with our results. We could easily conclude that targeted biopsy was more effective than traditional random biopsy, which shed light on the potential of FUS-GB or TRUS-GB plus FUS-GB as the first-line technique for detecting PCa in the following years.
In addition to different biopsy methods, there were also several other factors influencing the efficacy of detection of PCa. Accumulating data indicated that risk-stratification before biopsy was crucial for detection rate and unnecessary biopsies, such as prostate imaging and reporting data system (PI-RADS) score, different PSA or Gleason score levels and so on[33, 35]. According to the study by Alberts et.al [33], the detection rate of overall PCa or significant PCa in lesions with PI-RADS scores of 4-5 was markedly higher than in those with a PI-RADS score of 3. On the other hand, a meta-analysis by Hu et.al demonstrated that a high body mass index correlated positively with prostate cancer detection, especially high-grade prostate cancer detection [51].
As far as we were concerned, all of the results above-mentioned were made without the consideration of the complications of different biopsy strategies, nor the cost-effective way. Just from a technical perspective, FUS-GB or TRUS-guided biopsy plus FUS-GB biopsy showed their advantages. However, complications of different biopsy strategies and the cost-benefit analysis were another two major concerns, which a considerable number of patients would pay attention to. However, all of the available literature was rarely involved in it. Hopefully, subsequent analysis should take into account of these two aforementioned aspects.
The strength of our study was its strict inclusion criteria for RCTs, which could have a clear impact on the group baseline features and provide enough statistical power. In addition, it was the first time for us to put forward the hierarchy of the efficacy of different PCa biopsy strategies, which was anticipated to guide the clinical work. Nonetheless, several potential limitations should be paid attention to before fully understanding this aim of study. Firstly, although a total of 20 RCTs were finally included, the number of RCTs enrolled in significant PCa detection, insignificant PCa detection and comparison of different TRUS-guided biopsy cores were relatively small, which could result in some bias. Secondly, the research of the complications of different biopsy strategy or the cost-benefit analysis was not involved in this article, due to the scarcity of relevant data. Thus, further stratified analyses based on a larger set of samples were recommended, which could be an important issue for future research.
Taken together, the present network meta-analysis combining both direct and indirect evidences from currently available studies was performed to compare the merits of different biopsy strategies. Our results were inclusive and consistent with previous studies. The results shed light on that FUS-GB or FUS-GB plus TRUS-GB showed their superiority, compared with other puncture methods, in the detection of PCa. Moreover, TPUS or TRUS-guided biopsy was more easily associated with the harms of unnecessary biopsies and over-diagnosis, which should balance against the benefit of mortality reduction achieved by screening. As for targeted biopsy, it could yield a comparable or even a better effect with fewer cores, compared with traditional random biopsy.
Conclusion
In summary, the outcomes of the present network meta-analysis shed light on that FUS-GB or FUS-GB plus TRUS-GB showed their superiority, compared with other puncture methods, in the detection of PCa. Besides, TPUS or TRUS-GB was more easily associated with the harms of unnecessary biopsies and over-diagnosis. In terms of TRUS-GB, the general trend was that the more biopsy cores, the higher the overall PCa detection rate. As for targeted biopsy, it was obviously more effective than traditional random biopsy. The subsequent prospective RCTs were required to provide more available data to elaborate the efficacy of different biopsy strategies.
Supplementary Material
Supplementary figures.
Acknowledgements
This article was funded by Medical key talent of Jiangsu Province: ZDRCA2016009 which had no role in study design, data collection, data analysis, data interpretation or writing of the report. The corresponding author had full access to all the data in the study and had final responsibility for the decision to submit for publication.
Authors' Contributions
XH.M, NH.S: Protocol/project development;
YM.W, C.C, YC.W: Data collection or management;
X.Z, QJ.Z: Data analysis;
Y.W, ZQ.Q, JD.Z: Manuscript writing/editing.
Competing Interests
The authors have declared that no competing interest exists.
References
1. Siegel RL, Miller KD, Jemal A. Cancer statistics, 2016. Ca A Cancer Journal for Clinicians. 2016;66:7
2. Ghafoori M, Velayati M, Aliyari Ghasabeh M, Shakiba M, Alavi M. Prostate Biopsy Using Transrectal Ultrasonography; The Optimal Number of Cores Regarding Cancer Detection Rate and Complications. Iran J Radiol. 2015;12:e13257
3. Schröder FH, Hugosson J, Roobol MJ, Tammela TLJ, Ciatto S, Nelen V. et al. Screening and prostate-cancer mortality in a Randomized European Study. New England Journal of Medicine. 2009;360:1320
4. Heidenreich A, Bastian PJ, Bellmunt J, Bolla M, Joniau S, Van dKT. et al. EAU guidelines on prostate cancer. part 1: screening, diagnosis, and local treatment with curative intent-update 2013. European urology. 2014;65:124-37
5. Rothwax JT, George AK, Wood BJ, Pinto PA. Multiparametric MRI in biopsy guidance for prostate cancer: fusion-guided. BioMed research international. 2014;2014:439171
6. Puech P, Rouvière O, Renard-Penna R, Villers A, Devos P, Colombel M. et al. Prostate cancer diagnosis: multiparametric MR-targeted biopsy with cognitive and transrectal US-MR fusion guidance versus systematic biopsy-prospective multicenter study. Radiology. 2013;268:461-9
7. Dickinson L, Ahmed HU, Allen C, Barentsz JO, Carey B, Futterer JJ. et al. Magnetic resonance imaging for the detection, localisation, and characterisation of prostate cancer: recommendations from a European consensus meeting. European urology. 2011;59:477
8. Villers A, Marliere F, Ouzzane A, Puech P, Lemaitre L. MRI in addition to or as a substitute for prostate biopsy: the clinician's point of view. Diagnostic and interventional imaging. 2012;93:262-7
9. Emiliozzi P, Scarpone P, DePaula F, Pizzo M, Federico G, Pansadoro A. et al. The incidence of prostate cancer in men with prostate specific antigen greater than 4.0 ng/ml: a randomized study of 6 versus 12 core transperineal prostate biopsy. The Journal of urology. 2004;171:197-9
10. Delgado Oliva F, Arlandis Guzman S, Bonillo Garcia M, Broseta Rico E, Boronat Tormo F. Diagnostic performance of power doppler and ultrasound contrast agents in early imaging-based diagnosis of organ-confined prostate cancer: Is it possible to spare cores with contrast-guided biopsy? Eur J Radiol. 2016;85:1778-85
11. Arsov C, Rabenalt R, Blondin D, Quentin M, Hiester A, Godehardt E. et al. Prospective randomized trial comparing magnetic resonance imaging (MRI)-guided in-bore biopsy to MRI-ultrasound fusion and transrectal ultrasound-guided prostate biopsy in patients with prior negative biopsies. European urology. 2015;68:713-20
12. Brock M, von Bodman C, Palisaar RJ, Loppenberg B, Sommerer F, Deix T. et al. The impact of real-time elastography guiding a systematic prostate biopsy to improve cancer detection rate: a prospective study of 353 patients. The Journal of urology. 2012;187:2039-43
13. Kojima M, Hayakawa T, Saito T, Mitsuya H, Hayase Y. Transperineal 12-core systematic biopsy in the detection of prostate cancer. International Journal of Urology Official Journal of the Japanese Urological Association. 2001;8:301-7
14. Roy C, Buy X, Lang H, Saussine C, Jacqmin D. Contrast enhanced color Doppler endorectal sonography of prostate: efficiency for detecting peripheral zone tumors and role for biopsy procedure. The Journal of urology. 2003;170:69-72
15. Mitterberger M, Horninger W, Pelzer A, Strasser H, Bartsch G, Moser P. et al. A prospective randomized trial comparing contrast-enhanced targeted versus systematic ultrasound guided biopsies: Impact on prostate cancer detection. The Prostate. 2007;67:1537-42
16. Robertson NL, Emberton M, Moore CM. MRI-targeted prostate biopsy: a review of technique and results. Nature Reviews Urology. 2013;10:589
17. Dickinson L, Ahmed HU, Allen C, Barentsz JO, Carey B, Futterer JJ. et al. Magnetic resonance imaging for the detection, localisation, and characterisation of prostate cancer: recommendations from a European consensus meeting. European urology. 2011;59:477-94
18. Uriburu-Pizarro F, Kasivisvanathan V, Puech P, Villers A. Pre-biopsy MRI as an adjunct for cancer detection in men with elevated PSA and no previous biopsy. Translational Andrology & Urology. 2017;6:387
19. Hadaschik BA, Kuru TH, Tulea C, Rieker P, Popeneciu IV, Simpfendörfer T. et al. A novel stereotactic prostate biopsy system integrating pre-interventional magnetic resonance imaging and live ultrasound fusion. Journal of Urology. 2011;186:2214
20. Koh J, Jung DC, Oh YT, Yoo MG, Noh S, Han KH. et al. Additional Targeted Biopsy in Clinically Suspected Prostate Cancer: Prospective Randomized Comparison between Contrast-Enhanced Ultrasound and Sonoelastography Guidance. Ultrasound in Medicine & Biology. 2015;41:2836-41
21. Caldwell DM, Ades AE, Higgins JPT. Simultaneous comparison of multiple treatments: combining direct and indirect evidence. Bmj. 2005;331:897-900
22. Lu G, Ades AE. Combination of direct and indirect evidence in mixed treatment comparisons. Statistics in Medicine. 2004;23:3105
23. Higgins J, Green SE. Cochrane Handbook for Systematic Reviews of Interventions Version 5.1.0. The Cochrane Collaboration (Eds). Naunyn-Schmiedebergs Archiv für experimentelle Pathologie und Pharmakologie. 2011;2011:S38
24. Egger M, Davey SG, Schneider M, Minder C. Bias in meta-analysis detected by a simple, graphical test. BMJ. 1997:315 629-34
25. Valkenhoef GV, Kuiper J. gemtc: Network Meta-Analysis Using Bayesian Methods: John Wiley & Sons, Ltd; 2016.
26. Lumley T. Network meta-analysis for indirect treatment comparisons. Statistics in Medicine. 2002;21:2313-24
27. Wu HY, Huang JW, Lin HJ, Liao WC, Peng YS, Hung KY. et al. Comparative effectiveness of renin-angiotensin system blockers and other antihypertensive drugs in patients with diabetes: systematic review and bayesian network meta-analysis. Bmj. 2013;347:f6008
28. Gelman A, Rubin DB. Inference from Iterative Simulation Using Multiple Sequences. Statistical Science. 1992;7:457-72
29. Zhang X, Shen P, He Q, Yin X, Chen Z, Gui H. et al. Different lasers in the treatment of benign prostatic hyperplasia: a network meta-analysis. Scientific reports. 2016;6:23503
30. Du S, Ye J, Chen H, Li X, Lin Q. Interventions for Treating 3- or 4-part proximal humeral fractures in elderly patient: A network meta-analysis of randomized controlled trials. International Journal of Surgery. 2017;48:240
31. Dias S, Welton NJ, Caldwell DM, Ades AE. Checking consistency in mixed treatment comparison meta-analysis. Statistics in Medicine. 2010;29:932-44
32. Porpiglia F, Manfredi M, Mele F, Cossu M, Bollito E, Veltri A. et al. Diagnostic Pathway with Multiparametric Magnetic Resonance Imaging Versus Standard Pathway: Results from a Randomized Prospective Study in Biopsy-naive Patients with Suspected Prostate Cancer. European urology. 2017;72:282-8
33. Alberts AR, Schoots IG, Bokhorst LP, Drost FH, van Leenders GJ, Krestin GP. et al. Characteristics of Prostate Cancer Found at Fifth Screening in the European Randomized Study of Screening for Prostate Cancer Rotterdam: Can We Selectively Detect High-grade Prostate Cancer with Upfront Multivariable Risk Stratification and Magnetic Resonance Imaging?. European urology. 2017
34. Taverna G, Bozzini G, Grizzi F, Seveso M, Mandressi A, Balzarini L. et al. Endorectal multiparametric 3-tesla magnetic resonance imaging associated with systematic cognitive biopsies does not increase prostate cancer detection rate: a randomized prospective trial. World J Urol. 2016;34:797-803
35. Baco E, Rud E, Eri LM, Moen G, Vlatkovic L, Svindland A. et al. A Randomized Controlled Trial To Assess and Compare the Outcomes of Two-core Prostate Biopsy Guided by Fused Magnetic Resonance and Transrectal Ultrasound Images and Traditional 12-core Systematic Biopsy. European urology. 2016;69:149-56
36. Rastinehad AR, Turkbey B, Salami SS, Yaskiv O, George AK, Fakhoury M. et al. Improving detection of clinically significant prostate cancer: magnetic resonance imaging/transrectal ultrasound fusion guided prostate biopsy. The Journal of urology. 2014;191:1749-54
37. Taverna G, Morandi G, Seveso M, Giusti G, Benetti A, Colombo P. et al. Colour Doppler and microbubble contrast agent ultrasonography do not improve cancer detection rate in transrectal systematic prostate biopsy sampling. BJU international. 2011;108:1723-7
38. Rodríguezcovarrubias F, Gonzálezramírez A, Aguilardavidov B, Castillejosmolina R, Sotomayor M, Feriabernal G. Extended sampling at first biopsy improves cancer detection rate: results of a prospective, randomized trial comparing 12 versus 18-core prostate biopsy. Journal of Urology. 2011;185:2132
39. Pinto PA, Chung PH, Rastinehad AR, Baccala AA Jr, Kruecker J, Benjamin CJ. et al. Magnetic resonance imaging/ultrasound fusion guided prostate biopsy improves cancer detection following transrectal ultrasound biopsy and correlates with multiparametric magnetic resonance imaging. The Journal of urology. 2011;186:1281-5
40. Cerruto MA, Vianello F, D'Elia C, Artibani W, Novella G. Transrectal versus transperineal 14-core prostate biopsy in detection of prostate cancer: a comparative evaluation at the same institution. European Urology Supplements. 2010;9:85 -
41. Rosette JJMCHdl, Wink MH, Mamoulakis C, Wondergem N, Kate FJCT, Zwinderman K. et al. Optimizing Prostate Cancer Detection: 8 Versus 12-Core Biopsy Protocol. Journal of Urology. 2009;182:1329-36
42. Rochester MA, Griffin S, Chappell B, Mcloughlin J. A Prospective Randomised Trial of Extended Core Prostate Biopsy Protocols Utilizing 12 versus 15 Cores. Urologia Internationalis. 2009;83:155-9
43. Hara R, Jo Y, Fujii T, Kondo N, Yokoyoma T, Miyaji Y. et al. Optimal approach for prostate cancer detection as initial biopsy: prospective randomized study comparing transperineal versus transrectal systematic 12-core biopsy. Urology. 2008;71:191-5
44. Taymoorian K, Thomas A, Slowinski T, Khiabanchian M, Stephan C, Lein M. et al. Transrectal broadband-Doppler sonography with intravenous contrast medium administration for prostate imaging and biopsy in men with an elevated PSA value and previous negative biopsies. Anticancer research. 2007;27:4315-20
45. Mitterberger M, Horninger W, Pelzer A, Strasser H, Bartsch G, Moser P. et al. A prospective randomized trial comparing contrast-enhanced targeted versus systematic ultrasound guided biopsies: impact on prostate cancer detection. The Prostate. 2007;67:1537-42
46. Paul R, Scholer S, van Randenborgh H, Kubler H, Alschibaja M, Busch R. et al. Optimization of prostatic biopsy: a prospective randomized trial comparing the sextant biopsy with a 10-core biopsy. Impact of prostatic region of sampling. Urol Int. 2005;74:203-8
47. Kim JW, Lee HY, Hong SJ, Chung BH. Can a 12 core prostate biopsy increase the detection rate of prostate cancer versus 6 core?: a prospective randomized study in Korea. Yonsei Medical Journal. 2004;45:671
48. Emiliozzi P, Corsetti A, Tassi B, Federico G, Martini M, Pansadoro V. Best approach for prostate cancer detection: a prospective study on transperineal versus transrectal six-core prostate biopsy. Urology. 2003;61:961-6
49. Halpern EJ, Frauscher F, Strup SE, Nazarian LN, O'Kane P, Gomella LG. Prostate: high-frequency Doppler US imaging for cancer detection. Radiology. 2002;225:71
50. Ahmed HU, Kirkham A, Arya M, Illing R, Freeman A, Allen C. et al. Is it time to consider a role for MRI before prostate biopsy? Nature Reviews Clinical Oncology. 2009;6:197
51. Hu MB, Liu SH, Jiang HW, Bai PD, Ding Q. Obesity Affects the Biopsy-Mediated Detection of Prostate Cancer, Particularly High-Grade Prostate Cancer: A Dose-Response Meta-Analysis of 29,464 Patients. PloS one. 2014;9:e106677
Author contact
![]() Corresponding authors: Ninghong Song, Department of Urology, The First Affiliated Hospital of Nanjing Medical University, No. 300 Guangzhou Road, Nanjing, 210029, China. E-mail: songninghong_urolcom; TEL: +08613851490672 and Xianghu Meng, Department of Urology, The First Affiliated Hospital of Nanjing Medical University, No. 300 Guangzhou Road, Nanjing, 210029, China. E-mail: xhmeng888com; TEL: +08615951945520
Corresponding authors: Ninghong Song, Department of Urology, The First Affiliated Hospital of Nanjing Medical University, No. 300 Guangzhou Road, Nanjing, 210029, China. E-mail: songninghong_urolcom; TEL: +08613851490672 and Xianghu Meng, Department of Urology, The First Affiliated Hospital of Nanjing Medical University, No. 300 Guangzhou Road, Nanjing, 210029, China. E-mail: xhmeng888com; TEL: +08615951945520