3.2
Impact Factor
ISSN: 1837-9664
J Cancer 2018; 9(13):2284-2294. doi:10.7150/jca.24815 This issue Cite
Research Paper
Risk Stratification of Upper Urinary Tract Urothelial Carcinoma Patients for Survival Prediction: A Simple Summation Scoring Method
1. Department of Medical Imaging and Intervention, Linkou Chang Gung Memorial Hospital, College of Medicine, Chang Gung University, Taoyuan, Taiwan
2. Department of Hematology-Oncology, Linkou Chang Gung Memorial Hospital, College of Medicine, Chang Gung University, Taoyuan, Taiwan
3. Department of Urology, Linkou Chang Gung Memorial Hospital, College of Medicine, Chang Gung University, Taoyuan, Taiwan
4. Department of Nephrology, Linkou Chang Gung Memorial Hospital, College of Medicine, Chang Gung University, Taoyuan, Taiwan
Received 2018-1-8; Accepted 2018-4-28; Published 2018-6-6
Abstract
Purpose: To stratify upper urinary tract urothelial carcinoma (UTUC) patients into risk groups in terms of 5-year survival.
Methods and materials: All potential UTUC patients recorded in our cancer registry database from 1997 to 2011 were evaluated for authentic presence of UTUC. Age at diagnosis, sex, organ involvement, dialysis, renal transplantation status, clinical stage, survival to the last follow-up, and the cause of death of each patient were recorded. All patients were randomized into a developmental set or a validation set at a 1:1 ratio. Survival prediction models and scores were developed using the developmental set and validated in terms of discrimination and calibration using the validation set. Patients were stratified into risk groups using the summed risk scores and their survival compared by the log rank test.
Results: We enrolled 1,120 authentic UTUC patients. In the developmental set, older age, male sex, and higher clinical staging were significant predictors of 5-year death after controlling for other variables. Based on these three clinical variables, patients were stratified into low-, intermediate-, high-, and very high-risk groups using the summed risk scores. The 5-year all-cause and cancer-specific survivals of UTUC patients in the low-, intermediate-, high-, and very high-risk groups were 83.0% and 85.0%, 57.7% and 70.9%, 16.8% and 26.3%, and 2.2% and 7.5%, respectively (p < 0.001). Both discrimination and calibration were good for the validation set (overall concordance index = 0.762).
Conclusions: Stratification of UTUC patients using summed risk scores was a simple and useful way to estimate survivals and to select appropriate treatments.
Keywords: upper urinary tract, urothelial carcinoma, survival, stratification, risk score
Introduction
Urothelial carcinoma (UC) ranks the fourth most common cancer worldwide after prostate/breast, lung, and colon cancers [1], and the ninth most common cancer in Taiwan [2]. However, upper urinary tract urothelial carcinomas (UTUCs) are uncommon, accounting for only 5-10% of all UCs, as most UCs are located in the urinary bladder [1, 3]. UTUC may develop not only in patients with normal renal function but also in patients on dialysis and renal transplant recipients [3-8]. Most UTUC patients enjoy good prognoses after standard treatment of radical nephroureterectomy (RNU) [9], but biologically aggressive UTUC may be fatal even before treatment [2]. Thus, predicting the survival of UTUC patients at diagnosis is crucial when urologists, medical oncologists, and radiation physicians assess disease severity, seek to choose optimal treatments, and estimate the probabilities of survival for certain times when counseling patients and their families [9]. To the best of our knowledge, no predictive model for UTUC patients applicable at the time of diagnosis has been described in the literature. Rather, published predictive models focus on the postoperative survival of UTUC patients undergoing RNU; such patients usually have localized tumors [9-16]. Thus, the pathological staging used in these predictive models are available only after histological examination of surgical RNU specimens and the models cannot be used to guide clinical decision-making for treatment selection at the time of diagnosis. Therefore, we conducted this study to develop a predictive model for pre-treatment UTUC patients and to stratify UTUC patients into different risk groups in terms of 5-year survival using the summed risk scores of the predictive models.
Materials and methods
Patients
After approval was obtained from the institutional review board of our hospital, we retrieved all records of the cancer registry of our hospital from 1997 to 2011 that were potentially primary UTUCs, thus meeting two inclusion criteria: (1) the third edition of morphological codes of the International Classification of Diseases for Oncology (ICD-O-3) of urothelial carcinomas, including 8120, 8130, 8131, 8082, 8122, 8031, 8020 and 8050 [17], and, (2) the topographical codes of ICD-O-3, including C64.9, C65.9, C66.9, C68.8, and C68.9; or those of the International Classification of Disease, 9th revision (ICD-9) including 189.0, 189.1, 189.2, 189.8, and 189.9 [18]. For patients with multiple UTUC records, the first or combined record for each patient was used. Patients were excluded if: (1) they had a malignant disease other than primary UTUC; or, (2) their information was insufficient for validation of primary UTUC or the location thereof. All validated UTUC patients with known tumor locations as revealed by histological diagnosis, imaging diagnosis, endourological diagnosis, or medical records (detailed review of medical charts) were eligible for this study. All eligible patients were randomized into a developmental set or a validation set at a 1:1 ratio to derive and test predictive models of 5-year all-cause survival (ACS) and cancer-specific survival (CSS), respectively.
Characteristics and survival status of UTUC patients
For each patient, age at diagnosis, sex, the involved organs, hemodialysis status, renal transplantation status, and clinical stage were recorded via medical chart review. The locations of all UTUCs were recorded as the renal pelvis or ureter. Multi-organ UTUC reflected UC in two or more organs of the upper urinary tract. Hemodialysis and renal transplantation status were considered positive if a patient had started regular hemodialysis or had undergone renal transplantation at least 3 months prior to UTUC diagnosis, respectively. Clinical stage was categorized as localized, regional, or metastatic, based on imaging studies, endoscopic findings, histological examinations, and medical chart records. The survival status of each patient at the last follow-up (i.e., until death, the last medical visit/telephone interview, or the end of the study [August 31, 2015]) were obtained from the Taiwan Cancer Registry, which records regular annual follow-ups. The follow-up duration of each patient was the time in years between UTUC diagnosis and the last follow-up. The cause of death of each patient was taken from authorized Taiwanese death certificates filed in the Taiwan Death Registry and recorded in the Taiwan Cancer Registry.
Statistical Methods
Descriptive clinical characteristics are summarized as counts and proportions for categorical variables and as means with standard deviations (SDs) for continuous variables. Age at diagnosis was further categorized into groups for analyses of ACS and CSS. In comparisons between the developmental and validation sets, continuous variables were evaluated using student's t-test, while categorical variables were evaluated using chi-squared test. Predictive models for 5-year ACS and CSS of the developmental set were analyzed using multivariate Cox proportional hazard analysis (CPHA) to select the optimal models (those with the lowest Akaike information criterion values under parsimonious principles. The discrimination afforded by the predictive models was analyzed using the validation set by calculating the overall concordance index [19, 20]. Risk scores were determined from the ß-coefficients of the predictive models and further calibrated in the validation set using calibration plots [21]. All UTUC patients were stratified into risk groups for 5-year survival using summed risk scores; the 5-year ACS and CSS were compared among the risk groups using the log rank test. All statistical analyses were performed with the aid of SAS University Version (SAS Institute Inc., 2013. SAS/ACCESS 9.4 interface to ADABAS. Cary, NC: SAS institute Inc., USA). A p-value < 0.05 was considered to reveal statistical significance on two-tailed analyses.
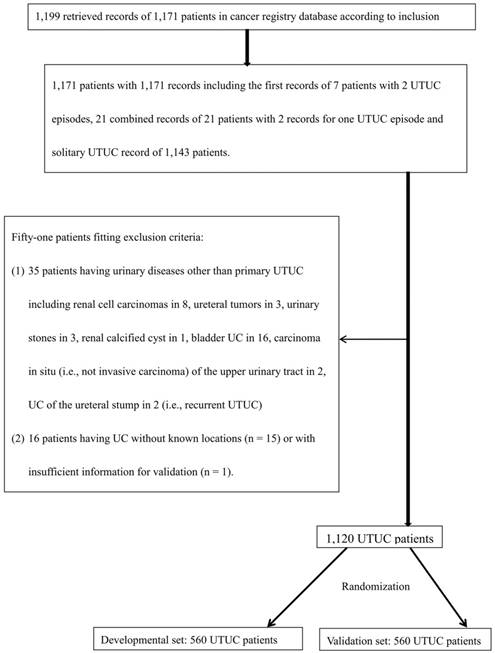
Flow diagram for validation of data from UTUC patients retrieved from the cancer registry database of our hospital from 1997-2011, and randomization into two sets. UTUC: upper urinary tract urothelial carcinoma; UC: urothelial carcinoma.
Results
Descriptive statistics and overall patient survival
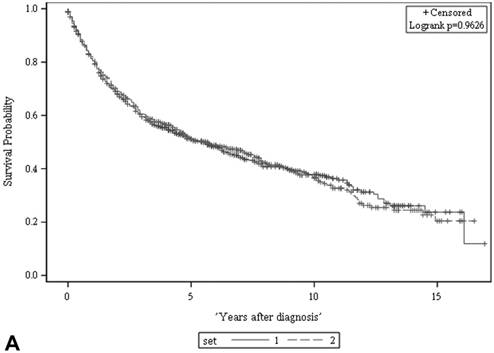
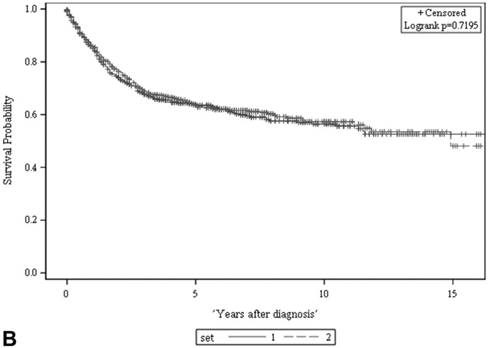
We retrieved 1,199 potentially eligible UTUC records entered into the cancer registry database of our hospital between 1997 and 2011. A total of 1,120 patients shown to have primary UTUC at known locations were eligible for this study and were further randomized into a developmental set and a validation set (Figure 1). Of the 560 patients in the developmental set, most had been diagnosed at 60-79.9 years of age (64%), most were female (55%), and most had clinically localized disease (83%). There were no significant differences in terms of clinical characteristics, follow-up duration, or deaths from UTUC, between the two sets (Table 1). The 5-year ACSs and CSSs of the two sets also did not differ significantly on the log rank test (both p > 0.05, Figure 2), and were about 51% and 64%, respectively.
Predictive models of survival
Univariate CPHA analysis of the developmental set (Table 2) showed that older age at diagnosis, male sex, and higher clinical staging were associated with increased risks of ACS and CSS (all p < 0.05). Other clinical characteristics, including renal UC, ureteral UC, multi-organ UC, being on dialysis, and renal transplantation, were not associated with ACS or CSS on univariate CPHA. Predictive models for ACS and CSS in the developmental set derived using multivariate CPHA (Table 3) showed that clinically metastatic tumors (compared with clinically localized tumors), age ≥ 80 years (compared with age < 60 years), and male (compared with female) sex were associated with hazard ratios (HRs) of 6.737 and 8.652, 2.959 and 2.653, and 1.410 and 1.359 for ACS and CSS, respectively (all p < 0.05). The discrimination afforded by the predictive model as revealed by the overall concordance index showed good performance within both the developmental set (0.767, 95% confidence interval (CI): 0.663-0.858 and the validation set (0.762, 95% CI: 0.658-0.853).
Risk groups stratified by summed risk scores
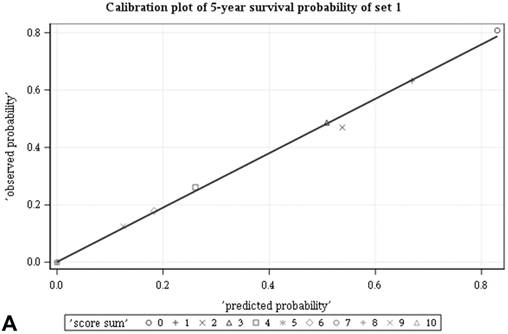
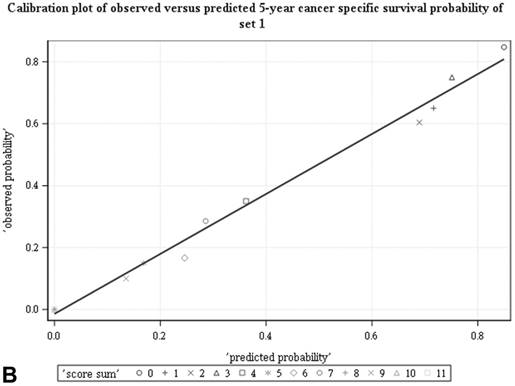
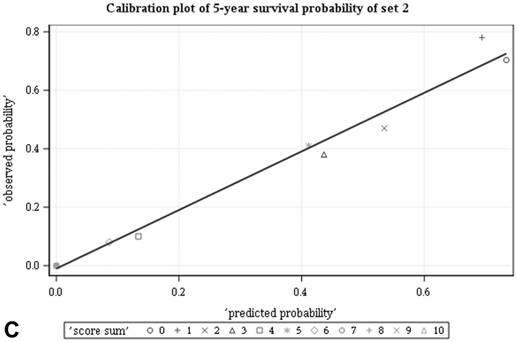
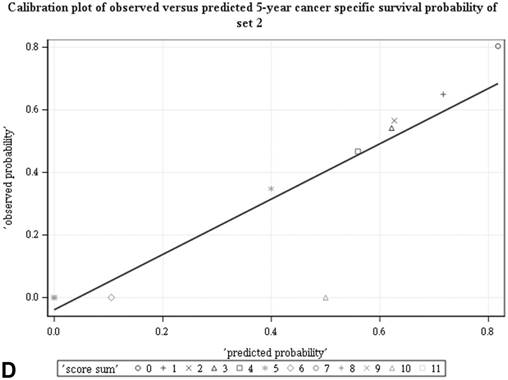
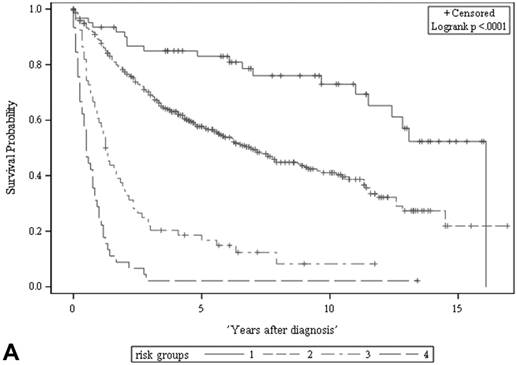
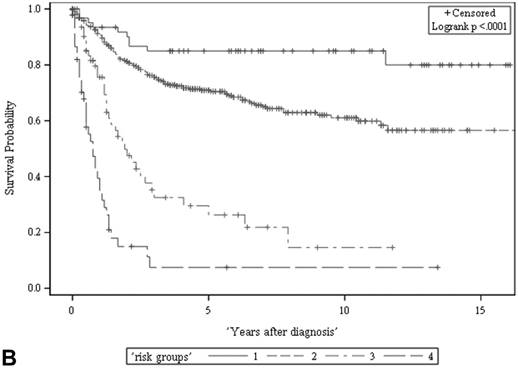
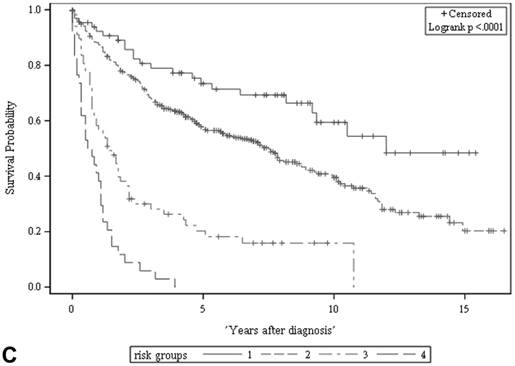
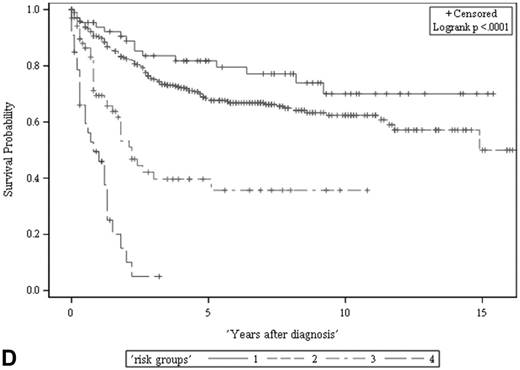
Among all the risk scores derived from coefficients of the predictive models for ACS and CSS, clinically metastatic tumors had the highest scores (6 and 7, respectively; Table 3). Conversely, age < 60 years, female sex, and clinically localized tumors had the lowest scores (0) for both ACS and CSS. The summed risk scores showed good agreement between the observed and predicted probabilities of 5-year ACS and CSS in the developmental set, as was demonstrated using the validation set (Figure 3). All patients of the developmental set were stratified into four risk groups in terms of ACS and CSS: low, intermediate, high, and very high (summed risk scores of 0, 1-3, 4-6 and ≥ 7, respectively; Table 4). There were significant differences in terms of both ACS and CSS among the four risk groups of the developmental and validation sets (Figure 4).
There was no significant difference in either ACS (A) or CSS (B) between the two sets (both p > 0.05, log rank test). The 5-year ACS and CSS of the developmental set and the validation set were 51.1 ± 2.2% (95% CI: 46.8-55.4%) and 63.8 ± 2.2 (95% CI: 59.5-68.1%), and 51.3 ± 2.2% (95% CI: 47.0-55.6%) and 63.5 ± 2.2 (95% CI: 59.2-67.8%), respectively. ACS: all-cause survival; CSS: cancer-specific survival; set 1: developmental set; set 2: validation set.
Comparisons of clinical characteristics, follow-up durations, and deaths caused by UTUC between the developmental set and the validation set.
| Variable | Developmental set (n = 560) | Validation set (n = 560) | p-value |
|---|---|---|---|
| Age at diagnosis (y) | 66.9 ± 11.1 (25.3-94.7) | 66.4 ± 11.5 (27.0-95.9) | 0.419 |
| Age group at diagnosis (y) | 0.429 | ||
| < 60 | 146 (26.1%) | 150 (26.8%) | |
| 60-69.9 | 169 (30.2%) | 184 (32.9%) | |
| 70-79.9 | 189 (33.8%) | 164 (29.3%) | |
| ≥ 80 | 56 (10.0%) | 62 (11.1%) | |
| Sex | 0.279 | ||
| Male | 255 (45.5%) | 237 (42.3%) | |
| Female | 305 (54.5%) | 323 (57.7%) | |
| Renal UC | 0.950 | ||
| Yes | 370 (66.1%) | 369 (65.9%) | |
| No | 190 (33.9%) | 191 (34.1%) | |
| Ureter UC | 0.719 | ||
| Yes | 309 (55.2%) | 303 (54.1%) | |
| No | 251 (44.8%) | 257 (45.9%) | |
| Multiple organ UTUC | 0.615 | ||
| Yes | 128 (22.9%) | 121 (21.6%) | |
| No | 432 (77.1%) | 439 (78.4%) | |
| Dialysisa | 0.382 | ||
| Yes | 57 (10.6%) | 66 (12.3%) | |
| No | 479 (89.4%) | 469 (87.7%) | |
| Renal transplantationb | 0.143 | ||
| Yes | 15 (2.8%) | 8 (1.5%) | |
| No | 524 (97.2%) | 529 (98.5%) | |
| Clinical staging category | 0.278 | ||
| Localized | 466 (83.2%) | 479 (85.5%) | |
| Regional | 52 (9.3%) | 52 (9.3%) | |
| Distant | 42 (7.5%) | 29 (5.2%) | |
| Follow-up duration (y) | 4.6 ± 4.1 | 4.7 ± 4.0 | 0.706 |
| Survival status at last follow-up | 0.904 | ||
| Alive | 239 (42.7%) | 237 (42.3%) | |
| Death | 321 (57.3%) | 323 (57.7%) | |
| Death from UTUC | 0.803 | ||
| Yes | 204 (36.4%) | 200 (35.7%) | |
| No | 356 (63.6%) | 360 (64.3%) |
y: years; UC: urothelial carcinoma; UTUC: upper urinary tract urothelial carcinoma.
a49 records lacked information on dialysis status.
b44 records lacked information on renal transplantation status.
Univariate CPHA of all-cause and cancer-specific survival of UTUC patients using data from the developmental set.
| Variables | All-cause survival | Cancer-specific survival | |||||
|---|---|---|---|---|---|---|---|
| ß | HR (95% CI) | p value | ß | HR (95% CI) | p-value | ||
| Age at diagnosis (y) | 0.030 | 1.031 (1.019-1.042) | < 0.001* | 0.022 | 1.022 (1.009-1.036) | 0.001* | |
| Age group at diagnosis (y) | < 60 | Reference | 1 | Reference | 1 | ||
| 60-69.9 | 0.471 | 1.601 (1.166-2.199) | 0.004* | 0.374 | 1.454 (0.988-2.139) | 0.057 | |
| 70-79.9 | 0.643 | 1.901 (1.398-2.587) | < 0.001* | 0.394 | 1.483 (1.013-2.173) | 0.043* | |
| ≥ 80 | 0.916 | 2.500 (1.673-3.738) | < 0.001* | 0.773 | 2.166 (1.328-3.532) | 0.002* | |
| Sex | Female | Reference | 1 | Reference | 1 | ||
| Male | 0.313 | 1.367 (1.098-1.702) | 0.005* | 0.286 | 1.331 (1.012-1.752) | 0.041* | |
| Renal UC | No | Reference | 1 | Reference | 1 | ||
| Yes | 0.103 | 1.108 (0.878-1.398) | 0.386 | 0.099 | 1.104 (0.826-1.475) | 0.505 | |
| Ureter UC | No | Reference | 1 | Reference | 1 | ||
| Yes | 0.090 | 1.094 (0.876-1.366) | 0.427 | -0.067 | 0.935 (0.709-1.232) | 0.633 | |
| Multiple organ UTUC | No | Reference | 1 | Reference | 1 | ||
| Yes | 0.245 | 1.278 (0.995-1.642) | 0.055 | 0.038 | 1.039 (0.748-1.443) | 0.820 | |
| Dialysis | Yes | Reference | 1 | Reference | 1 | ||
| No | 0.013 | 1.013 (0.709-1.448) | 0.936 | 0.550 | 1.733 (0.987-3.043) | 0.056 | |
| Renal transplantation | Yes | Reference | 1 | Reference | |||
| No | 0.253 | 1.288 (0.609-2.726) | 0.508 | 0.619 | 1.857 (0.594-5.810) | 0.288 | |
| Clinical staging category | Localized | Reference | 1 | l | |||
| Regional | 1.360 | 3.897 (2.837-5.352) | < 0.001* | 1.222 | 3.393 (2.263-5.088) | < 0.001* | |
| Metastatic | 1.929 | 6.881 (4.857-9.749) | < 0.001* | 2.129 | 8.410 (5.670-12.424) | < 0.001* | |
UTUC: upper urinary tract urothelial carcinoma; CPHA: Cox's proportional hazard analysis; y: years; UC: urothelial carcinoma; ß: coefficient; HR: hazard ratio; CI: confidence interval.
*Statistically significant difference.
Predictive models for all-cause and cancer-specific survival of UTUC patients derived via multivariate CPHA using data from the developmental set.
| Variable | All-cause survival | Cancer-specific survival | |||||||
|---|---|---|---|---|---|---|---|---|---|
| ß | HR (95% CI) | p-value | Score | ß | HR (95% CI) | p-value | Score | ||
| Age at diagnosis (y) | < 60 | Reference | 1 | 0 | Reference | 1 | 0 | ||
| 60-69.9 | 0.469 | 1.598 (1.163-2.196) | 0.004* | 1 | 0.411 | 1.508 (1.023-2.224) | 0.038* | 1 | |
| 70-79.9 | 0.582 | 1.790 (1.318-2.431) | < 0.001* | 2 | 0.391 | 1.478 (1.010-2.162) | 0.044* | 1 | |
| ≥ 80 | 1.085 | 2.959 (1.973-4.437) | < 0.001* | 3 | 0.976 | 2.653 (1.618-4.350) | < 0.001* | 3 | |
| Sex | Female | Reference | 1 | 0 | 1 | 0 | |||
| Male | 0.344 | 1.410 (1.128-1.763) | 0.003* | 1 | 0.307 | 1.359 (1.028-1.798) | 0.032* | 1 | |
| Clinical staging category | Localized | Reference | l | 0 | Reference | l | 0 | ||
| Regional | 1.388 | 4.008 (2.911-5.517) | < 0.001* | 4 | 1.250 | 3.491 (2.322-5.249) | < 0.001* | 4 | |
| Metastatic | 1.908 | 6.737 (4.743-9.570) | < 0.001* | 6 | 2.158 | 8.652 (5.815-12.872) | < 0.001* | 7 | |
UTUC: upper urinary tract urothelial carcinoma; CPHA: Cox proportional hazard analysis; y: years; ß: coefficient; HR: hazard ratio; CI: confidence interval.
*Statistically significant difference.
Good agreement was evident between the observed and predicted probabilities of 5-year ACS and CSS in both the developmental set (A, B) and the validation set (C, D), respectively. ACS: all-cause survival; CSS: cancer-specific survival; set 1: developmental set; set 2: validation set.
The ACS and CSS of the four risk groups exhibited significant differences in the developmental set (A, B) and validation set (C, D), respectively (all p < 0.0001, log rank test). The 5-year ACSs of the developmental set were 83.0 ± 4.9% (95% CI: 73.4-92.6%) for low risk group, 57.7 ± 2.6% (95% CI: 52.6-62.8%) for intermediate risk group, 16.8 ± 4.7% (95% CI: 7.6-26.0%) for high risk group, and 2.2 ± 2.2% (95% CI: 0-6.5% and) for very high risk group. The 5-year CCSs of the development set were 85.0 ± 4.6% (95% CI: 75.9-94.0%) for low risk group, 70.9 ± 2.5% (95% CI: 66.1-75.7%) for intermediate risk group, 26.3 ± 7.0% (95% CI: 12.6-39.9%) for high risk group and 7.5 ± 4.8% (95% CI:0-16.8%) for very high risk group. Abbreviations: ACS, all-cause survival; CSS, cancer-specific survival; risk group 1, low-risk group; risk group 2, intermediate-risk group; risk group 3, high-risk group; risk group 4, very high-risk group
Risk stratification for all-cause and cancer-specific survival of UTUC patients by summed risk scores.
| Risk groups (defined by summed scores) | All-cause survival | ||||||||||
| Low (0) | Intermediate (1-3) | High (4-6) | Very high (7-10) | ||||||||
| Clinical Stage | Loc | Loc | Loc | Reg | Met | Reg | Met | ||||
| Sex | F | F | M | M | F | M | F | F | M | F | M |
| Age (y) | < 60 | ≥ 60 | < 80 | ≥ 80 | < 80 | < 70 | < 60 | ≥ 80 | ≥ 70 | ≥ 60 | All |
| Risk group (defined by summed scores) | Cancer-specific survival | ||||||||||
| Low (0) | Intermediate (1-3) | High (4-6) | Very high (7-11) | ||||||||
| Clinical Staging | Loc | Loc | Loc | Reg | Reg | Met | |||||
| Sex | F | F | M | M | All | F | All | ||||
| Age (y) | < 60 | ≥ 60 | < 80 | ≥ 80 | < 80 | ≥ 80 | All | ||||
y: years; Loc: localized; Reg: regional; Met: metastatic; F: female; M: male.
Discussion
Risk stratification for cancer patients at the time of diagnosis is important for clinical decision-making, treatment selection, deciding whether to include patients in a clinical trial designed for evaluation of a specific risk group, establishing common ground for communication, and, most importantly, estimating the life expectancy of the cancer patient under a variety of scenarios [22]. This study provides a risk stratification system for UTUC patients at diagnosis, not only for those with clinically localized tumors that are expected to be surgically removable, but also for patients with clinically regional or metastatic tumors, who may need treatments other than surgery alone. The risk stratification for UTUC patients derived in this study is based on summed risk scores using three clinical characteristics: age, sex, and clinical stage at diagnosis. Risk stratification for UTUC patients is both meaningful and important because significant survival differences were evident among the four risk groups despite the fact that the overall 5-year ACS was about 50%. For low-risk patients (i.e., females aged < 60 years with clinically localized disease), the 5-year survival was 83% in contrast to the survival of only about 20% and 3% of high- and very high-risk patients, respectively. Therefore, our risk stratification method provides an easy and useful way to stratify UTUC patients in terms of survival, helps in treatment selection, and allows prognostic expectations to be communicated.
The summed risk score predictions of ACS and CSS of UTUC patients provided in this study differed from those prediction methods of UTUCs published in the literature in many aspects including clinical variables used for predicting survivals rather than pathological outcomes and pretreatment predictions of survivals at the time of diagnosis (Table 5) [9-15]. All studies for predicting CSS of UTUC patients in the literature were only applicable for patients undergoing nephroureterectomy or RNU. Furthermore, the variables used for predicting survivals in the literature were nearly all pathological characteristics including pathological tumor stage, pathological lymph node stage, tumor grade, architecture, or lymphovascular invasion, which could only be obtained after pathological examinations of surgical specimens. Thus, these predictive methods based on pathological characteristics are not applicable for UTUC patients at the time of diagnosis (i.e.: before surgery and pathological evaluation). Although older age, male gender, and imaging/ureteroscopic findings (related with clinical staging) have been shown as significant predictors for pathological outcomes including tumor grade 3 and pathological stages by Chen et al. and Favaretto et al., respectively [3, 4], this summed risk score method shows that age categories, male and clinical staging categories collectively are directly useful for predicting ACS and CSS of UTUC patients, not just for predicting pathological outcomes. In addition, this summed risk score method for survivals of UTUC patients have a predictive accuracy as 0.762 (95% CI: 0.658-0.853) proved by validation set, which are comparable with those (0.720-0.815) of other predictive methods using mainly pathological variables in the literature [9-13, 15] and probably superior to that (0.648) using the International Union Against Cancer staging system shown by Favaretto [13].
Clinical staging is the most important component of the summed risk score stratifying UTUC patients in terms of 5-year ACS and CSS in the present study. We categorized clinical staging as localized, regional, and metastatic disease in terms of risk stratification. Patients with clinically localized disease (i.e., score 0) were categorized as low risk except for males aged over 80 years, implying that the 5-year survival probability was good. On the other hand, patients with clinically metastatic disease were categorized as very high risk in terms of ACS, except female patients aged < 60 years. In daily practice, clinical staging of UTUC patients should be performed at diagnosis, before selecting treatment options, via thorough work-up, including endourological examinations, imaging studies, histological examination of biopsy specimens, and/or cytology. In the past, computed tomography (CT) staging for UTUC was considered inaccurate for several decades; the reported correct diagnosis rate was only 59.5% [23]. However, the introduction of multidetector helical computed tomography (MDCT) has improved CT staging for UTUC, with reported staging accuracies of 87.8% and 96.6% for all UTUC and localized UTUC cases, respectively [24]. Signs of local invasion into the renal parenchyma, renal sinus fat, and periureteric fat on CT have been shown to be useful predictors of non-organ-confined disease upon pathological staging; the area under the curve was 0.70 [3]. Furthermore, CT afforded a sensitivity and specificity of 87.5% and 98%, respectively, when used to diagnose lymph node metastasis [25]. Thus, clinical staging is useful to predict UTUC patient survival, which may reflect an association with pathological staging.
Age analyzed as either a continuous or categorical variable was an independently significant predictor of the ACS and CSS of UTUC patients upon multivariate analysis in the present study. However, age categories are easier to use, and are more suitable when constructing summed risk scores for stratification. UTUC patients ≥ 80 years of age had HRs of 2.96 and 2.65 in terms of 5-year ACS and CSS, respectively, compared with patients < 60 years of age. Age has been shown to be an independent significant predictor of postoperative ACS or CSS in UTUC patients in several studies [14, 16, 26].
Variables for predicting cancer-specific survival of UTUC patients in the literature and our study
| Authors | Including only patients undergoing surgery | Variables for prediction | Pathological variables | Predication at diagnosis | Accuracy proved by validation set (concordance index) |
|---|---|---|---|---|---|
| Margulis, et al. [14] | Yes (RNU) | age, pT stage, pN stage, tumor grade, architecture, LVI | Yes (all except age) | Not applicable | No |
| Jeldres, et al. [13] | Yes (NU) | age, pT stage, pN stage, tumor grade | Yes (all except age) | Not applicable | Yes (0.754) |
| Cha, et al. [12] | Yes (RNU) | pT stage, pN stage, tumor grade, LVI | Yes (all) | Not applicable | Yes (0.815) |
| Yates, et al. [15] | Yes (NU) | age, pT stage, pN stage, tumor grade, location | Yes (all except age and location) | Not applicable | Yes (0.780) |
| Roupret, et al. [9] | Yes (RNU) | age, pT stage, pN stage, architecture, LVI | Yes (all except age) | Not applicable | Yes (0.790) |
| Seisen, et al. [10] | Yes (RNU and chemotherapy naive) | age, pT stage, tumor grade, architecture, location, LVI | Yes (All except age) | Not applicable | Yes (0.800) |
| Youssef, et al. [11] | Yes (RNU for non-metastatic high grade patients) | pT stage, architecture, LVI, lymphadenectomy | Yes (all except lymphadenectomy) | Not applicable | Yes (0.720) |
| This study | No (Including all UTUC patients whether surgery or not) | age, male, categories of clinical staging | No | Applicable | Yes (0.762) |
NU: nephroureterectomy; RNU: radical nephroureterectomy; pT stage: pathological T stage; pN stage: pathological N stage; LVI: lymphovascular invasion.
Using multivariate analysis, Margulis et al. showed that age (as a continuous variable) was an independent predictor of CSS in UTUC patients undergoing RNU with bladder cuff excision (HR: 1.02) [14]. Hall et al. found that, among UTUC patients undergoing surgery (both RNU and nephron-sparing surgery), age > 68 years was significantly associated with a decreased CSS on multivariate analysis [26]. Shariat et al. showed that age > 60 or > 80 years at the time of RNU was associated with a reduced ACS and CSS, respectively, after controlling for other variables [16]. There are several possible explanations for such associations between age and survival. First, being older is associated with higher-grade UTUC tumors [4], which behave in a more aggressive fashion. Second, older patients are less likely to undergo radical surgery, lymphadenectomy, or aggressive chemotherapy (or a combination thereof) because of personal reluctance, multiple comorbidities, or a high risk of post-treatment complications [27], which may render treatment less effective than in younger patients. Thus, although increasing age is associated with reduced survival, older UTUC patients should still undergo potentially effective treatments whenever possible to facilitate survival.
This study showed that male patients had higher HRs for ACS and CSS than did female patients after controlling for age and clinical stage. Among UTUC patients undergoing surgery in a Greek hospital, Papatsoris et al. showed that females had a better ACS than males (HR: 0.111, 95% CI: 0.015-0.814) [28]. The association of male sex with pathologically larger and higher-staged tumors may possibly explain the inter-gender survival differences of UTUC patients. Chen et al. showed that male sex was associated with muscle-invasive and non-organ-confined disease upon pathological examination of UTUC patients undergoing RNU or distal ureterectomy in a Chinese hospital [4]. In Chinese UTUC patients, female sex was found to be associated with small and low-stage tumors and the absence of lymph node metastasis [29]. The UTUC patients of the cited studies shared a common epidemiological characteristic: they had been exposed to a strong carcinogen (aristolochic acid), associated with many cases of UTUC in Taiwan, China, and the Balkans [1]. However, other studies on the postoperative survival of UTUC patients found no differences between males and females.[14, 26, 27, 30] In these studies, male patients predominated (62.8-68.7%), unlike the female predominance of the present study. Exposure to aristolochic acid may contribute to the survival discrepancies evident between males and females in the cited studies.
There are several limitations to this study. First, we did not incorporate endourological findings as possible predictors of survival because our study aim was to provide a risk stratification method using parameters commonly available for nearly all UTUC patients and only a proportion of UTUC patients undergo invasive endourological examinations. Second, we used dialysis and renal transplantation status rather than renal function data as variables when assessing UTUC patient survival. This was a retrospective study, and renal function test data were not available for many UTUC patients. Also, the timing of renal function tests is quite variable, rendering it impossible or unreliable to grade patients in terms of chronic kidney disease. On the other hand, regular dialysis and renal transplantation status recorded on medical charts or surgical records, respectively, remain unchanged over time and are thus reliable.
In conclusion, summed risk scores using clinical staging, sex and age stratified UTUC patients into risk groups exhibiting significant differences in terms of ACS and CSS. Our risk stratification method will help to estimate UTUC patient survival and to guide appropriate treatment selection, and will serve as a common framework for communication between patients and physicians as well as among medical personnel.
Abbreviations
UC: urothelial carcinoma; UTUC: upper urinary tract urothelial carcinomas; RNU: radical nephroureterectomy; ICD-O-3: the third edition of morphological codes of the International Classification of Diseases for Oncology; ICD-9: the International Classification of Disease, 9th revision; ACS: all-cause survival; CSS: cancer-specific survival; SD: standard deviation; CPHA: Cox proportional hazard analysis; HR: hazard ratio: CI: confidence interval.
Acknowledgements
The authors thank cancer registry center of Linkou Chang Gung Memorial Hospital for assistance in retrieving database.
Supplementary Material
Supplementary figure.
Competing Interests
The authors have declared that no competing interest exists.
References
1. Roupret M, Babjuk M, Comperat E. et al. European Association of Urology Guidelines on Upper Urinary Tract Urothelial Cell Carcinoma: 2015 Update. Euro Urol. 2015;68:868-79
2. Bureau of Health Promotion, Department of Health, Cancer Registry Center. 2014 Cancer Registry Annual Report. Taiwan, Republic of China: Executive Yuan Publisher. 2017
3. Favaretto RL, Shariat SF, Savage C. et al. Combining imaging and ureteroscopy variables in a preoperative multivariable model for prediction of muscle-invasive and non-organ confined disease in patients with upper tract urothelial carcinoma. BJU Int. 2012;109:77-82
4. Chen XP, Xiong GY, Li XS. et al. Predictive factors for worse pathological outcomes of upper tract urothelial carcinoma: experience from a nationwide high-volume centre in China. BJU Int. 2013;112:917-24
5. Chen CY, Liao YM, Tsai WM. et al. Upper urinary tract urothelial carcinoma in eastern Taiwan: high proportion among all urothelial carcinomas and correlation with chronic kidney disease. J Formos Med Assoc. 2007;106:992-8
6. Chen WJ, Kuo JY, Chen KK. et al. Primary urothelial carcinoma of the ureter: 11-year experience in Taipei Veterans General Hospital. J Chin Med Assoc. 2005;68:522-30
7. Ljungberg B. Kidney cancer: A new nomogram predicting survival in renal cell carcinoma. Nat Rev Urol. 2010;7:423-4
8. Tan LB, Chang LL, Cheng KI. et al. Transitional cell carcinomas of the renal pelvis and the ureter: comparative demographic characteristics, pathological grade and stage and 5-year survival in a Taiwanese population. BJU Int. 2009;103:312-6
9. Roupret M, Hupertan V, Seisen T. et al. Prediction of cancer specific survival after radical nephroureterectomy for upper tract urothelial carcinoma: development of an optimized postoperative nomogram using decision curve analysis. J Urol. 2013;189:1662-9
10. Seisen T, Colin P, Hupertan V. et al. Postoperative nomogram to predict cancer-specific survival after radical nephroureterectomy in patients with localised and/or locally advanced upper tract urothelial carcinoma without metastasis. BJU Int. 2014;114:733-40
11. Youssef RF, Krabbe LM, Shariat SF. et al. TALL score for prediction of oncological outcomes after radical nephroureterectomy for high-grade upper tract urothelial carcinoma. World J Urol. 2015;33:1965-72
12. Cha EK, Shariat SF, Kormaksson M. et al. Predicting clinical outcomes after radical nephroureterectomy for upper tract urothelial carcinoma. Euro Urol. 2012;61:818-25
13. Jeldres C, Sun M, Lughezzani G. et al. Highly predictive survival nomogram after upper urinary tract urothelial carcinoma. Cancer. 2010;116:3774-84
14. Margulis V, Shariat SF, Matin SF. et al. Outcomes of radical nephroureterectomy: a series from the Upper Tract Urothelial Carcinoma Collaboration. Cancer. 2009;115:1224-33
15. Yates DR, Hupertan V, Colin P. et al. Cancer-specific survival after radical nephroureterectomy for upper urinary tract urothelial carcinoma: proposal and multi-institutional validation of a post-operative nomogram. Br J Cancer. 2012;106:1083-8
16. Shariat SF, Godoy G, Lotan Y. et al. Advanced patient age is associated with inferior cancer-specific survival after radical nephroureterectomy. BJU Int. 2010;105:1672-7
17. World Health Organization. ICD-O-3: International classification for oncology. 3rd ed. Geneva, Switzerland: World Health Organization publisher. 2000
18. World Health Organization. ICD-9: International classification of disease, 9th revision. Geneva, Switzerland: World Health Organization publisher. 1996
19. Pencina MJ, D'Agostino RB. Overall C as a measure of discrimination in survival analysis: model specific population value and confidence interval estimation. Stat Med. 2004;23:2109-23
20. Tripepi G, Jager KJ, Dekker FW. et al. Statistical methods for the assessment of prognostic biomarkers (Part I): discrimination. Nephrol Dial Transpl. 2010;25:1399-401
21. Tripepi G, Jager KJ, Dekker FW. et al. Statistical methods for the assessment of prognostic biomarkers(part II): calibration and re-classification. Nephrol Dial Transpl. 2010;25:1402-5
22. Rodrigues G, Warde P, Pickles T. et al. Pre-treatment risk stratification of prostate cancer patients: A critical review. Can Urol Assoc J. 2012;6:121-7
23. Scolieri MJ, Paik ML, Brown SL. et al. Limitations of computed tomography in the preoperative staging of upper tract urothelial carcinoma. Urology. 2000;56:930-4
24. Fritz GA, Schoellnast H, Deutschmann HA. et al. Multiphasic multidetector-row CT (MDCT) in detection and staging of transitional cell carcinomas of the upper urinary tract. Euro Radiol. 2006;16:1244-52
25. Millan-Rodriguez F, Palou J, de la Torre-Holguera P. et al. Conventional CT signs in staging transitional cell tumors of the upper urinary tract. Euro Urol. 1999;35:318-22
26. Hall MC, Womack S, Sagalowsky AI. et al. Prognostic factors, recurrence, and survival in transitional cell carcinoma of the upper urinary tract: a 30-year experience in 252 patients. Urology. 1998;52:594-601
27. Chromecki TF, Ehdaie B, Novara G. et al. Chronological age is not an independent predictor of clinical outcomes after radical nephroureterectomy. World J Urol. 2011;29:473-80
28. Papatsoris AG, Chrisofos M, Skolarikos A. et al. Upper urinary tract transitional cell carcinoma. A 10-year experience. Tumori. 2008;94:75-8
29. Lughezzani G, Sun M, Perrotte P. et al. Gender-related differences in patients with stage I to III upper tract urothelial carcinoma: results from the Surveillance, Epidemiology, and End Results database. Urology. 2010;75:321-7
30. Favaretto RL, Shariat SF, Chade DC. et al. The effect of tumor location on prognosis in patients treated with radical nephroureterectomy at Memorial Sloan-Kettering Cancer Center. Euro Urol. 2010;58:574-80
Author contact
![]() Corresponding author: Li-Jen Wang, MD, MPH, Department of Medical Imaging and Intervention, Chang Gung Memorial Hospital, 5 Fu-Hsing Street, Gueishan, 33333, Taoyuan, Taiwan; Fax: (886) 3-3970074; Tel.: (886) 3-3281200 ext. 3793; e-mail: ljw33dbcgmh.org.tw; lijenwang0918com
Corresponding author: Li-Jen Wang, MD, MPH, Department of Medical Imaging and Intervention, Chang Gung Memorial Hospital, 5 Fu-Hsing Street, Gueishan, 33333, Taoyuan, Taiwan; Fax: (886) 3-3970074; Tel.: (886) 3-3281200 ext. 3793; e-mail: ljw33dbcgmh.org.tw; lijenwang0918com

 Global reach, higher impact