Impact Factor ISSN: 1837-9664

 Global reach, higher impact
J Cancer 2018; 9(13):2295-2301. doi:10.7150/jca.24838 This issue Cite
Research Paper
The Novel Prognostic Score Combining Red Blood Cell Distribution Width and Body Mass Index (COR-BMI) Has Prognostic Impact for Survival Outcomes in Nasopharyngeal Carcinoma
Yan Wang*1, Sha-Sha He*2, Xiu-yu Cai3, Hai-Yang Chen4, Xing-Li Yang2, Li-Xia Lu2 ![]() , Yong Chen1
, Yong Chen1 ![]()
1. Department of Radiation Oncology, The First Affiliated Hospital of Sun Yat-Sen University, Guangzhou, Guangdong 510060, PR China.
2. Sun Yat-sen University Cancer Center, State Key Laboratory of Oncology in South China, Collaborative Innovation Center for Cancer Medicine, Guangzhou, Guangdong 510060, PR China; Department of Radiation Oncology, Sun Yat-sen University Cancer Center, Guangzhou, Guangdong 510060, PR China.
3. Department of VIP region, Sun Yat-Sen University Cancer Center, Guangzhou, Guangdong 510060, PR China.
4. Department of Radiation Oncology, The Sixth Affiliated Hospital of Sun Yat-sen University, Guangzhou, China
*These authors contributed equally to this work.
Received 2018-1-9; Accepted 2018-4-4; Published 2018-6-6
Abstract
Background: A novel inflammation-and nutrition-based scoring system based on red blood cell distribution width and body mass index (COR-BMI) has prognostic value in nasopharyngeal carcinoma (NPC). Here, we assessed the prognostic value of COR-BMI in NPC.
Methods: Retrospective study of 2,318 patients with non-metastatic NPC treated at Sun Yat-sen University Cancer Center was conducted. Patients were stratified into three groups using the COR-BMI score, which is based on two objective and easily measurable parameters: red blood cell distribution width (RDW) and body mass index (BMI). Kaplan-Meier survival analyses were used to compare groups; multivariate Cox proportional models were used to calculate overall survival (OS) and disease-free survival (DFS).
Results: Four-year overall survival (OS) rates were 88.7%, 84.5%, and 71.4% for patients with COR-BMI scores of 0, 1, and 2 respectively (P = 0.006). Multivariate Cox proportional hazard analysis revealed COR-BMI was an independent predictor of OS (HR for COR-BMI 1: 1.239, 95% CI: 1.012-1.590; HR for COR-BMI 2: 2.367, 95% CI: 1.311-4.274, P = 0.013), but not DFS (P = 0.482). In subgroup analysis of metastatic NPC, OS rates decreased as COR-BMI increased. In patients with a COR-BMI score of 1, radiotherapy plus chemotherapy led to better OS than radiotherapy alone.
Conclusions: COR-BMI may serve as an indicator of poor prognosis in both NPC and metastatic NPC. Radiotherapy plus chemotherapy may benefit patients with a COR-BMI score of 1.
Keywords: Nasopharyngeal carcinoma, red blood cell distribution width, body mass index, prognosis
Introduction
The aggressive head and neck cancer nasopharyngeal carcinoma (NPC) is endemic in a number of regions, including Southeast Asia. NPC is especially common in Southern China, where there are approximately 20-30 cases per 100,000 males and 8-15 cases per 100,000 females annually [1]. An epidemiological study conducted in China indicated NPC may be related to geographical district, diet, lifestyle, Epstein-Barr virus (EBV) infection and genetic factors [2]. NPC has high incidence of loco-regional spread and distant metastasis during the follow-up, though therapeutic methods have recently improved and radiotherapy and chemotherapy are generally effective. And the failure of treatments mostly due to the incidence of systemic metastasis and recurrence [3].
Currently, prognosis and treatment selection in NPC are mainly based on tumor location and stage. The American Joint Committee on Cancer (AJCC) TNM classification is most widely used for estimating prognosis and guiding treatment [4]. The National Comprehensive Cancer Network (NCCN) guidelines recommend magnetic resonance imaging (MRI), computed tomography (CT) as well as FDG PET/CT scan can be considered help to stage the patients [5]; Since MRI has a good capacity to depict the detailed and complex anatomic information, MRI has been widely used in the management of NPC, which revealed in a meta-analysis [6]. Despite the accuracy of such imaging assessments, the TNM staging system is far from perfect as it only considers tumor size and extension (T category) and lymph node involvement (N category), without considering other prognostic factors such as clinicopathologic data, treatment-related factors and tumor-associated markers.
Recently, a number of studies have confirmed the reliability of routine assessment of EBV DNA for population screening, prognostication, and surveillance of recurrence and metastasis in NPC [7, 8]. Furthermore, accumulating evidence indicates nutritional indices and inflammatory markers or inflammation-based prognostic scores may represent reliable, practical prognostic tools in various malignancies, including NPC. For example, the prognostic nutritional index (PNI) [9], serum C-reactive protein (CRP) [10], and even an inflammatory biomarker-based nomogram combining the Glasgow prognostic score (GPS), neutrophil-lymphocyte ratio (NLR), platelet-lymphocyte ratio (PLR) and lymphocyte-monocyte ratio (LMR) have been reported to predict prognosis in NPC [11].
The COR-BMI (Combination of Red Blood Cell Distribution Width and Body Mass Index) has been demonstrated to be a significant independent prognostic factor for cancer-specific survival in laryngeal squamous cell carcinoma [12]. As most studies have separately assessed the prognostic value of various markers of nutrition and inflammation, we conducted a large-scale, retrospective cohort study to assess the prognostic significance of the COR-BMI in NPC.
Materials and Methods
Patients
This was a retrospective observational study of patients without distant metastatic NPC upon diagnosis, who accepted radiotherapy with or without chemotherapy between January 2006 and April 2013 at Sun Yat-sen University Cancer Center (SYSUCC), Guangzhou, China. All 2,318 patients were restaged according to 7th edition of the AJCC/UICC tumor-node-metastasis (TNM) staging system [13]. This study was approved by the Clinical Research Ethics Committee of SYSUCC; all participants provided written informed consent prior to treatment. No informed consent (written or verbal) was obtained for use of retrospective data from the patients within this study, since this was not deemed necessary by the Ethics Committee.
Clinical data
All patients underwent a physical examination, routine hematology, fiber optic nasopharyngoscopy, pathological assessment of biopsy tissue, magnetic resonance imaging (MRI) of the nasopharynx and neck, abdominal ultrasound, chest radiography and an entire body bone scan, with or without positron emission tomography-computed tomography (PET-CT) before treatment to obtain a definite diagnosis and make sure that there was no metastasis at diagnosis. Thereafter, the clinical stage was classified according to the AJCC/UICC tumour-nodes-metastasis (TNM) staging system (the 7th edition).
Medical records were reviewed retrospectively. Data on age, gender, smoking status, familial history of cancer, overall stage, T category, N category, EBV DNA copy number, hemoglobin (HGB), RDW and BMI before initiation of therapeutic intervention, as well as radiotherapy technique and treatment, were collected. Patients were stratified into three groups using RDW and BMI as follows: COR-BMI 0 (RDW ≤ 13.55 and BMI ≥ 25 kg/m2); COR-BMI 1 (RDW ≤ 13.55 and BMI < 18.5 or 18.5 ≤ BMI < 25; RDW > 13.55 and 18.5 ≤ BMI < 25 or BMI ≥ 25); or COR-BMI 2 (RDW > 13.55 and BMI < 18.5). Real-time quantitative polymerase chain reaction was used to quantify plasma EBV DNA [14]; a cut-off level of 2,560 copies/mL was chosen to define low and high plasma EBV DNA.
Radiotherapy and chemotherapy
In total, 527/2,318 (22.7%) patients were treated with conventional two-dimensional (2D) or three-dimensional (3D) conformal radiotherapy (RT), and 1,791 (77.3%) were treated with intensity-modulated radiotherapy (IMRT). The prescribed dose was 66-72 Gy to the planning target volume (PTV) of the gross tumor volume (GTVp), 64-70 Gy to the PTV of the nodal gross tumor volume (GTVn), 60 Gy to the PTV of clinical target volume 1 (CTVp1; high risk regions) and 54 Gy to the PTV of CTVp2 (low-risk regions) and CTVn (neck nodal regions) in 30-33 fractions. All patients were treated with one fraction daily, 5 days a week, and completed radiotherapy within 6-7 weeks.
The choice of chemotherapy was mainly based on TNM stage and the health of the individual patient. Neoadjuvant or adjuvant chemotherapy consisted of cisplatin plus 5-fluorouracil, cisplatin plus taxane, or cisplatin plus 5-fluorouracil and taxane, every 3 weeks for two to four cycles. Cisplatin-based concurrent chemotherapy was administered weekly or every 3 weeks.
Follow-up and outcome
Follow-up evaluations were performed every 3 months within the first 3 years, every 6 months for the following 2 years, and annually thereafter until death. A physical examination, laboratory tests, nasopharyngoscopy, nasopharynx and neck MRI, chest X-ray, abdominal ultrasonography, bone scan, and plasma EBV DNA copy number were conducted at each assessment. Last follow-up was January 2016; median follow-up time was 48.2 (range, 1.06-122) months.
Overall survival (OS) was calculated from the date of diagnosis until death or last available follow-up. Disease-free survival (DFS) was measured from date of diagnosis to locoregional recurrence and/or metastasis, or last follow-up.
Statistical analysis
Variables were allocated in groups according to the optimal cut-off value. The ideal cut-off values for RDW and EBV DNA copy number were determined by receiver operating characteristic (ROC) curve analysis. For BMI, it was categorized into three groups: BMI < 18.5, 18.5 ≤ BMI < 25, and BMI ≥ 25 [15]. The associations between the COR-BMI score and various clinicopathological variables were analyzed using the chi-square test. Cumulative survival was estimated using the Kaplan-Meier method, and the significance of the differences was assessed using the log-rank test. A multivariate Cox proportional hazard model was applied to examine the independent significance of the variables that proved significant (P < 0.05) in univariate analysis. Statistical analyses were performed using SPSS 22.0 software (IBM Corporation). Differences with P-values less than 0.05 were considered statistically significant.
Results
Patient characteristics
A total of 2,318 patients with histopathologically-confirmed undifferentiated, non-keratinizing squamous cell NPC were assessed in this study. The characteristics of the patients are summarized in Table 1. Median age was 45 (range, 20-79) years; 561/2,318 (24.2%) patients received radiotherapy only and 1,757 (75.8%) received radiotherapy plus chemotherapy. Most patients (77.3%) were treated with IMRT. Overall, 2,037 (87.9%) patients had locally advanced NPC. In total, 394 (17%) patients died and 647 (27.9%) patients developed distant metastasis during follow-up.
Selected baseline characteristics of the 2,318 patients with nasopharyngeal carcinoma and the groups stratified by COR-BMI score
| Characteristic | Total (n, %) | COR-BMI 0 (n, %) | COR-BMI 1 (n, %) | COR-BMI 2 (n, %) | P-value* |
|---|---|---|---|---|---|
| 2318 (100) | 537 (23.2) | 1738 (75) | 43 (1.9) | ||
| Gender | 0.185 | ||||
| Male | 2200 (94.9) | 516 (96.1) | 1645 (94.6) | 39 (90.7) | |
| Female | 118 (5.1) | 21 (3.9) | 93 (5.4) | 4 (9.3) | |
| Age (years) | 0.197 | ||||
| < 45 | 1201 (51.8) | 273 (50.8) | 900 (51.8) | 28 (65.1) | |
| ≥ 45 | 1117 (48.2) | 264 (49.2) | 838 (48.2) | 15 (34.9) | |
| Smoking | 0.021 | ||||
| Yes | 1614 (69.6) | 362 (67.4) | 1216 (70) | 36 (83.7) | |
| No | 704 (30.4) | 175 (32.6) | 522 (30) | 7 (16.3) | |
| Family history of NPC | 0.672 | ||||
| Yes | 79 (3.4) | 21 (3.9) | 56 (3.2) | 2 (4.7) | |
| No | 2239 (96.6) | 516 (96.1) | 1682 (96.8) | 41 (95.3) | |
| Stage (7th) | 0.328 | ||||
| I - II | 281 (12.1) | 75 (14) | 201 (11.6) | 5 (11.6) | |
| III - IVAB | 2037 (87.9) | 462 (86) | 1537 (88.4) | 38 (88.4) | |
| T category | 0.978 | ||||
| T1 - T2 | 580 (25) | 136 (25.3) | 433 (24.9) | 11 (25.6) | |
| T3 - T4 | 1738 (75) | 401 (74.7) | 1305 (75.1) | 32 (74.4) | |
| N category | 0.345 | ||||
| N0 - N1 | 1050 (45.3) | 254 (47.3) | 780 (44.9) | 16 (37.2) | |
| N2 - N3 | 1268 (54.7) | 283 (52.7) | 958 (55.1) | 27 (62.8) | |
| Radiotherapy technique | 0.223 | ||||
| 2DRT/3DCRT | 527 (22.7) | 136 (25.3) | 380 (21.9) | 11 (25.6) | |
| IMRT | 1791 (77.3) | 401 (74.7) | 1358 (78.1) | 32 (74.4) | |
| Treatment | 0.235 | ||||
| RT | 561 (24.2) | 117 (21.8) | 431 (24.8) | 13 (30.2) | |
| CT + RT | 1757 (75.8) | 420 (78.2) | 1307 (75.2) | 30 (69.8) | |
| EBV-DNA (copies mL-1) | 0.364 | ||||
| < 2,560 | 1156 (49.9) | 281 (52.3) | 852 (49) | 23 (53.5) | |
| ≥ 2,560 | 1162 (50.1) | 256 (47.7) | 886 (51) | 20 (46.5) | |
| Outcomes | |||||
| Death | 0.019 | ||||
| Yes | 394 (17) | 78 (14.5) | 303 (17.4) | 13 (30.2) | |
| No | 1924 (83) | 459 (85.5) | 1435 (82.6) | 30 (69.8) | |
| Distant metastasis | 0.214 | ||||
| Yes | 647 (27.9) | 139 (25.9) | 492 (28.3) | 16 (37.2) | |
| No | 1671 (72.1) | 398 (74.1) | 1246 (71.7) | 27 (62.8) |
Abbreviations: COR-BMI = Combination of red blood cell distribution width and body mass index; COR-BMI 0 (RDW ≤ 13.55 and BMI ≥ 25 kg/m2); COR-BMI 1 (RDW ≤ 13.55 and BMI < 18.5 or 18.5 ≤ BMI < 25; RDW > 13.55 and 18.5 ≤ BMI < 25 or BMI ≥ 25); COR-BMI 2 (RDW > 13.55 and BMI < 18.5).; 2DRT: two-dimensional radiotherapy; 3DCRT: three-dimensional conformal radiotherapy; IMRT: intensity-modulated radiation therapy; RT: radiotherapy; CT: chemotherapy.
* Chi-square test.
The patients were divided into three groups based on COR-BMI scores: 537 (23.1%) of patients were in the COR-BMI 0 group, 1,738 (75.0%) in COR-BMI 1 group, and 43 (1.9%) in COR-BMI 2 group. The χ2-test revealed statistically significant associations between COR-BMI and smoking status (P = 0.021) and COR-BMI and death (P = 0.019), but no associations between COR-BMI and gender, age, stage, therapy or EBV DNA copy number (all P > 0.05).
Univariate and multivariate analysis of OS
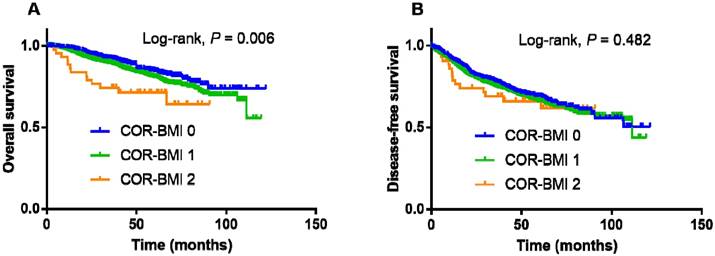
The 4-year OS and DFS rates for the entire cohort were 85.3% and 70.2%, respectively. The 4-year OS and DFS rates for the COR-BMI 0, 1, and 2 groups were 88.7%, 84.5%, and 71.4% (P = 0.006; Figure 1A) and 71.4%, 69.9%, and 66.2% (P = 0.482; Figure 1B), respectively.
Kaplan-Meier overall survival (A) and disease-free survival (B) curves for the 2,318 patients with nasopharyngeal cancer stratified by COR-BMI score.
Univariate and multivariate Cox proportional models were generated (Table 2) Univariate analysis demonstrated age (P = 0.020), overall stage (P < 0.001), T category (P < 0.001), N category (P < 0.001), treatment (P = 0.015), plasma EBV DNA (P < 0.001), BMI (P = 0.031), RDW (P = 0.032) and COR-BMI (P = 0.007) were significantly associated with OS. In multivariate analysis, age (P = 0.005), overall stage (P = 0.032), T category (P < 0.001), N category (P < 0.001), treatment (P < 0.001), EBV DNA (P < 0.001) and COR-BMI (group 1 vs. 0: HR = 1.239; 95% CI = 1.012-1.590; group 2 vs. 0: HR = 2.367; 95% CI = 1.311-4.274; P = 0.013) were identified as independent prognostic factors for OS. However, BMI and RDW did not retain significant prognostic value for OS in multivariate analysis.
Univariate and multivariate analyses of overall survival for the 2,318 patients with nasopharyngeal carcinoma
| Variable | Univariate analysis | Multivariate analysis | ||
|---|---|---|---|---|
| HR (95% CI) | P | HR (95% CI) | P | |
| Age at diagnosis (years) | ||||
| ≥ 45 vs. < 45 | 1.265 (1.038-1.541) | 0.020 | 1.327 (1.087-1.620) | 0.005 |
| Smoking status | ||||
| Yes vs. no | 1.100 (0.893-1.354) | 0.369 | ||
| Overall stage (7th) | ||||
| III - IV vs. I - II | 2.758 (1.794-4.241) | < 0.001 | 1.778 (1.052-3.007) | 0.032 |
| T category | ||||
| T1 | 1 (reference) | < 0.001 | 1 (reference) | < 0.001 |
| T2 | 2.088 (1.134-3.846) | 1.784 (0.965-3.300) | ||
| T3 | 1.910 (1.064-3.428) | 1.393 (0.754-2.574) | ||
| T4 | 3.456 (1.913-6.243) | 2.493 (1.339-4.643) | ||
| N category | ||||
| N0 | 1(reference) | < 0.001 | 1 (reference) | < 0.001 |
| N1 | 1.913 (1.572-2.326) | 1.316 (1.078-1.606) | ||
| N2 | 1.927 (1.514-2.452) | 1.613 (1.244-2.092) | ||
| N3 | 2.209 (1.727-2.827) | 1.866 (1.430-2.436) | ||
| Treatment | ||||
| RT vs. CT + RT | 1.310 (1.053-1.628) | 0.015 | 1.773 (1.429-2.201) | < 0.001 |
| EBV DNA (copies mL-1) | ||||
| ≥ 2,560 vs. < 2,560 | 1.850 (1.508-2.268) | < 0.001 | 1.434 (1.174-1.753) | < 0.001 |
| Hemoglobin (g/L) | ||||
| < 120 vs. ≥ 120 | 1.123 (0.838-1.504) | 0.437 | ||
| Albumin (g/L) | ||||
| < 45 vs. ≥ 45 | 1.187 (0.973-1.448) | 0.090 | ||
| BMI (Kg/m2) | ||||
| < 18.5 | 1 (reference) | 0.031 | 1 (reference) | 0.470 |
| 18.5-25 | 1.570 (1.029-2.397) | 1.051 (0.621-1.779) | ||
| ≥ 25 | 1.323 (1.046-1.674) | 0.743 (0.344-1.603) | ||
| RDW | ||||
| > 13.55 vs. ≤ 13.55 | 1.288 (1.022-1.623) | 0.032 | 1.121 (0.850-1.478) | 0.418 |
| COR-BMI | ||||
| 0 | 1 (reference) | 0.007 | 1 (reference) | 0.013 |
| 1 | 1.311 (1.022-1.682) | 1.239 (1.012-1.590) | ||
| 2 | 2.403 (1.335-4.323) | 2.367 (1.311-4.274) | ||
Abbreviations: COR-BMI = Combination of red blood cell distribution width and body mass index; CI = confidence interval; HR = hazard ratio; N = node; T = tumor; multivariate analyses adjusted for age, overall stage, T category, N category, treatment, EBV DNA copy number, hemoglobin, albumin, NLR and COR-BMI.
Subgroup analysis of patients with metastatic NPC
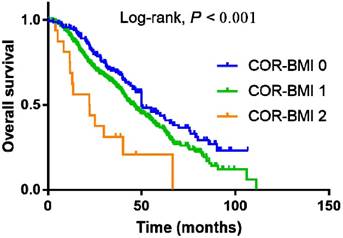
COR-BMI had prognostic significance for OS in the subgroup of 647 patients with metastatic NPC who developed distant metastasis during the follow-up. The 4-year OS rates for the COR-BMI 0, 1, and 2 subgroups with metastatic NPC were 51.9%, 47.0%, and 20.8%, respectively (P < 0.001; Figure 2A). COR-BMI was identified as an independent prognostic factor for OS (group 1 vs. 0: HR = 1.261; 95% CI = 1.236-1.618; group 2 vs. 0: HR = 2.263; 95% CI = 1.256-4.076; P = 0.016) in multivariate analysis in the subgroup of 647 patients with metastatic NPC; N category, treatment and serum albumin were also independent prognostic factors for OS in this cohort.
Kaplan-Meier overall survival curves for the subgroup of 647 patients with metastatic NPC who developed distant metastasis during the follow-up stratified by COR-BMI score.
Subgroup analysis of the associations between COR-BMI and treatment
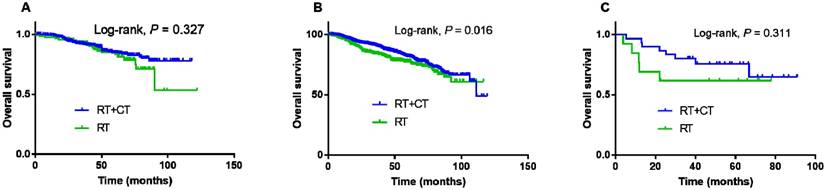
Kaplan-Meier curves were plotted for the entire cohort to explore whether different treatments affected the outcomes of the patients in each of the three COR-BMI groups. Radiotherapy plus chemotherapy led to higher 4-year OS compared to radiotherapy alone in the COR-BMI 1 group (log-rank test, P < 0.001, Figure 3B). However, no significant differences in 4-year OS were observed between patients treated with radiotherapy plus chemotherapy versus radiotherapy alone in the COR-BMI 0 group (log-rank, P = 0.327; Figure 3A) or COR-BMI 2 group (log-rank, P = 0.311; Figure 3C).
Kaplan-Meier overall survival curves for patients with COR-BMI scores of 0 (A), 1 (B) and 2 (C) stratified by treatment: radiotherapy and chemotherapy (RT + CT) or radiotherapy alone (RT).
Discussion
To our knowledge, the present study is the first to analyze COR-BMI score and OS, DFS rates in patients of NPC. We demonstrated that the score was independently associated with OS in the whole cohort (group 1 vs. 0: HR:1.239; 95% CI: 1.012-1.590; group 2 vs. 0: HR:2.367; 95% CI: 1.311-4.274; P = 0.013 ), also in the metastatic subgroups for OS (group 1 vs. 0: HR = 1.261; 95% CI = 1.236-1.618; group 2 vs. 0: HR = 2.263; 95% CI = 1.256-4.076; P = 0.016 ). Furthermore, when stratified by COR-BMI score, we found that conducting radiotherapy plus chemotherapy benefited the OS of patients in group 1 than only radiotherapy.
Red cell distribution width (RDW) is used to quantify anisocytosis in peripheral blood and indicate the efficiency of erythropoiesis. And it is related to chronic inflammation and markers of acute phase inflammation, including interleukin-6, soluble tumor necrosis factor (TNF) receptor I and soluble TNF receptor II, C-reactive protein and prealbumin, as well as signs of nutritional deficiency, such as the levels of iron, vitamin B12, folic acid, total cholesterol and albumin [16, 17]. Inflammation may increase RDW by impairing iron metabolism and inhibiting the response to erythropoietin [18]. Therefore, this marker is associated with adverse outcomes. RDW was significantly elevated in a cohort of patients with various types of malignancies. Recent studies revealed that RDW level increased with the progression of cancer stage in renal cell carcinoma [19] and lung cancer [20]. However, Seretis et al. [21] reported that RDW was inversely associated with the tumor grade in breast cancer. Another study suggested elevated preoperative RDW (≥ 15%) was independently associated with poorer DFS (P = 0.043, HR = 1.907, 95% CI = 1.020-3.565) and OS (P = 0.042, HR = 1.895, 95% CI = 1.023-3.508) among patients with esophageal carcinoma [22]. Furthermore, a nomogram identified RDW as potential prognostic biomarker in esophageal squamous cell carcinoma (P = 0.036), with a Harrell's c-index of 0.68 for prediction of cause-specific survival [23].
Malnutrition has been reported significantly and apparently associated with OS among cancer patients [24]. Body mass index (BMI) was a nutrition-related factor and has been found to have prognostic significance in cancer patients. Thus, studies have found that low BMI before treatment or weight loss during therapy led to a poorer survival. A review [25] recently have revealed that patients with higher BMI had increased overall survival and decreased disease-related mortality and recurrence rate compared with underweight and normal weight in head and neck cancer patients. However, no definite associations have yet been reported between pretreatment BMI or weight loss and clinical outcome in NPC, especially in the modern era of IMRT-based therapy. In fact, Lin et al. [26] reported no significant relationship between BMI or percentage weight loss in NPC. Similarly, individual nutritional factors, such as hemoglobin, albumin, RDW and BMI were not prognostic factors in this cohort of patients with NPC.
The COR-BMI, which is based on RDW and BMI, intergrating with inflammation and nutrition. It may have more predictable information compared to only one aspect. It was identified as a significant independent predictor of cancer-specific survival in laryngeal squamous cell carcinoma [12]. To the best of our knowledge, this is the first study to analyze the relationship between the COR-BMI and OS and DFS in NPC. This study indicates that integration of RDW and BMI has prognostic value for OS in NPC; COR-BMI was independently associated with OS in the entire cohort of patients (group 1 vs. 0: HR = 1.239; 95% CI: 1.012-1.590; group 2 vs. 0: HR = 2.367; 95% CI: 1.311-4.274; P = 0.013) and also in the subgroup of patients with metastatic NPC during the follow-up (COR-BMI group 1 vs. 0: HR = 1.261; 95% CI = 1.236-1.618; group 2 vs. 0: HR = 2.263; 95% CI = 1.256-4.076; P = 0.016).
Additionally, radiotherapy plus chemotherapy improved OS for patients with NPC in the COR-BMI 1 group compared to radiotherapy alone. This suggests more intensive treatment is required for patients with a COR-BMI score of 1. Although radiotherapy plus chemotherapy did not provide a significant benefit over radiotherapy alone in the COR-BMI 2 group, the curves for each treatment group were clearly separated; we suggest the value of radiotherapy plus chemotherapy should be further assessed in a larger cohort of patients with a COR-BMI score of 2.
One potential limitation of the current study is that it was a retrospective, single-center analysis. However, few studies have previously assessed the prognostic value of COR-BMI. Second, the radiotherapeutic techniques used in this study varied greatly, although most patients received IMRT. Compared to conventional 2D and conformational 3D radiation techniques, patients treated with IMRT are more likely to complete their prescribed treatment plan within the planned time and have fewer acute side effects, including weight loss [27]. Moreover, we did not take into consideration the impact of different chemotherapy regimens on nutritional measures and the resulting effects on prognosis. Thus, further stratified analysis is required. Another limitation was that COR-BMI was not confirmed as an independent predictor of disease-free survival (DFS), which we employed as a surrogate end-point. Therefore, the findings of this study need to be confirmed by assessing additional outcome measures. Further prospective studies are required to establish the value of COR-BMI as pretreatment biomarker of prognosis and treatment outcomes in NPC.
Conclusions
The novel combined COR-BMI scoring system provides more comprehensive prognostic information than individual nutritional indexes and has prognostic value for OS in NPC.
Acknowledgements
This work was supported by a grant from the Natural Science Foundation of Guangdong Province, China [No. 2016A020215083]; Medical Science and Technology Research Foundation of Guangdong Province, China [grant number A02016031]. The funding agency had no role in the study design, data collection and analysis, decision to publish, or preparation of the manuscript.
Competing Interests
The authors have declared that no competing interest exists.
References
1. Jemal A, Bray F, Center MM, Ferlay J, Ward E, Forman D. Global cancer statistics. CA: a cancer journal for clinicians. 2011;61:69-90
2. Cao SM, Simons MJ, Qian CN. The prevalence and prevention of nasopharyngeal carcinoma in China. Chinese journal of cancer. 2011;30:114-9
3. Sun X, Su S, Chen C, Han F, Zhao C, Xiao W. et al. Long-term outcomes of intensity-modulated radiotherapy for 868 patients with nasopharyngeal carcinoma: an analysis of survival and treatment toxicities. Radiotherapy and oncology: journal of the European Society for Therapeutic Radiology and Oncology. 2014;110:398-403
4. Edge SB, Compton CC. The American Joint Committee on Cancer: the 7th edition of the AJCC cancer staging manual and the future of TNM. Annals of surgical oncology. 2010;17:1471-4
5. Pfister DG, Spencer S, Brizel DM, Burtness B, Busse PM, Caudell JJ. et al. Head and Neck Cancers, Version 1.2015. Journal of the National Comprehensive Cancer Network: JNCCN. 2015;13:847-55 quiz 56
6. Chen WS, Li JJ, Hong L, Xing ZB, Wang F, Li CQ. Comparison of MRI, CT and 18F-FDG PET/CT in the diagnosis of local and metastatic of nasopharyngeal carcinomas: an updated meta analysis of clinical studies. American journal of translational research. 2016;8:4532-47
7. Wang WY, Twu CW, Chen HH, Jan JS, Jiang RS, Chao JY. et al. Plasma EBV DNA clearance rate as a novel prognostic marker for metastatic/recurrent nasopharyngeal carcinoma. Clinical cancer research: an official journal of the American Association for Cancer Research. 2010;16:1016-24
8. Hou X, Zhao C, Guo Y, Han F, Lu LX, Wu SX. et al. Different clinical significance of pre- and post-treatment plasma Epstein-Barr virus DNA load in nasopharyngeal carcinoma treated with radiotherapy. Clinical oncology (Royal College of Radiologists (Great Britain)). 2011;23:128-33
9. Yang L, Xia L, Wang Y, Hong S, Chen H, Liang S. et al. Low Prognostic Nutritional Index (PNI) Predicts Unfavorable Distant Metastasis-Free Survival in Nasopharyngeal Carcinoma: A Propensity Score-Matched Analysis. PloS one. 2016;11:e0158853
10. Tang LQ, Li CF, Chen QY, Zhang L, Lai XP, He Y. et al. High-sensitivity C-reactive protein complements plasma Epstein-Barr virus deoxyribonucleic acid prognostication in nasopharyngeal carcinoma: a large-scale retrospective and prospective cohort study. International journal of radiation oncology, biology, physics. 2015;91:325-36
11. Li XH, Chang H, Xu BQ, Tao YL, Gao J, Chen C. et al. An inflammatory biomarker-based nomogram to predict prognosis of patients with nasopharyngeal carcinoma: an analysis of a prospective study. Cancer medicine. 2016
12. Fu Y, Mao Y, Chen S, Yang A, Zhang Q. A Novel Inflammation- and Nutrition-Based Prognostic System for Patients with Laryngeal Squamous Cell Carcinoma: Combination of Red Blood Cell Distribution Width and Body Mass Index (COR-BMI). PloS one. 2016;11:e0163282
13. Li J, Zou X, Wu YL, Guo JC, Yun JP, Xu M. et al. A comparison between the sixth and seventh editions of the UICC/AJCC staging system for nasopharyngeal carcinoma in a Chinese cohort. PloS one. 2014;9:e116261
14. Shao JY, Zhang Y, Li YH, Gao HY, Feng HX, Wu QL. et al. Comparison of Epstein-Barr virus DNA level in plasma, peripheral blood cell and tumor tissue in nasopharyngeal carcinoma. Anticancer research. 2004;24:4059-66
15. Kang DH, Guo LF, Guo T, Wang Y, Liu T, Feng XY. et al. Association of body composition with bone mineral density in northern Chinese men by different criteria for obesity. Journal of endocrinological investigation. 2015;38:323-31
16. Lippi G, Targher G, Montagnana M, Salvagno GL, Zoppini G, Guidi GC. Relation between red blood cell distribution width and inflammatory biomarkers in a large cohort of unselected outpatients. Archives of pathology & laboratory medicine. 2009;133:628-32
17. Forhecz Z, Gombos T, Borgulya G, Pozsonyi Z, Prohaszka Z, Janoskuti L. Red cell distribution width in heart failure: prediction of clinical events and relationship with markers of ineffective erythropoiesis, inflammation, renal function, and nutritional state. American heart journal. 2009;158:659-66
18. Thompson WG, Meola T, Lipkin M Jr, Freedman ML. Red cell distribution width, mean corpuscular volume, and transferrin saturation in the diagnosis of iron deficiency. Archives of internal medicine. 1988;148:2128-30
19. Wang FM, Xu G, Zhang Y, Ma LL. Red cell distribution width is associated with presence, stage, and grade in patients with renal cell carcinoma. Disease markers. 2014;2014:860419
20. Koma Y, Onishi A, Matsuoka H, Oda N, Yokota N, Matsumoto Y. et al. Increased red blood cell distribution width associates with cancer stage and prognosis in patients with lung cancer. PloS one. 2013;8:e80240
21. Seretis C, Seretis F, Lagoudianakis E, Gemenetzis G, Salemis NS. Is red cell distribution width a novel biomarker of breast cancer activity? Data from a pilot study. Journal of clinical medicine research. 2013;5:121-6
22. Wan GX, Chen P, Cai XJ, Li LJ, Yu XJ, Pan DF. et al. Elevated red cell distribution width contributes to a poor prognosis in patients with esophageal carcinoma. Clinica chimica acta; international journal of clinical chemistry. 2016;452:199-203
23. Chen GP, Huang Y, Yang X, Feng JF. A Nomogram to Predict Prognostic Value of Red Cell Distribution Width in Patients with Esophageal Cancer. Mediators of inflammation. 2015;2015:854670
24. Dewys WD, Begg C, Lavin PT, Band PR, Bennett JM, Bertino JR. et al. Prognostic effect of weight loss prior to chemotherapy in cancer patients. Eastern Cooperative Oncology Group. The American journal of medicine. 1980;69:491-7
25. Hollander D, Kampman E, van Herpen CM. Pretreatment body mass index and head and neck cancer outcome: A review of the literature. Critical reviews in oncology/hematology. 2015;96:328-38
26. Lin YH, Chang KP, Lin YS, Chang TS. Evaluation of effect of body mass index and weight loss on survival of patients with nasopharyngeal carcinoma treated with intensity-modulated radiation therapy. Radiation oncology (London, England). 2015;10:136
27. Kouloulias V, Thalassinou S, Platoni K, Zygogianni A, Kouvaris J, Antypas C. et al. The treatment outcome and radiation-induced toxicity for patients with head and neck carcinoma in the IMRT era: a systematic review with dosimetric and clinical parameters. BioMed research international. 2013;2013:401261
Author contact
![]() Corresponding authors: Yong Chen, M.D. Department of Radiation Oncology, The First Affiliated Hospital of Sun Yat-Sen University, Guangzhou, Guangdong 510080, PR China, E-mail: chenyongsysu.edu.cn; Li-xia Lu, M.D., Ph.D. Sun Yat-sen University Cancer Center, State Key Laboratory of Oncology in South China; Collaborative Innovation Center for Cancer Medicine, Department of Radiation Oncology, Guangzhou, Guangzhou 510060, PR China, Email: lulxorg.cn
Corresponding authors: Yong Chen, M.D. Department of Radiation Oncology, The First Affiliated Hospital of Sun Yat-Sen University, Guangzhou, Guangdong 510080, PR China, E-mail: chenyongsysu.edu.cn; Li-xia Lu, M.D., Ph.D. Sun Yat-sen University Cancer Center, State Key Laboratory of Oncology in South China; Collaborative Innovation Center for Cancer Medicine, Department of Radiation Oncology, Guangzhou, Guangzhou 510060, PR China, Email: lulxorg.cn