3.2
Impact Factor
ISSN: 1837-9664
J Cancer 2018; 9(13):2357-2373. doi:10.7150/jca.25221 This issue Cite
Research Paper
Distinct Diagnostic and Prognostic Values of Minichromosome Maintenance Gene Expression in Patients with Hepatocellular Carcinoma
1. Department of Hepatobiliary Surgery, The First Affiliated Hospital of Guangxi Medical University, Nanning, 530021, Guangxi, China.
2. Department of Hepatobiliary Surgery, Affiliated Hospital of Guangdong Medical University, Zhanjiang, 524001, Guangdong Province, People's Republic of China.
3. Department of Hematology, The First Affiliated Hospital of Guangxi Medical University, Nanning, 530021, Guangxi, China.
4. Department of Hepatobiliary and Pancreatic Surgery, The First Affiliated Hospital of Zhengzhou University, Zhengzhou, 450000, Henan, China.
5. Department of Hepatobiliary Surgery, The Sixth Affiliated Hospital of Guangxi Medical University, Yulin, 537000, Guangxi, China.
Received 2018-1-30; Accepted 2018-4-14; Published 2018-6-12
Abstract
Background: The aim of the present study was to identify diagnostic and prognostic values of minichromosome maintenance (MCM) gene expression in patients with hepatocellular carcinoma (HCC).
Methods: The biological function of the MCM genes were investigated by bioinformatics analysis. The diagnostic and prognostic values of the MCM genes were investigated by using the data of HCC patients from the GSE14520 and The Cancer Genome Atlas (TCGA) databases.
Results: Bioinformatics analysis of the MCM genes substantiated that MCM2-7 genes were significantly enriched in DNA replication and cell cycle, and co-expressed with each other. These genes also co-expressed in HCC tumor tissue in both the GSE14520 and TCGA cohort. We also observed that the expression of the MCM2-7 genes was increased in tumor tissue, and diagnostic receiver operating characteristic analysis of MCM2-7 indicated that these genes could serve as sensitive diagnostic markers in HCC. Survival analysis in the GSE14520 cohort suggested that expression of MCM2, MCM4, MCM5, and MCM6 were significantly associated with hepatitis B virus-related HCC overall survival (OS). However, none of the MCM genes were associated with recurrence-free survival in the GSE14520 cohort. The validation cohort of TCGA suggested that the expression of MCM2, MCM6, and MCM7 were significantly correlated with HCC OS.
Conclusion: Our study indicated that MCM2-7 genes may be potential diagnostic biomarkers in patients with HCC. Among them, MCM2 and MCM6 may serve as potential prognostic biomarkers for HCC.
Keywords: minichromosome maintenance, mRNA, hepatocellular carcinoma, prognosis, diagnosis
Introduction
Liver cancer is more common in males than females and has become the second leading cause of cancer-related death worldwide and in developing countries in 2012 [1]. Approximately half of the new cases and deaths involving liver cancer worldwide occurred in China in 2012. Moreover, liver cancer was the third leading cause of cancer-related death in China in 2015 [1, 2]. Therefore, the early detection and management of liver cancer would be valuable. Most liver cancers are diagnosed as hepatocellular carcinoma (HCC) [3]. As with other cancers, hepatocarcinogenesis is also derived from genetic and environmental factors. Furthermore, genes that are dysregulated between tumors and normal tissues are the most promising source of diagnostic and prognostic biomarkers [4-6].
Minichromosome maintenance (MCM) genes play an essential role in DNA replication and include six highly related MCM genes (MCM2, MCM3, MCM4, MCM5, MCM6, and MCM7) [7, 8]. Numerous studies have demonstrated that MCM genes play essential roles in various cancers, especially in cancer diagnosis and prognosis prediction [9-13]. However, a comprehensive analysis of the diagnostic and prognostic values of MCM genes in HCC still needs further in-depth investigation. The aim of the present study was to identify the diagnostic and prognostic values of MCM gene expression in patients with HCC based on information from public databases and bioinformatics analysis.
Materials and Methods
Bioinformatics analysis of MCM genes
In order to investigate the biological functions and pathways involving the MCM genes, gene function enrichment analysis of MCM genes was performed using the Database for Annotation, Visualization and Integrated Discovery (DAVID, https://david.ncifcrf.gov/home.jsp, accessed December 15, 2017) version 6.8[14, 15]. An enrichment P-value <0.05 was considered statistically significant. We also investigated the Gene Ontology (GO) terms of MCM genes by using the Biological Networks Gene Ontology tool (BiNGO) in Cytoscape_version 3.4.0[16]. Investigation of gene-gene and protein- protein interactions of MCM genes were performed by GeneMANIA (http://www.genemania.org/, accessed December 15, 2017) [17, 18] and the Search Tool for the Retrieval of Interacting Genes/Proteins (STRING, https://string-db.org/, accessed December 15, 2017) [19, 20], respectively.
Data source
The GSE14520 dataset of MCM gene expression and corresponding clinical data of hepatitis B virus (HBV)-related HCC were downloaded from the Gene Expression Omnibus database (https://www.ncbi. nlm.nih.gov/geo/query/acc.cgi?acc=GSE14520, accessed December 15, 2017) [21, 22]. To validate the results obtained from GSE14520 and generalize these results to HCC, a gene expression dataset from HCC patients was obtained from The Cancer Genome Atlas (TCGA, https://portal.gdc.cancer.gov/, accessed December 15, 2017) and used as the verification cohort [23]. The corresponding clinical information of TCGA HCC patients was downloaded from the University of California, Santa Cruz Xena browser (UCSC Xena: http://xena.ucsc.edu/, accessed December 15, 2017). The datasets included in the current study were downloaded from public databases, therefore there was no need for the study to be approved by an additional ethics committee.
Association analysis and diagnostic value assessment
The comparison between HCC tumor tissues and adjacent normal liver tissues were evaluated by the Student's t-test. Pearson's correlation coefficient was used to evaluate correlations among genes in co-expression analysis and visualized by the corrplot package in the R platform. The additional analysis of MCM mRNA expression between normal liver tissue and primary liver cancer tissue was performed by Metabolic gEne RApid Visualizer (MERAV, http://merav.wi.mit.edu/, accessed December 15, 2017) [24]. Diagnostic values of the MCM genes in distinguishing HCC tumors from adjacent normal liver tissue were performed using the receiver operating characteristic (ROC) curve calculated using SPSS software.
Survival analysis
All patients were divided into two groups according to the median value of gene expression levels in tumor tissues for survival analysis. Based on the survival analysis results of a single MCM gene, we also investigated the joint effects survival analysis of the MCM genes that were significantly correlated to HCC prognosis.
Prognostic signature construction
We investigated a prognostic model based on the expression of prognostic MCM genes. A prognosis risk score was established on the basis of a linear combination of gene expression levels multiplied by a regression coefficient(β) as the weight that was derived from a multivariate Cox proportional hazards regression model with the prognostic genes fitting the multivariate Cox regression model with OS as a dependent variable. The risk score formula was as follows: Risk score=expression of gene1 × β1gene1 + expression of gene2×β2gene2+…expression of Genen× βnGenen [25-28]. Patients were divided into high and low risk groups according to the risk score median values. In order to evaluate the predictive accuracy of this gene expression-based prognostic signature in HCC outcome, a time-dependent ROC curve was constructed using the survivalROC package in the R platform [29].
Gene set enrichment analysis
To investigate the difference of biological functions and pathways between high and low expression groups of these prognostic MCM genes in HCC survival, gene set enrichment analysis (GSEA, http://software.broadinstitute.org/gsea/index.jsp, accessed December 15, 2017) [30, 31] was used to investigate potential mechanisms in the Molecular Signatures Database (MSigDB) of c2(c2.all.v6.1.symbols) and c5 (c5.all.v6.1.symbols) [32]. The enrichment gene sets in GSEA that reached a nominal P-value <0.05 and false discovery rate (FDR) <0.25 were considered statistically significant.
Statistical analysis
FDRs in the GSEA were adjusted for multiple testing with the Benjamini-Hochberg procedure to control FDR [33-35]. Univariate survival analysis of clinical features and MCM genes were compared using the log-rank test; those clinicopathological parameters significantly associated with OS (P < 0.05) were entered into the multivariate Cox proportional hazards regression model for adjustment, whereas, hazard ratios (HRs) and 95% confidence intervals (CIs) were used to assess the relative risk in different HCC patients that were stratified by the expression of the MCM genes. Co-expression relationships between MCM genes were assessed by the Pearson's correlation coefficient. All statistical analyses were conducted with SPSS software, version 20.0 (IBM Corporation, Armonk, NY, USA) and R 3.3.0. A P-value <0.05 was considered statistically significant.
Results
Bioinformatics analysis of the MCM genes
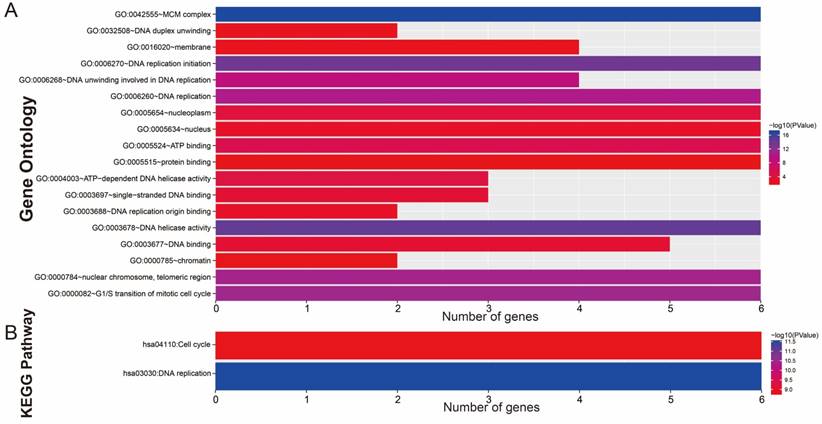
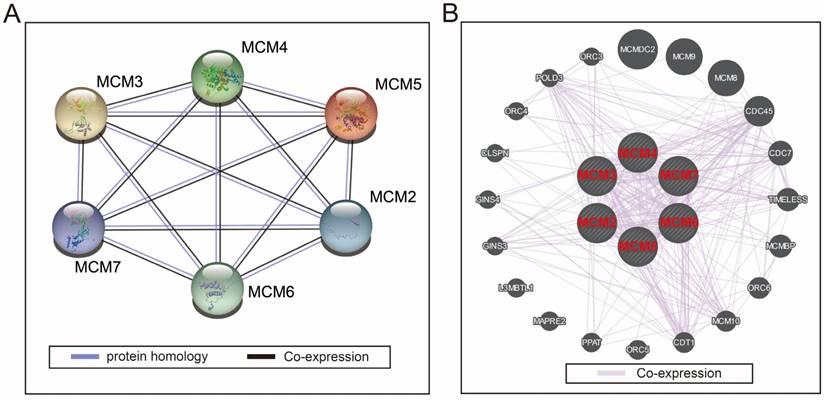
GO term enrichment analysis of the MCM genes, performed using DAVID, suggested that MCM genes were significantly enriched in DNA replication-related biological processes and the G1/S transition of the mitotic cell cycle (Figure 1A). However, the Kyoto Encyclopedia of Genes and Genomes (KEGG) pathway analysis using DAVID indicated that all of the MCM genes were significantly associated with DNA replication and the cell cycle signaling pathway (Figure 1B, Figure S1 and S2). The directed acyclic graph of MCM genes that was constructed by BiNGO in Cytoscape also suggested that the most significant biological function of these genes was in DNA replication (Figure S3). Gene-gene and protein-protein interaction networks substantiated that the MCM genes had a strong protein homology and co-expression with each other at both the gene and protein levels (Figure 2A and 2B).
GO term and KEGG analysis of MCM2-7 genes. (A) GO term enrichments of MCM2-7 genes. (B) KEGG enrichments of MCM2-7 genes.
Data source
In order to avoid the batch effect of microarray data in GSE14520, only the dataset of Affymetrix HT Human Genome U133A Array of GSE14520 was included in the current study. Because most of the patients in GSE14520 were HBV-related HCC, we excluded those patients without HBV infection reports and survival information. As a result, there were 212 HBV-related HCC tumor tissues and 204 adjacent normal liver tissues included in the current study, and all of the 212 HBV-related HCC patients had prognosis information. The raw data of the GSE14520 genome-wide expression profile were processed according to the manufacturer's guidelines (https://www.ncbi.nlm.nih.gov/geo/query/acc.cgi?acc=GSM362959). For multiple probe sets, the average value corresponding to the same gene was regarded as the gene's expression value and normalized by the limma package in R platform. In the validation cohort of HCC patients from TCGA, there were 371 primary tumor tissues and 50 adjacent normal liver tissues that were included in the current study. Of these, 370 HCC patients with prognosis information were used in the survival analysis. The RNA sequencing data of TCGA HCC genome-wide expression profile datasets were normalized by the DESeq package in the R platform.
Protein-protein and gene-gene interaction networks of MCM2-7 genes. (A) Protein-protein interaction networks; (B) GeneMANIA interaction networks.
Association analysis and diagnostic value assessment
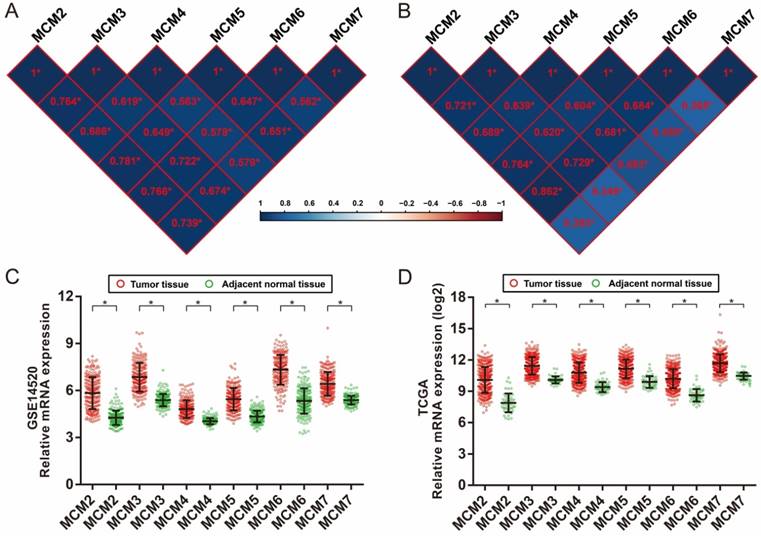
Co-expression analysis of MCM genes in HCC tumor tissues was assessed by Pearson's correlation coefficient. All the MCM genes were co-expressed strongly with each other in both the GSE14520 and TCGA cohort (Figure 3A and 3B). When comparing the expression of MCM genes between tumor tissues and adjacent normal liver tissues, we observed that all MCM genes were significantly upregulated in HCC tumor tissue in both the GSE14520 and TCGA cohorts (Figure 3C and 3D). Additional comparison of the MCM genes expression between normal liver tissue and primary liver cancer tissue was performed by MERAV. We observed a marked increase of expression in all the MCM genes in liver tumor tissue (Figure S4).
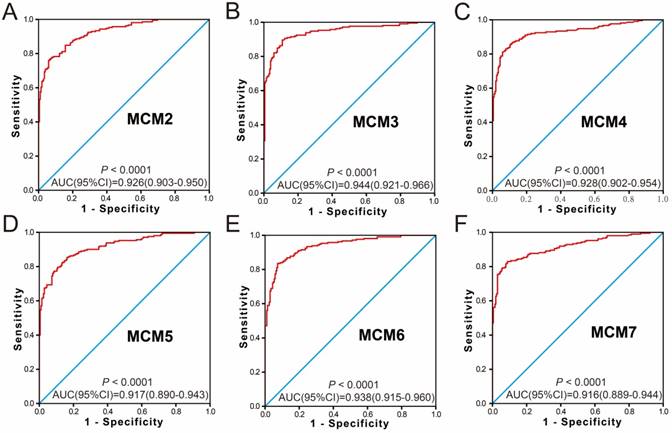
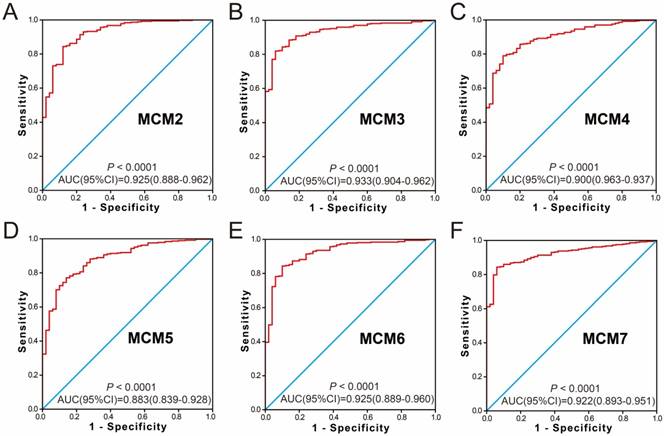
Because the MCM genes were significantly upregulated in HCC tumor tissue, the potential application of MCM genes in distinguishing HCC tumor tissues and adjacent normal liver tissues was also explored. The ROC analysis of MCM genes in the GSE14520 HBV-related HCC cohort indicated that all the MCM genes had high accuracy in distinguishing tumor tissues and adjacent normal liver tissues (the area under the curve [AUC] of the ROC curves of all MCM genes was >0.90, Figure 4A-F). The MCM genes of the TCGA HCC cohort showed a high accuracy in distinguishing tumor tissues and adjacent normal liver tissues (the AUC of the ROC curves of all MCM genes was >0.88; Figure 5A-F).
Survival analysis
In the GSE14520 HBV-related HCC cohort, we observed that patients with advanced BCLC stage and cirrhosis were at significantly increased risk of HBV-related HCC death and recurrence (Table 1). Male patients also have a high risk of recurrence in HBV-related HCC, whereas, patients with tumor sizes >5 cm and serum α-fetoprotein (AFP) >300 ng/ml also had a significantly increased risk of death (Table 1). The other clinical features in the GSE14520 cohort do not show a significant association with HBV-related HCC recurrence-free survival (RFS) and overall survival (OS).
Co-expression heat map and gene expression distribution of MCM genes in GSE14520 and TCGA cohort.(A) co-expression heat map of MCM genes in GSE14520; (B) co-expression heat map of MCM genes in TCGA; (C) gene expression distribution of MCM genes in GSE14520; (D) gene expression distribution of MCM genes in TCGA.* P < 0.0001.
The ROC curves of MCM gens in distinguish HBV-related HCC tumor tissue and adjacent normal tissues in GSE14520 cohort. ROC curves of MCM2 (A); MCM3 (B); MCM4 (C); MCM5 (D); MCM6 (E); MCM7 (F).
The ROC curves of MCM gens in distinguish HCC tumor tissue and adjacent normal tissues in TCGA cohort. ROC curves of MCM2 (A), MCM3 (B), MCM4 (C), MCM5 (D), MCM6 (E), and MCM7 (F).
Clinical characteristics of HBV-related HCC patients in GSE14520 cohort
| Variables | Patients (n=212) | RFS | OS | |||||||
|---|---|---|---|---|---|---|---|---|---|---|
| No. of events | MRT (months) | HR (95% CI) | P | No. of events | MST (months) | HR (95% CI) | P | |||
| Age(years) | ||||||||||
| ≤60 | 175 | 96 | 45 | 1 | 69 | NA | 1 | |||
| >60 | 37 | 20 | 48 | 0.974(0.602-1.578) | 0.916 | 13 | NA | 0.864(0.478-1.564) | 0.63 | |
| Gender | ||||||||||
| Female | 29 | 10 | NA | 1 | 8 | NA | 1 | |||
| Male | 183 | 106 | 40 | 2.143(1.120-4.100) | 0.021 | 74 | NA | 1.704(0.821-3.534) | 0.152 | |
| Multinodular | ||||||||||
| Single | 167 | 90 | 49 | 1 | 59 | NA | 1 | |||
| Multiple | 45 | 26 | 28 | 1.216(0.785-1.883) | 0.382 | 23 | 47 | 1.607(0.992-2.604) | 0.054 | |
| Tumor Size& | ||||||||||
| ≤5 cm | 137 | 73 | 51 | 1 | 46 | NA | 1 | |||
| >5 cm | 74 | 43 | 28 | 1.409(0.966-2.056) | 0.075 | 36 | 53 | 1.975(1.274-3.060) | 0.002 | |
| Cirrhosis | ||||||||||
| NO | 17 | 5 | NA | 1 | 2 | NA | 1 | |||
| Yes | 195 | 111 | 37 | 2.612(1.066-6.402) | 0.036 | 80 | NA | 4.335(1.065-17.638) | 0.041 | |
| BCLC stage | ||||||||||
| 0 | 20 | 6 | NA | 1 | 2 | NA | 1 | |||
| A | 143 | 74 | 51 | 2.050(2.892-4.711) | 0.091 | 48 | NA | 4.119(1.001-16.951) | 0.05 | |
| B | 22 | 15 | 26 | 4.019(1.550-10.421) | 0.004 | 12 | 46 | 8.992(2.005-40.320) | 0.004 | |
| C | 27 | 21 | 8 | 6.163(2.477-15.333) | <0.001 | 20 | 13 | 18.993(4.419-81.632) | <0.001 | |
| Serum AFPφ | ||||||||||
| ≤300 ng/ml | 115 | 62 | 48 | 1 | 39 | NA | 1 | |||
| >300 ng/ml | 94 | 54 | 35 | 1.200(0.833-1.728) | 0.328 | 43 | NA | 1.546(1.002-2.385) | 0.049 | |
Notes: &Information of tumor size was unavailable in 1 patients; φ Information of serum AFP was unavailable in 3 patients. HBV, hepatitis B virus; HCC, hepatocellular carcinoma; BCLC, Barcelona Clinic Liver Cancer; AFP, α-fetoprotein; MRT, median recurrence time; MST, median survival time; RFS, recurrence-free survival; OS, overall survival; HR, hazard ratio; CI, confidence interval; NA, not available.
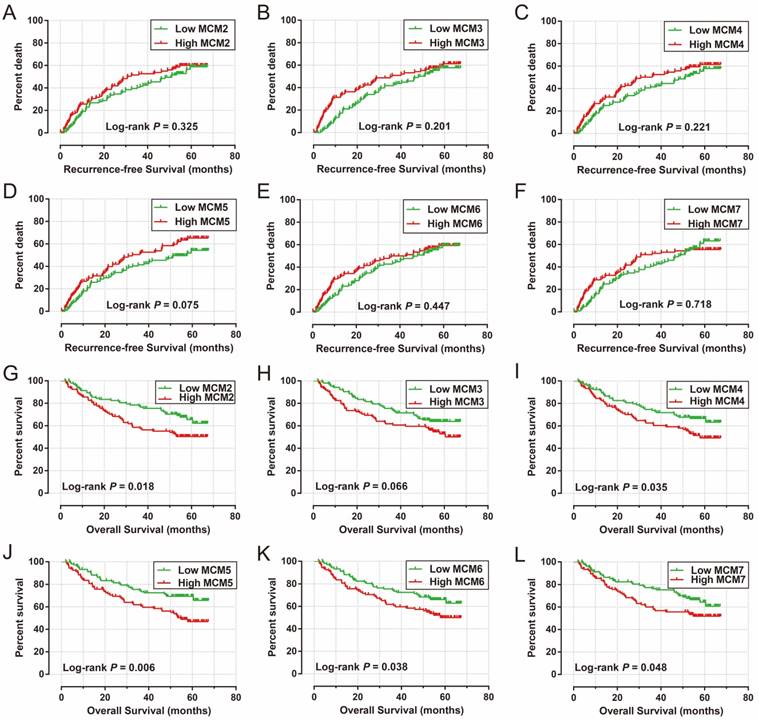
The survival analysis of MCM genes are shown in Figure 6A-L and Table 2, suggesting that patients with a high expression of MCM genes in the GSE14520 cohort seem to have a longer RFS in HBV-related HCC (Table 2, Figure 6A-F) compared to patients with a low expression, however, the P values did not reach statistical significance. Patients with high expression of MCM2 (adjusted P =0.043; adjusted HR=1.587; 95% CI=1.016-2.480; Table 2; Figure 6G), MCM4 (adjusted P =0.043; adjusted HR=1.577; 95%CI=1.014-2.543; Table 2; Figure 6I), MCM5 (adjusted P =0.003; adjusted HR=1.991; 95%CI=1.272-3.117; Table 2; Figure 6J), and MCM6 (adjusted P=0.046; adjusted HR=1.572; 95% CI= 1.008-2.452; Table 2; Figure 6K) were significantly associated with OS in HBV-related HCC, after adjusting for tumor size, cirrhosis, and BCLC stage.
Kaplan-Meier survival curves for MCM gens in HBV-related HCC of GSE14520 cohort. RFS stratified by MCM2 (A), MCM3 (B), MCM4 (C), MCM5 (D), MCM6 (E), and MCM7 (F). OS stratified by MCM2 (G), MCM3 (H), MCM4 (I), MCM5 (J), MCM6 (K), and MCM7 (L).
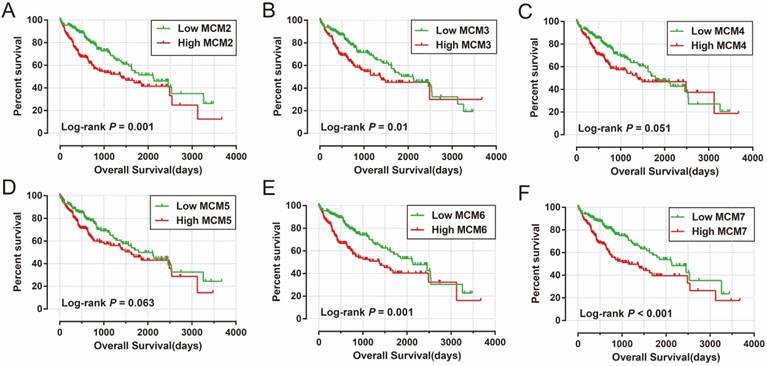
To verify and generalize the results obtained from the GSE14520 cohort, we also assessed the prognostic values of MCM genes expression in HCC OS prediction in the HCC patients from the TCGA cohort. The clinical characteristics of HCC patients in the TCGA cohort are summarized in Table 3. Patients with tumor stage III/IV (P <0.0001; HR=2.764; 95% CI=1.823-4.190; Table 3) and without radical resection (P =0.007; HR=2.030; 95% CI=1.213-3.395; Table 3) had a significantly increased risk of death from HCC, and this data was adjusted in the multivariate Cox proportional hazards model. Survival analysis of MCM genes in TCGA HCC patients are shown in Table 4 and Figure 7A-F. The mRNA expression of MCM2 (adjusted P =0.02; adjusted HR=1.574; 95% CI=1.073-2.309; Table 4; Figure 7A), MCM6 (adjusted P =0.015; adjusted HR=1.603; 95% CI=1.094-2.350; Table 4; Figure 7E), and MCM7 (adjusted P =0.003; adjusted HR=1.793; 95% CI=1.222-2.630; Table 4; Figure 7F) were significantly associated with HCC OS in the TCGA cohort.
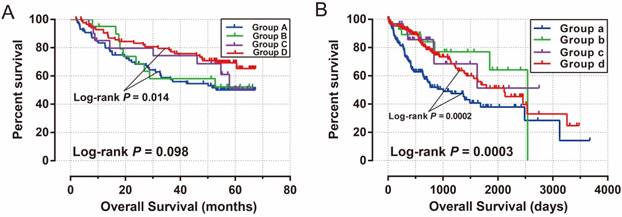
After performing survival analysis in both the GSE14520 and TCGA cohorts, we found that both the expression of MCM2 and MCM6 genes were significantly associated with HCC OS in these two cohorts. Therefore, we investigated the joint effects of MCM2 and MCM6 expression in the OS of HCC patients. In the GSE14520 cohort, patients with both low expression of MCM2 and MCM6 had a significantly decreased risk of death in HBV-related HCC (adjusted P =0.025; adjusted HR=0.562; 95% CI= 0.339-0.929; Table 5; Figure 8A), compared to patients with high expression of both MCM2 and MCM6. Similar results were found in the TCGA cohort (both the low MCM2 and MCM6 groups vs. both the high MCM2 and MCM6 groups, adjusted P =0.01; adjusted HR=0.584; 95% CI=0.388-0.881; Table 5; Figure 8B). In addition, we observed that patients with high MCM2 and low MCM6 had a significantly decreased risk of death in the TCGA HCC cohort (adjusted P =0.044; adjusted HR=0.444; 95% CI=0.202-0.977; Table 5; Figure 8B), compared to the patients with a high expression of both MCM2 and MCM6.
Prognostic values of MCM genes expression in HBV-related HCC of GSE14520 cohort
| Gene expression | Patients (n=212) | RFS | OS | |||||||||||
|---|---|---|---|---|---|---|---|---|---|---|---|---|---|---|
| NO. of event | MRT (months) | Crude HR (95% CI) | Crude P | Adjusted HR (95% CI) | Adjusted P § | NO. of event | MST (months) | Crude HR (95% CI) | Crude P | Adjusted HR (95% CI) | Adjusted P § | |||
| MCM2 | ||||||||||||||
| Low | 106 | 57 | 51 | 1 | 1 | 34 | NA | 1 | 1 | |||||
| High | 106 | 59 | 30 | 1.200(0.834-1.728) | 0.326 | 1.125(0.776-1.629) | 0.534 | 48 | NA | 1.693(1.090-2.629) | 0.019 | 1.587(1.016-2.480) | 0.043 | |
| MCM3 | ||||||||||||||
| Low | 106 | 56 | 48 | 1 | 1 | 36 | NA | 1 | 1 | |||||
| High | 106 | 60 | 36 | 1.268(0.880-1.826) | 0.202 | 1.306(0.905-1.885) | 0.154 | 46 | NA | 1.502(0.971-2.324) | 0.068 | 1.516(0.976-2.354) | 0.064 | |
| MCM4 | ||||||||||||||
| Low | 106 | 56 | 51 | 1 | 1 | 35 | NA | 1 | 1 | |||||
| High | 106 | 60 | 30 | 1.255(0.872-1.807) | 0.222 | 1.285(0.891-1.854) | 0.179 | 47 | 57 | 1.596(1.030-2.474) | 0.037 | 1.577(1.014-2.543) | 0.043 | |
| MCM5 | ||||||||||||||
| Low | 106 | 53 | 57 | 1 | 1 | 32 | NA | 1 | 1 | |||||
| High | 106 | 63 | 32 | 1.392(0.966-2.007) | 0.076 | 1.427(0.985-2.066) | 0.06 | 50 | 54 | 1.857(1.191-2.895) | 0.006 | 1.991(1.272-3.117) | 0.003 | |
| MCM6 | ||||||||||||||
| Low | 106 | 58 | 48 | 1 | 1 | 35 | NA | 1 | 1 | |||||
| High | 106 | 58 | 36 | 1.152(0.800-1.657) | 0.448 | 1.111(0.765-1.613) | 0.58 | 47 | 57 | 1.584(1.022-2.455) | 0.04 | 1.572(1.008-2.452) | 0.046 | |
| MCM7 | ||||||||||||||
| Low | 106 | 60 | 48 | 1 | 1 | 35 | NA | 1 | 1 | |||||
| High | 106 | 56 | 30 | 1.069(0.743-1.539) | 0.719 | 0.987(0.677-1.437) | 0.945 | 47 | NA | 1.549(1.000-2.401) | 0.05 | 1.387(0.885-2.174) | 0.154 | |
Notes: §Adjusted for tumor size, cirrhosis, BCLC stage; MCM, minichromosome maintenance; HBV, hepatitis B virus; HCC, hepatocellular carcinoma; MRT, median recurrence time; MST, median survival time; RFS, recurrence-free survival; OS, overall survival; HR, hazard ratio; CI, confidence interval; NA, not available.
Clinical characteristics of HCC patients in TCGA cohort
| Variables | Patients (n=370) | No. of events | MST (days) | Crude HR (95% CI) | P |
|---|---|---|---|---|---|
| Age(years) | |||||
| ≤60 | 177 | 55 | 2532 | 1 | |
| >60 | 193 | 75 | 1622 | 1.246(0.879-1.766) | 0.217 |
| Sex | |||||
| female | 121 | 51 | 1490 | 1 | |
| male | 249 | 79 | 2486 | 0.817(0.573-1.164) | 0.262 |
| Alcohol consumption a | |||||
| NO | 234 | 84 | 1694 | 1 | |
| YES | 117 | 40 | 1624 | 1.026(0.703-1.496) | 0.896 |
| Ishak fibrosis score b | |||||
| 0 - No Fibrosis | 74 | 30 | 2131 | 1 | |
| 1,2 - Portal Fibrosis | 31 | 9 | 1372 | 0.917(0.429-1.962) | 0.823 |
| 3,4 - Fibrous Speta | 28 | 6 | NA | 0.682(0.281-1.654) | 0.397 |
| 5 - Nodular Formation and Incomplete Cirrhosis | 9 | 2 | 1386 | 0.750(0.177-3.167) | 0.695 |
| 6 - Established Cirrhosis | 69 | 17 | NA | 0.766(0.418-1.403) | 0.388 |
| Tumor Stage c | |||||
| I | 171 | 42 | 2532 | 1 | |
| II | 85 | 26 | 1852 | 1.427(0.874-2.330) | 0.155 |
| III/IV | 90 | 48 | 770 | 2.764(1.823-4.190) | <0.0001 |
| Histologic Grade d | |||||
| G1 | 55 | 18 | 2116 | 1 | |
| G2 | 177 | 60 | 1685 | 1.181(0.697-2.000) | 0.537 |
| G3 | 121 | 43 | 1622 | 1.233(0.711-2.140) | 0.456 |
| G4 | 12 | 5 | NA | 1.693(0.626-4.584) | 0.3 |
| Serum AFP e | |||||
| ≤400 ng/ml | 213 | 62 | 2456 | 1 | |
| >400 ng/ml | 64 | 22 | 2486 | 1.055(0.645-1.724) | 0.832 |
| Radical resection f | |||||
| R0 | 323 | 110 | 1852 | 1 | |
| R1/R2/RX | 40 | 17 | 837 | 2.030(1.213-3.395) | 0.007 |
| Micro Vascular Invasion g | |||||
| NO | 206 | 60 | 2131 | 1 | |
| YES | 108 | 36 | 2486 | 1.351(0.892-2.047) | 0.155 |
| Child-Pugh score h | |||||
| A | 216 | 59 | 2542 | 1 | |
| B/C | 22 | 9 | 1005 | 1.614(0.796-3.270) | 0.184 |
Notes: a Information of alcohol consumption was unavailable in 19 patients; b Information of ishak fibrosis score was unavailable in 159 patients; c Information of tumor stage was unavailable in 24 patients; d Information of histologic grade was unavailable in 5 patients; e Information of serum AFP was unavailable in 93 patients; f Information of radical resection was unavailable in 7 patients; g Information of micro vascular invasion was unavailable in 56 patients; h Information of Child-Pugh score was unavailable in 132 patients; HCC, hepatocellular carcinoma; TCGA, The Cancer Genome Atlas; OS, overall survival; MST, median survival time; HR, hazard ratio; CI, confidence interval; AFP, α-fetoprotein; NA, not available.
Prognostic values of MCM genes expression in HCC OS of TCGA cohort
| Gene expression | Patients(n=370) | NO. of event | MST (days) | Crude HR (95% CI) | Crude P | Adjusted HR (95% CI) | Adjusted P § |
|---|---|---|---|---|---|---|---|
| MCM2 | |||||||
| Low | 185 | 54 | 2116 | 1 | 1 | ||
| High | 185 | 76 | 1397 | 1.782(1.256-2.529) | 0.001 | 1.574(1.073-2.309) | 0.02 |
| MCM3 | |||||||
| Low | 185 | 60 | 2116 | 1 | 1 | ||
| High | 185 | 70 | 1372 | 1.580(1.114-2.242) | 0.010 | 1.456(0.992-2.136) | 0.055 |
| MCM4 | |||||||
| Low | 185 | 62 | 1791 | 1 | 1 | ||
| High | 185 | 68 | 1397 | 1.408(0.997-1.990) | 0.052 | 1.302(0.895-1.894) | 0.167 |
| MCM5 | |||||||
| Low | 185 | 59 | 1.791 | 1 | 1 | ||
| High | 185 | 71 | 1622 | 1.386(0.980-1.960) | 0.065 | 1.299(0.893-1.891) | 0.172 |
| MCM6 | |||||||
| Low | 185 | 54 | 2131 | 1 | 1 | ||
| High | 185 | 76 | 1372 | 1.842(1.297-2.615) | 0.001 | 1.603(1.094-2.350) | 0.015 |
| MCM7 | |||||||
| Low | 185 | 53 | 2131 | 1 | 1 | ||
| High | 185 | 77 | 1149 | 1.852(1.304-2.632) | 0.001 | 1.793(1.222-2.630) | 0.003 |
Notes: §Adjusted for tumor stage and radical resection. MCM, minichromosome maintenance; HCC, hepatocellular carcinoma; OS, overall survival; MST, median survival time; HR, hazard ratio; CI, confidence interval; TCGA, The Cancer Genome Atlas.
Kaplan-Meier survival curves for MCM gens in HCC of TCGA cohort. OS stratified by MCM2 (A), MCM3 (B), MCM4 (C), MCM5 (D), MCM6 (E), and MCM7 (F).
Joint effects analysis of MCM2 and MCM6 expression in HCC patients OS
| Group | MCM2 | MCM6 | Patients | NO. of event | MST | Crude HR (95% CI) | Crude P | Adjusted HR (95% CI) | Adjusted P § |
|---|---|---|---|---|---|---|---|---|---|
| GSE14520 cohort | n=212 | months | |||||||
| A | High | High | 86 | 39 | 53 | 1 | 1 | ||
| B | High | Low | 20 | 9 | NA | 0.874(0.423-1.805) | 0.716 | 0.803(0.384-1.679) | 0.56 |
| C | low | High | 20 | 8 | NA | 0.747(0.349-1.598) | 0.452 | 0.791(0.365-1.714) | 0.552 |
| D | Low | Low | 86 | 26 | NA | 0.537(0.327-0.883) | 0.014 | 0.562(0.339-0.929) | 0.025 |
| TCGA cohort | n=370 | days | |||||||
| a | High | High | 153 | 69 | 1005 | 1 | 1 | ||
| b | High | Low | 32 | 7 | 2542 | 0.393(0.181-0.857) | 0.019 | 0.444(0.202-0.977) | 0.044 |
| c | low | High | 32 | 7 | NA | 0.431(0.198-0.938) | 0.034 | 0.442(0.190-1.028) | 0.058 |
| d | Low | Low | 153 | 47 | 2116 | 0.502(0.346-0.728) | <0.001 | 0.584(0.388-0.881) | 0.01 |
Notes: § Adjusted for tumor size, cirrhosis, BCLC stage in GSE14520 cohort; and adjusted for tumor stage and radical resection in TCGA cohort. MCM, minichromosome maintenance; HCC, hepatocellular carcinoma; OS, overall survival; MST, median survival time; HR, hazard ratio; CI, confidence interval; TCGA, The Cancer Genome Atlas; NA, not available.
Kaplan-Meier survival curve for joint effects analysis of MCM2 and MCM6 genes in HCC patients. (A) Joint effects analysis of MCM2 and MCM6 in GSE14520 cohort; (B) Joint effects analysis of MCM2 and MCM6 in TCGA cohort.
Prognostic signature construction
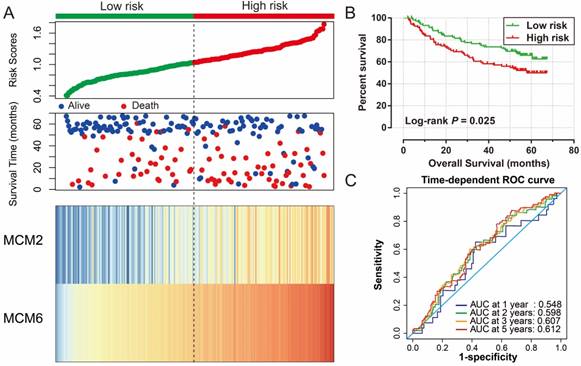
The MCM2 and MCM6 were associated with a significantly different survival in the joint effects survival analysis; however, the combination of MCM2 and MCM6 in prognostic prediction still needed further development. Our previous study divided the patients into high and low risk groups using a risk score model based on the expression of genes [25]; therefore, MCM2 and MCM6 expression were used for further prognostic signature construction. In the GSE14520 cohort, the regression coefficient (β) that was derived from the multivariate Cox proportional hazards regression model and the risk score formula was: risk score = expression of MCM2 × 0.181 + expression of MCM6×1.552. Survival analysis of the prognostic signature in the GSE14520 cohort suggested that patients with a high risk score had a significantly increased risk of death in HBV-related HCC compared to the patients with a low risk score (adjusted P=0.026; adjusted HR=1.656; 95% CI=1.063-2.581; Table 6; Figure 9A, B). Time-dependent ROC analysis of the risk score indicated that the prognostic signature performed well in the HBV-related HCC OS prediction of the GSE14520 cohort, as the AUC of the ROC curve was 0.548, 0.598, 0.607, and 0.612 for 1-, 2-, 3-, and 5-year survival (Figure 9C), respectively.
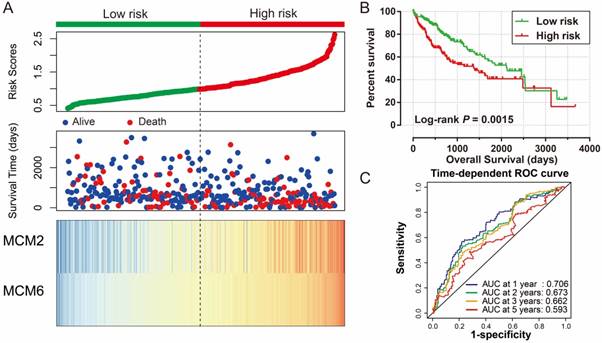
The multivariate Cox proportional hazards regression model was used in the validation cohort of TCGA HCC patients with the following risk score formula: risk score=expression of MCM2 × 0.0878 + expression of MCM6×0.3056. Patients with a high risk score had a significantly increased risk of death in HCC (adjusted P=0.034; adjusted HR=1.512; 95% CI=1.033-2.213; Table 6; Figure 10A, B), compared to the patients with a low risk score. The AUC of the time-dependent ROC curve was 0.706, 0.673, 0.662, and 0.593 for 1-, 2-, 3-, and 5-year survival (Figure 10C), respectively.
Survival analysis of MCM gene expression prognostic signature in HCC patients
| Variables | Patients | NO. of event | MST | Crude HR (95% CI) | Crude P | Adjusted HR (95% CI) | Adjusted P § |
|---|---|---|---|---|---|---|---|
| GSE14520 | n=212 | months | |||||
| Low risk | 106 | 35 | NA | 1 | 1 | ||
| High risk | 106 | 47 | 57 | 1.643(1.060-2.547) | 0.026 | 1.656(1.063-2.581) | 0.026 |
| TCGA | n=370 | days | |||||
| Low risk | 185 | 55 | 2131 | 1 | 1 | ||
| High risk | 185 | 75 | 1397 | 1.751(1.234-2.485) | 0.002 | 1.512(1.033-2.213) | 0.034 |
Notes: § Adjusted for tumor size, cirrhosis, BCLC stage in GSE14520 cohort; and adjusted for tumor stage and radical resection in TCGA cohort. MCM, minichromosome maintenance; MST, median survival time; HR, hazard ratio; CI, confidence interval; TCGA, The Cancer Genome Atlas.
GSEA
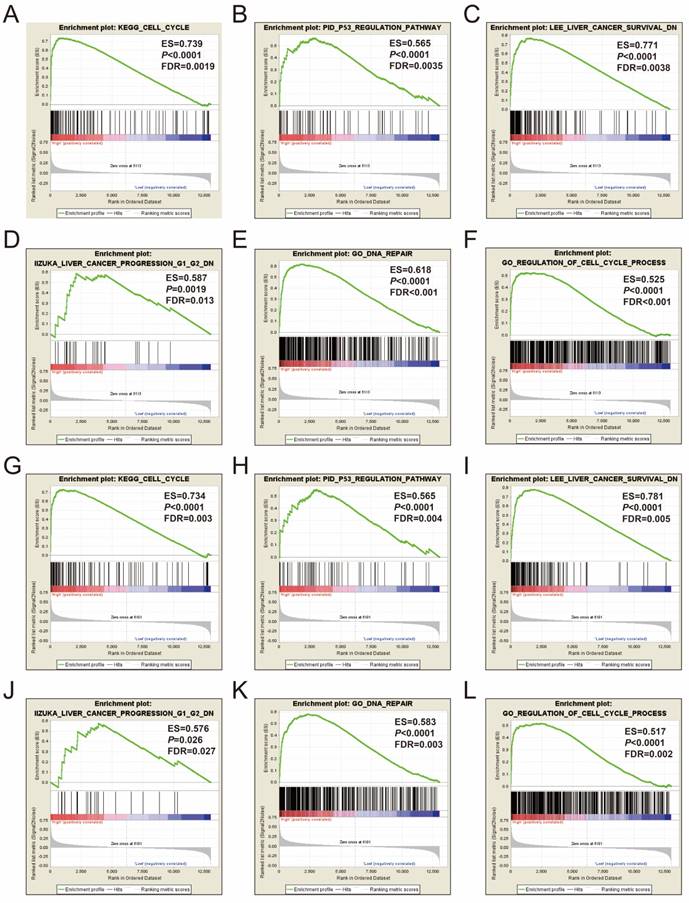
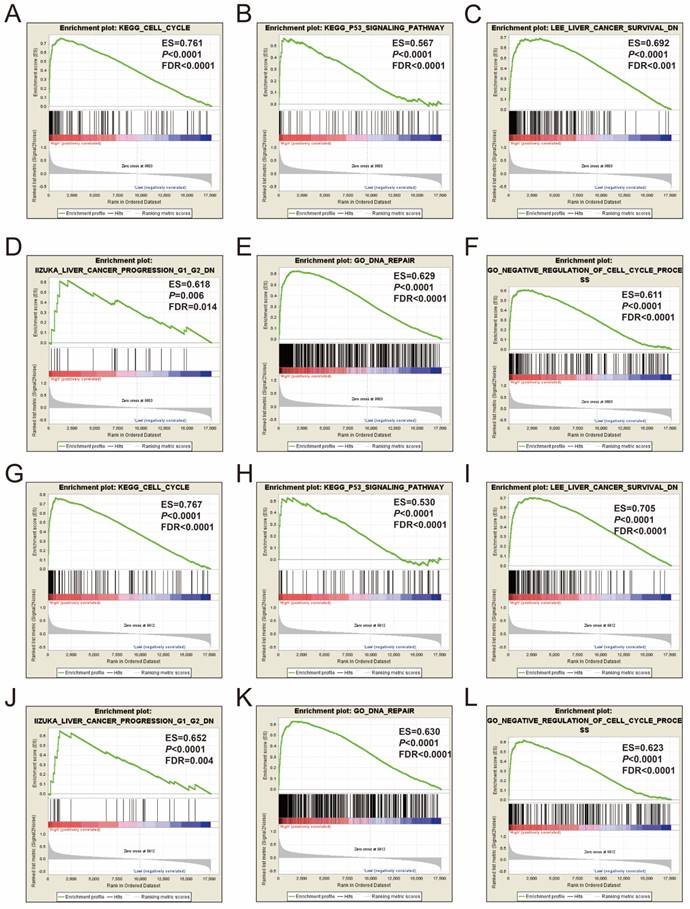
GSEA of MCM2 and MCM6 were also performed in both the GSE14520 and TCGA cohorts. The genome-wide expression profile dataset of the GSE14520 and TCGA cohorts were divided into two groups according to the median values of the MCM2 and MCM6 genes, respectively. GSEA results of the GSE14520 cohort are shown in Figure 11A-L and Table S1-4, which suggested that both the high expression of MCM2 and MCM6 were significantly correlated with cell cycle process, P53 regulation pathway, liver cancer survival, liver cancer progression G1 and G2, and DNA repair. The MCM2 and MCM6 GSEA results in the GSE14520 cohort could also be validated in the TCGA HCC cohort, and high expressions of MCM2 and MCM6 were also significantly correlated with cell cycle process, P53 regulation pathway, liver cancer survival, liver cancer progression G1 and G2, and DNA repair (Figure 12A-L and Table S5-8).
Prognostic risk score model analysis of MCM2 and MCM6 genes in HBV-related HCC patients of GSE14520 cohort. (A) From top to bottom are the risk score, patients' survival status distribution, and MCM2 and MCM6 genes heat map for low- and high-risk groups. (B) Kaplan-Meier curves for low- and high-risk groups. (C) ROC curve for predicting survival in HCC patients by the risk score.
Prognostic risk score model analysis of MCM2 and MCM6 genes in HCC patients of TCGA cohort. (A) From top to bottom are the risk score, patients' survival status distribution, and MCM2 and MCM6 genes heat map for low- and high-risk groups. (B) Kaplan-Meier curves for low- and high-risk groups. (C) ROC curve for predicting survival in HCC patients by the risk score.
Discussion
The MCM genes play a critical role in DNA replication [8, 36, 37]. The MCM2-7 gene family is comprised of six structurally related proteins, which can form a hexameric complex, and this complex is an essential component in early G1 phase [8, 36, 37]. Our gene function enrichment analysis also suggested that MCM2-7 genes were significantly enriched in DNA replication and cell cycle biological processes and pathways. Co-expression analysis demonstrated that MCM2-7 genes were strongly co-expressed with each other at both the gene and protein levels, as well as in HCC tumor tissues.
GSEA results of MCM2 and MCM6 in GSE14520 HBV-related HCC patients. (A-D) GSEA results of c2 reference gene sets for high MCM2 expression groups; (E-F) GSEA results of c5 reference gene sets for high MCM2 expression groups. (G-J) GSEA results of c2 reference gene sets for high MCM6 expression groups; (K-L) GSEA results of c5 reference gene sets for high MCM6 expression groups.
Extensive studies have reported that MCM2-7 genes are potential diagnostic markers in multiple cancers. Previous studies indicated that MCM2 is upregulated in colorectal cancer tumor tissue, and could be used as a diagnostic marker using immunocytochemical analysis from patients' tissues or colonocytes retrieved from the fecal surface [38, 39]. Similar immunocytochemical detection of MCM2 in cells retrieved from urine also showed a diagnosis value in bladder cancer [40] and cervical cancer screening [41]. The immunocytological evaluation of MCM3 can be used for early detection of oral squamous cell carcinoma [42]. The potential diagnostic value of MCM5 has also been investigated in genito-urinary tract cancer [11, 43], oesophageal cancer [12], pancreaticobiliary malignancy [44, 45], and cervical cancer screening [41]. In addition, MCM7 can be used for the early diagnosis of gastric cancer [46], and differential diagnosis between reactive mesothelial cells and malignant mesothelioma cells [47, 48]. A study by Saydam et al. reported that MCM2-7 genes were upregulated in meningiomas tumor tissues and could serve as potential diagnostic markers [49]. Consistent with the study by Saydam and his co-workers, our current study also observed that MCM2-7 genes were upregulated in HCC tumor tissues, and ROC analysis suggested that MCM2-7 genes may be potential diagnostic markers in HCC.
GSEA results of MCM2 and MCM6 in TCGA HCC patients. (A-D) GSEA results of c2 reference gene sets for high MCM2 expression groups; (E-F) GSEA results of c5 reference gene sets for high MCM2 expression groups. (G-J) GSEA results of c2 reference gene sets for high MCM6 expression groups; (K-L) GSEA results of c5 reference gene sets for high MCM6 expression groups
In the present study, we observed that the expression of MCM2, MCM4, MCM5, and MCM6 were significantly associated with HBV-related HCC OS in the GSE14520 cohort, whereas expression of MCM2, MCM6, and MCM7 were correlated with HCC OS in the TCGA cohort. Joint effects survival analysis suggested that patients with low expression of both MCM2 and MCM6 had a significantly decreased risk of death in HBV-related HCC compared to the patients with high expression of both MCM2 and MCM6. In addition, the risk score model, which constructed based on the expression of MCM2 and MCM6 in the GSE14520 and TCGA cohorts, also could divided the patients into high- and low-risk groups, and patients with high risk scores were significant associated with a poor OS. However, the prognostic values of MCM2-7 genes in multiple cancers also have been reported in previous studies. Numerous studies have demonstrated that the high expression of MCM2 predicts a poor prognosis in patients with gastric cancer [50-52], lung cancer [10, 53], ovarian adenocarcinomas [54], and muscle-invasive urothelial bladder carcinomas [55]. Additionally, the expression of MCM2 is also an independent predictor of recurrence in stage Ta/T1 bladder cancer [56]. High expression of MCM3 and MCM4, identified by immunohistochemistry, were significantly associated with OS in patients with astrocytoma [57] and esophageal adenocarcinoma [58], respectively. Expression of MCM5 also increased markedly in lung cancer and cervical cancer, and patients with a high expression of MCM5 had a significantly increased risk of death [59, 60]. Immunohistochemical staining of MCM6 showed a strong correlation between MCM6 expression and OS in patients with non-small cell lung carcinoma [61], low-grade chondrosarcoma [62], mantle cell lymphoma [63], and endometrioid endometrial adenocarcinoma [64], and these patients were significantly correlated with a poor OS. Furthermore, high MCM6 immunohistochemical staining significantly increased the risk of recurrence in patients with meningiomas, as well as correlated with the histological grade [65].
Similar results of MCM7 expression in cancer prognosis, identified by immunohistochemical staining, was found in non-small cell lung cancer [66, 67], colorectal cancer [68, 69], oral squamous cell carcinoma [70], HCC [71-73], and oesophageal squamous cell carcinoma [74]. These studies suggested that the MCM7 gene may serve as a prognostic biomarker, and high MCM7 expression in these cancers were significantly associated with a poor OS. Consistent with the results of the MCM7 gene in cancer OS, high expression of MCM7 also significantly correlated with a poor RFS of colorectal cancer [68], gastric adenocarcinoma [75], pituitary adenoma [76] and meningiomas [77], and lymph node metastasis of oral squamous cell carcinoma [78]. By reviewing these studies, a potential prognostic role for MCM genes in HCC was identified in the current study and was consistent with previous studies, which indicated that these MCM genes may serve as oncogenes in cancer. However, our findings still need further validation.
Due to the function of the MCM genes, they have been reported to play an important multi-aspect role in HCC, such as in diagnosis, progression, and prognosis. Previous studies substantiated that MCM2 was a novel marker to assess the progression from liver cirrhosis to HCC [79], and proliferation and metastasis of HCC cells could be inhibited by long noncoding RNA FTX through binding MCM2 and miR-374a [80]. In addition, MCM2 could serve as a prognostic biomarker and therapeutic target for HCC [81, 82], and MCM7 also can act as a prognostic biomarker for HCC [71-73]. Polymorphisms of MCM4 rs2305952 may be associated with susceptibility of HCC [83], and plasma MCM6 serves as a diagnostic biomarker for HCC patients, especially in patients with AFP-negative and small HCC [84].
GSEA in the current study indicated that MCM2 and MCM6 were significantly associated with liver cancer survival and progression, and the potential mechanism of MCM2 and MCM6 in HCC prognosis may involve signal pathway and biological processes of the cell cycle, DNA repair, and p53, which were correlated with their biological functions. As is well-known, MCM genes play a critical role in DNA replication and participate in the cell cycle process [8]. Previous studies also demonstrated that the function of the MCM2 gene was to participate in the p53 pathway in non-small cell lung carcinomas [85] and in a mouse fibroblast 3T3 cell line[86], followed by cellular apoptosis. Furthermore, immunocytochemistry of the MCM2 and p53 combination can be used for distinguishing benign cells from malignant cells in squamous cell carcinoma [87] and pancreaticobiliary adenocarcinoma [88]. However, the functional correlation between p53 and MCM6 has not been reported in previous studies. Due to the co-expression and GSEA of MCM6 and MCM2, we concluded that MCM6 may participate in the p53 pathway by affecting MCM2 expression. However, this hypothesis still needs further experimental confirmation.
There are some limitations in the current study that need clarification. All data in the current study were obtained from public databases and the clinical parameters were incomplete; therefore, we could not perform a comprehensive survival analysis of MCM genes that considered all the potential prognostic factors of HCC in multivariate Cox proportional hazards regression model analysis. Second, due to the different sources of HCC patients and multiple factors that influence the HCC prognosis, we could not construct a unified risk score model that was based on MCM2 and MCM6 expression levels for prognosis prediction in patients with HCC. Third, by comparison with the previous study, the limitation of our current study was that it only investigated the association between the mRNA expression of the MCM genes and HCC prognosis; however, the relationship between the MCM protein level and HCC prognosis prediction still needs further exploration.
Despite these limitations, in the present study, we have identified and validated the diagnostic and prognostic values of the expression of the MCM genes in patients with HCC, and also investigated the potential mechanism of MCM2 and MCM6 in HCC prognosis through GSEA. Once these results are verified the diagnostic and prognostic values of MCM genes at the protein level, these genes may have a potential clinical application value in HCC diagnosis, cancer management and targeted therapy. However, prospective validation with a larger sample size is necessary before the MCM genes can be included in diagnosis and prognostic monitoring for patients with HCC.
Conclusions
In the present study, we found that all MCM genes were significantly upregulated in tumor tissue, and had a potential diagnostic value in patients with HCC. Survival analysis in the GSE14520 and TCGA cohorts suggested that MCM2 and MCM6 may serve as potential prognostic biomarkers in patients with HCC. Survival analysis of the risk score model and joint effects analysis indicated that the combination of MCM2 and MCM6 could also serve as an indicator for HCC prognosis prediction. However, our findings still need further validation, and the prognostic values of other MCM genes still need prospective validation in a larger number of patients.
Abbreviations
MCM, minichromosome maintenance; MST, median survival time; RFS, recurrence-free survival; OS, overall survival; HR, hazard ratio; CI, confidence interval; HBV, hepatitis B virus; HCC, hepatocellular carcinoma; TCGA, The Cancer Genome Atlas; AFP, α-fetoprotein; GO, gene ontology; KEGG, Kyoto Encyclopedia of Genes and Genomes; ROC, receiver operating characteristic; ES, enrichment score; FDR, false discovery rate; GSEA, gene set enrichment analysis.
Acknowledgements
This work was supported in part by the National Nature Science Foundation of China (No.: 81560535, 81072321, 30760243, 30460143 and 30560133), 2009 Program for New Century Excellent Talents in University (NCET), Guangxi Nature Sciences Foundation (No.: GuiKeGong 1104003A-7), and Guangxi Health Ministry Medicine Grant (Key-Scientific Research-Grant Z201018). The present study is also partly supported by Self-raised Scientific Research Fund of the Health and Family Planning Commission of Guangxi Zhuang Autonomous Region (Z2016318), The Basic Ability Improvement Project for Middle-aged and Young Teachers in Colleges and Universities in Guangxi (2018KY0110), Innovation Project of Guangxi Graduate Education (JGY2018037), and Research Institute of Innovative Think-tank in Guangxi Medical University (The gene-environment interaction in hepatocarcinogenesis in Guangxi HCCs and its translational applications in the HCC prevention). We would acknowledge the supported by the National Key Clinical Specialty Programs (General Surgery & Oncology) and the Key Laboratory of Early Prevention & Treatment for Regional High-Incidence-Tumor (Guangxi Medical University), Ministry of Education, China. The authors also thank the contributors of GSE14520 (https://www.ncbi.nlm.nih.gov/geo/query/acc.cgi?acc=GSE14520), The Cancer Genome Atlas (https://cancergenome.nih.gov/) and UCSC Xena (http://xena.ucsc.edu/) for sharing the HCC dataset on open access. In addition, we would like to acknowledge the helpful comments on this article received from our reviewers.
Authors' Contributions
Xiwen Liao, Xiaoguang Liu and Tao Peng designed this manuscript; Xiwen Liao, Xiaoguang Liu, Chengkun Yang, Xiangkun Wang, Tingdong Yu, Chuangye Han, Ketuan Huang, Guangzhi Zhu, Hao Su,Wei Qin, Rui Huang, Long Yu, Jianlong Deng, Xianmin Zeng, Xinping Ye, and Tao Peng conducted the study, collected and analyzed the data. Xiwen Liao wrote and revised the manuscript, Xiaoguang Liu contributed to the data interpretation, and Tao Peng guided the writing.
Supplementary Material
Supplementary figures.
Supplementary tables.
Competing Interests
The authors have declared that no competing interest exists.
References
1. Torre LA, Bray F, Siegel RL, Ferlay J, Lortet-Tieulent J, Jemal A. Global cancer statistics, 2012. CA: a cancer journal for clinicians. 2015;65:87-108
2. Chen W, Zheng R, Baade PD, Zhang S, Zeng H, Bray F. et al. Cancer statistics in China, 2015. CA: a cancer journal for clinicians. 2016;66:115-32
3. El-Serag HB, Rudolph KL. Hepatocellular carcinoma: epidemiology and molecular carcinogenesis. Gastroenterology. 2007;132:2557-76
4. George J, Patel T. Noncoding RNA as therapeutic targets for hepatocellular carcinoma. Seminars in liver disease. 2015;35:63-74
5. Klingenberg M, Matsuda A, Diederichs S, Patel T. Non-coding RNA in hepatocellular carcinoma: Mechanisms, biomarkers and therapeutic targets. Journal of hepatology. 2017;67:603-18
6. Shibata C, Otsuka M, Kishikawa T, Ohno M, Yoshikawa T, Takata A. et al. Diagnostic and therapeutic application of noncoding RNAs for hepatocellular carcinoma. World journal of hepatology. 2015;7:1-6
7. Jenkinson ER, Chong JP. Minichromosome maintenance helicase activity is controlled by N- and C-terminal motifs and requires the ATPase domain helix-2 insert. Proceedings of the National Academy of Sciences of the United States of America. 2006;103:7613-8
8. Kearsey SE, Labib K. MCM proteins: evolution, properties, and role in DNA replication. Biochimica et biophysica acta. 1998;1398:113-36
9. Gonzalez MA, Pinder SE, Callagy G, Vowler SL, Morris LS, Bird K. et al. Minichromosome maintenance protein 2 is a strong independent prognostic marker in breast cancer. Journal of clinical oncology: official journal of the American Society of Clinical Oncology. 2003;21:4306-13
10. Ramnath N, Hernandez FJ, Tan DF, Huberman JA, Natarajan N, Beck AF. et al. MCM2 is an independent predictor of survival in patients with non-small-cell lung cancer. Journal of clinical oncology: official journal of the American Society of Clinical Oncology. 2001;19:4259-66
11. Dudderidge TJ, Kelly JD, Wollenschlaeger A, Okoturo O, Prevost T, Robson W. et al. Diagnosis of prostate cancer by detection of minichromosome maintenance 5 protein in urine sediments. British journal of cancer. 2010;103:701-7
12. Williams GH, Swinn R, Prevost AT, De Clive-Lowe P, Halsall I, Going JJ. et al. Diagnosis of oesophageal cancer by detection of minichromosome maintenance 5 protein in gastric aspirates. British journal of cancer. 2004;91:714-9
13. Zhong H, Chen B, Neves H, Xing J, Ye Y, Lin Y. et al. Expression of minichromosome maintenance genes in renal cell carcinoma. Cancer management and research. 2017;9:637-47
14. Dennis G Jr, Sherman BT, Hosack DA, Yang J, Gao W, Lane HC. et al. DAVID: Database for Annotation, Visualization, and Integrated Discovery. Genome biology. 2003;4:P3
15. Huang da W, Sherman BT, Lempicki RA. Systematic and integrative analysis of large gene lists using DAVID bioinformatics resources. Nature protocols. 2009;4:44-57
16. Maere S, Heymans K, Kuiper M. BiNGO: a Cytoscape plugin to assess overrepresentation of gene ontology categories in biological networks. Bioinformatics. 2005;21:3448-9
17. Warde-Farley D, Donaldson SL, Comes O, Zuberi K, Badrawi R, Chao P. et al. The GeneMANIA prediction server: biological network integration for gene prioritization and predicting gene function. Nucleic acids research. 2010;38:W214-20
18. Mostafavi S, Ray D, Warde-Farley D, Grouios C, Morris Q. GeneMANIA: a real-time multiple association network integration algorithm for predicting gene function. Genome biology. 2008;9(Suppl 1):S4
19. von Mering C, Huynen M, Jaeggi D, Schmidt S, Bork P, Snel B. STRING: a database of predicted functional associations between proteins. Nucleic acids research. 2003;31:258-61
20. Szklarczyk D, Morris JH, Cook H, Kuhn M, Wyder S, Simonovic M. et al. The STRING database in 2017: quality-controlled protein-protein association networks, made broadly accessible. Nucleic acids research. 2017;45:D362-D8
21. Roessler S, Jia HL, Budhu A, Forgues M, Ye QH, Lee JS. et al. A unique metastasis gene signature enables prediction of tumor relapse in early-stage hepatocellular carcinoma patients. Cancer research. 2010;70:10202-12
22. Roessler S, Long EL, Budhu A, Chen Y, Zhao X, Ji J. et al. Integrative genomic identification of genes on 8p associated with hepatocellular carcinoma progression and patient survival. Gastroenterology. 2012;142:957-66 e12
23. Cancer Genome Atlas Research Network. Electronic address wbe, Cancer Genome Atlas Research N. Comprehensive and Integrative Genomic Characterization of Hepatocellular Carcinoma. Cell. 2017;169:1327-41 e23
24. Shaul YD, Yuan B, Thiru P, Nutter-Upham A, McCallum S, Lanzkron C. et al. MERAV: a tool for comparing gene expression across human tissues and cell types. Nucleic acids research. 2016;44:D560-6
25. Liao X, Huang K, Huang R, Liu X, Han C, Yu L. et al. Genome-scale analysis to identify prognostic markers in patients with early-stage pancreatic ductal adenocarcinoma after pancreaticoduodenectomy. OncoTargets and therapy. 2017;10:4493-506
26. Zhou M, Zhao H, Wang Z, Cheng L, Yang L, Shi H. et al. Identification and validation of potential prognostic lncRNA biomarkers for predicting survival in patients with multiple myeloma. Journal of experimental & clinical cancer research: CR. 2015;34:102
27. Liao X, Zhu G, Huang R, Yang C, Wang X, Huang K. et al. Identification of potential prognostic microRNA biomarkers for predicting survival in patients with hepatocellular carcinoma. Cancer management and research. 2018;10:787-803
28. Huang R, Liao X, Li Q. Identification and validation of potential prognostic gene biomarkers for predicting survival in patients with acute myeloid leukemia. OncoTargets and therapy. 2017;10:5243-54
29. Heagerty PJ, Zheng Y. Survival model predictive accuracy and ROC curves. Biometrics. 2005;61:92-105
30. Subramanian A, Tamayo P, Mootha VK, Mukherjee S, Ebert BL, Gillette MA. et al. Gene set enrichment analysis: a knowledge-based approach for interpreting genome-wide expression profiles. Proceedings of the National Academy of Sciences of the United States of America. 2005;102:15545-50
31. Mootha VK, Lindgren CM, Eriksson KF, Subramanian A, Sihag S, Lehar J. et al. PGC-1alpha-responsive genes involved in oxidative phosphorylation are coordinately downregulated in human diabetes. Nature genetics. 2003;34:267-73
32. Liberzon A, Birger C, Thorvaldsdottir H, Ghandi M, Mesirov JP, Tamayo P. The Molecular Signatures Database (MSigDB) hallmark gene set collection. Cell systems. 2015;1:417-25
33. Benjamini Y, Hochberg Y. Controlling the false discovery rate: a practical and powerful approach to multiple testing. Journal of the royal statistical society series b-statistical methodology. 1995;57:289-300
34. Reiner A, Yekutieli D, Benjamini Y. Identifying differentially expressed genes using false discovery rate controlling procedures. Bioinformatics. 2003;19:368-75
35. Benjamini Y, Drai D, Elmer G, Kafkafi N, Golani I. Controlling the false discovery rate in behavior genetics research. Behavioural brain research. 2001;125:279-84
36. Labib K, Tercero JA, Diffley JF. Uninterrupted MCM2-7 function required for DNA replication fork progression. Science. 2000;288:1643-7
37. Tye BK. MCM proteins in DNA replication. Annual review of biochemistry. 1999;68:649-86
38. Wang Y, Li Y, Zhang WY, Xia QJ, Li HG, Wang R. et al. mRNA expression of minichromosome maintenance 2 in colonic adenoma and adenocarcinoma. European journal of cancer prevention: the official journal of the European Cancer Prevention Organisation. 2009;18:40-5
39. Davies RJ, Freeman A, Morris LS, Bingham S, Dilworth S, Scott I. et al. Analysis of minichromosome maintenance proteins as a novel method for detection of colorectal cancer in stool. Lancet. 2002;359:1917-9
40. Saeb-Parsy K, Wilson A, Scarpini C, Corcoran M, Chilcott S, McKean M. et al. Diagnosis of bladder cancer by immunocytochemical detection of minichromosome maintenance protein-2 in cells retrieved from urine. British journal of cancer. 2012;107:1384-91
41. Mukherjee G, Muralidhar B, Bafna UD, Laskey RA, Coleman N. MCM immunocytochemistry as a first line cervical screening test in developing countries: a prospective cohort study in a regional cancer centre in India. British journal of cancer. 2007;96:1107-11
42. Rezazadeh F, Ebrahimi R, Andisheh-Tadbir A, Ashraf MJ, Khademi B. Evaluation of the Ki-67 and MCM3 Expression in Cytologic Smear of Oral Squamous Cell Carcinoma. Journal of dentistry. 2017;18:207-11
43. Stoeber K, Swinn R, Prevost AT, de Clive-Lowe P, Halsall I, Dilworth SM. et al. Diagnosis of genito-urinary tract cancer by detection of minichromosome maintenance 5 protein in urine sediments. Journal of the National Cancer Institute. 2002;94:1071-9
44. Keane MG, Huggett MT, Chapman MH, Johnson GJ, Webster GJ, Thorburn D. et al. Diagnosis of pancreaticobiliary malignancy by detection of minichromosome maintenance protein 5 in biliary brush cytology. British journal of cancer. 2017;116:349-55
45. Ayaru L, Stoeber K, Webster GJ, Hatfield AR, Wollenschlaeger A, Okoturo O. et al. Diagnosis of pancreaticobiliary malignancy by detection of minichromosome maintenance protein 5 in bile aspirates. British journal of cancer. 2008;98:1548-54
46. Yang JY, Li D, Zhang Y, Guan BX, Gao P, Zhou XC. et al. The Expression of MCM7 is a Useful Biomarker in the Early Diagnostic of Gastric Cancer. Pathology oncology research: POR. 2017
47. Kimura F, Kawamura J, Watanabe J, Kamoshida S, Kawai K, Okayasu I. et al. Significance of cell proliferation markers (Minichromosome maintenance protein 7, topoisomerase IIalpha and Ki-67) in cavital fluid cytology: can we differentiate reactive mesothelial cells from malignant cells? Diagnostic cytopathology. 2010;38:161-7
48. Kimura F, Okayasu I, Kakinuma H, Satoh Y, Kuwao S, Saegusa M. et al. Differential diagnosis of reactive mesothelial cells and malignant mesothelioma cells using the cell proliferation markers minichromosome maintenance protein 7, geminin, topoisomerase II alpha and Ki-67. Acta cytologica. 2013;57:384-90
49. Saydam O, Senol O, Schaaij-Visser TB, Pham TV, Piersma SR, Stemmer-Rachamimov AO. et al. Comparative protein profiling reveals minichromosome maintenance (MCM) proteins as novel potential tumor markers for meningiomas. Journal of proteome research. 2010;9:485-94
50. Liu M, Li JS, Tian DP, Huang B, Rosqvist S, Su M. MCM2 expression levels predict diagnosis and prognosis in gastric cardiac cancer. Histology and histopathology. 2013;28:481-92
51. Yang C, Wen Y, Li H, Zhang D, Zhang N, Shi X. et al. Overexpression of minichromosome maintenance 2 predicts poor prognosis in patients with gastric cancer. Oncology reports. 2012;27:135-42
52. Czyzewska J, Guzinska-Ustymowicz K, Pryczynicz A, Kemona A, Bandurski R. Immunohistochemical evaluation of Ki-67, PCNA and MCM2 proteins proliferation index (PI) in advanced gastric cancer. Folia histochemica et cytobiologica. 2009;47:289-96
53. Yang J, Ramnath N, Moysich KB, Asch HL, Swede H, Alrawi SJ. et al. Prognostic significance of MCM2, Ki-67 and gelsolin in non-small cell lung cancer. BMC cancer. 2006;6:203
54. Gakiopoulou H, Korkolopoulou P, Levidou G, Thymara I, Saetta A, Piperi C. et al. Minichromosome maintenance proteins 2 and 5 in non-benign epithelial ovarian tumours: relationship with cell cycle regulators and prognostic implications. British journal of cancer. 2007;97:1124-34
55. Korkolopoulou P, Givalos N, Saetta A, Goudopoulou A, Gakiopoulou H, Thymara I. et al. Minichromosome maintenance proteins 2 and 5 expression in muscle-invasive urothelial cancer: a multivariate survival study including proliferation markers and cell cycle regulators. Human pathology. 2005;36:899-907
56. Burger M, Denzinger S, Hartmann A, Wieland WF, Stoehr R, Obermann EC. Mcm2 predicts recurrence hazard in stage Ta/T1 bladder cancer more accurately than CK20, Ki67 and histological grade. British journal of cancer. 2007;96:1711-5
57. Soling A, Sackewitz M, Volkmar M, Schaarschmidt D, Jacob R, Holzhausen HJ. et al. Minichromosome maintenance protein 3 elicits a cancer-restricted immune response in patients with brain malignancies and is a strong independent predictor of survival in patients with anaplastic astrocytoma. Clinical cancer research: an official journal of the American Association for Cancer Research. 2005;11:249-58
58. Choy B, LaLonde A, Que J, Wu T, Zhou Z. MCM4 and MCM7, potential novel proliferation markers, significantly correlated with Ki-67, Bmi1, and cyclin E expression in esophageal adenocarcinoma, squamous cell carcinoma, and precancerous lesions. Human pathology. 2016;57:126-35
59. Wang D, Li Q, Li Y, Wang H. The role of MCM5 expression in cervical cancer: Correlation with progression and prognosis. Biomedicine & pharmacotherapy = Biomedecine & pharmacotherapie. 2017;98:165-72
60. Liu YZ, Wang BS, Jiang YY, Cao J, Hao JJ, Zhang Y. et al. MCMs expression in lung cancer: implication of prognostic significance. Journal of Cancer. 2017;8:3641-7
61. Vigouroux C, Casse JM, Battaglia-Hsu SF, Brochin L, Luc A, Paris C. et al. Methyl(R217)HuR and MCM6 are inversely correlated and are prognostic markers in non small cell lung carcinoma. Lung cancer. 2015;89:189-96
62. Helfenstein A, Frahm SO, Krams M, Drescher W, Parwaresch R, Hassenpflug J. Minichromosome maintenance protein (MCM6) in low-grade chondrosarcoma: distinction from enchondroma and identification of progressive tumors. American journal of clinical pathology. 2004;122:912-8
63. Schrader C, Janssen D, Klapper W, Siebmann JU, Meusers P, Brittinger G. et al. Minichromosome maintenance protein 6, a proliferation marker superior to Ki-67 and independent predictor of survival in patients with mantle cell lymphoma. British journal of cancer. 2005;93:939-45
64. Hotton J, Agopiantz M, Leroux A, Charra-Brunaud C, Marie B, Busby-Venner H. et al. Minichromosome maintenance complex component 6 (MCM6) expression correlates with histological grade and survival in endometrioid endometrial adenocarcinoma. Virchows Archiv: an international journal of pathology. 2017
65. Gauchotte G, Vigouroux C, Rech F, Battaglia-Hsu SF, Soudant M, Pinelli C. et al. Expression of minichromosome maintenance MCM6 protein in meningiomas is strongly correlated with histologic grade and clinical outcome. The American journal of surgical pathology. 2012;36:283-91
66. Liu YZ, Jiang YY, Hao JJ, Lu SS, Zhang TT, Shang L. et al. Prognostic significance of MCM7 expression in the bronchial brushings of patients with non-small cell lung cancer (NSCLC). Lung cancer. 2012;77:176-82
67. Toyokawa G, Masuda K, Daigo Y, Cho HS, Yoshimatsu M, Takawa M. et al. Minichromosome Maintenance Protein 7 is a potential therapeutic target in human cancer and a novel prognostic marker of non-small cell lung cancer. Molecular cancer. 2011;10:65
68. Ishibashi Y, Kinugasa T, Akagi Y, Ohchi T, Gotanda Y, Tanaka N. et al. Minichromosome maintenance protein 7 is a risk factor for recurrence in patients with Dukes C colorectal cancer. Anticancer research. 2014;34:4569-75
69. Nishihara K, Shomori K, Fujioka S, Tokuyasu N, Inaba A, Osaki M. et al. Minichromosome maintenance protein 7 in colorectal cancer: implication of prognostic significance. International journal of oncology. 2008;33:245-51
70. Tamura T, Shomori K, Haruki T, Nosaka K, Hamamoto Y, Shiomi T. et al. Minichromosome maintenance-7 and geminin are reliable prognostic markers in patients with oral squamous cell carcinoma: immunohistochemical study. Journal of oral pathology & medicine: official publication of the International Association of Oral Pathologists and the American Academy of Oral Pathology. 2010;39:328-34
71. Zhou YM, Zhang XF, Cao L, Li B, Sui CJ, Li YM. et al. MCM7 expression predicts post-operative prognosis for hepatocellular carcinoma. Liver international: official journal of the International Association for the Study of the Liver. 2012;32:1505-9
72. Karavias D, Maroulis I, Papadaki H, Gogos C, Kakkos S, Karavias D. et al. Overexpression of CDT1 Is a Predictor of Poor Survival in Patients with Hepatocellular Carcinoma. Journal of gastrointestinal surgery: official journal of the Society for Surgery of the Alimentary Tract. 2016;20:568-79
73. Qu K, Wang Z, Fan H, Li J, Liu J, Li P. et al. MCM7 promotes cancer progression through cyclin D1-dependent signaling and serves as a prognostic marker for patients with hepatocellular carcinoma. Cell death & disease. 2017;8:e2603
74. Zhong X, Chen X, Guan X, Zhang H, Ma Y, Zhang S. et al. Overexpression of G9a and MCM7 in oesophageal squamous cell carcinoma is associated with poor prognosis. Histopathology. 2015;66:192-200
75. Kang W, Tong JH, Chan AW, Cheng AS, Yu J, To K. MCM7 serves as a prognostic marker in diffuse-type gastric adenocarcinoma and siRNA-mediated knockdown suppresses its oncogenic function. Oncology reports. 2014;31:2071-8
76. Coli A, Asa SL, Fadda G, Scannone D, Chiloiro S, De Marinis L. et al. Minichromosome maintenance protein 7 as prognostic marker of tumor aggressiveness in pituitary adenoma patients. European journal of endocrinology. 2016;174:307-14
77. Winther TL, Torp SH. MCM7 expression is a promising predictor of recurrence in patients surgically resected for meningiomas. Journal of neuro-oncology. 2017;131:575-83
78. Feng CJ, Li HJ, Li JN, Lu YJ, Liao GQ. Expression of Mcm7 and Cdc6 in oral squamous cell carcinoma and precancerous lesions. Anticancer research. 2008;28:3763-9
79. Quaglia A, McStay M, Stoeber K, Loddo M, Caplin M, Fanshawe T. et al. Novel markers of cell kinetics to evaluate progression from cirrhosis to hepatocellular carcinoma. Liver international: official journal of the International Association for the Study of the Liver. 2006;26:424-32
80. Liu F, Yuan JH, Huang JF, Yang F, Wang TT, Ma JZ. et al. Long noncoding RNA FTX inhibits hepatocellular carcinoma proliferation and metastasis by binding MCM2 and miR-374a. Oncogene. 2016;35:5422-34
81. Sun M, Mo W, Fu X, Wu G, Huang Y, Tang R. et al. System biology analysis of cell cycle pathway involved in hepatocellular carcinoma. Front Biosci (Schol Ed). 2010;2:1127-44
82. Sun M, Wu G, Li Y, Fu X, Huang Y, Tang R. et al. Expression profile reveals novel prognostic biomarkers in hepatocellular carcinoma. Frontiers in bioscience. 2010;2:829-40
83. Nan YL, Hu YL, Liu ZK, Duan FF, Xu Y, Li S. et al. Relationships between cell cycle pathway gene polymorphisms and risk of hepatocellular carcinoma. World journal of gastroenterology. 2016;22:5558-67
84. Zheng T, Chen M, Han S, Zhang L, Bai Y, Fang X. et al. Plasma minichromosome maintenance complex component 6 is a novel biomarker for hepatocellular carcinoma patients. Hepatology research: the official journal of the Japan Society of Hepatology. 2014;44:1347-56
85. Zhang X, Teng Y, Yang F, Wang M, Hong X, Ye LG. et al. MCM2 is a therapeutic target of lovastatin in human non-small cell lung carcinomas. Oncology reports. 2015;33:2599-605
86. Abe S, Kurata M, Suzuki S, Yamamoto K, Aisaki K, Kanno J. et al. Minichromosome maintenance 2 bound with retroviral Gp70 is localized to cytoplasm and enhances DNA-damage-induced apoptosis. PloS one. 2012;7:e40129
87. Kodani I, Shomori K, Osaki M, Kuratate I, Ryoke K, Ito H. Expression of minichromosome maintenance 2 (MCM2), Ki-67, and cell-cycle-related molecules, and apoptosis in the normal-dysplasia-carcinoma sequence of the oral mucosa. Pathobiology: journal of immunopathology, molecular and cellular biology. 2001;69:150-8
88. Abe N, Matsuo K, Kumasaka T, Naka K, Hashimoto S, Takemura T. et al. Systematic cytological evaluation and immunocytochemistry of minichromosome maintenance protein 2 and p53 significantly improve cytological diagnosis of pancreaticobiliary adenocarcinoma. Journal of medical and dental sciences. 2016;63:19-27
Author contact
![]() Corresponding author: Prof. Tao Peng, Department of Hepatobiliary Surgery, The First Affiliated Hospital of Guangxi Medical University, Shuang Yong Road 6#, Nanning, 530021, Guangxi Zhuang Autonomous Region, People's Republic of China. E-mail: pengtaogmucom. Tel: (+86)-771-5356528. Fax: (+86)-771-5350031. ORCID ID: http://orcid.org/0000-0001-6133-7078.
Corresponding author: Prof. Tao Peng, Department of Hepatobiliary Surgery, The First Affiliated Hospital of Guangxi Medical University, Shuang Yong Road 6#, Nanning, 530021, Guangxi Zhuang Autonomous Region, People's Republic of China. E-mail: pengtaogmucom. Tel: (+86)-771-5356528. Fax: (+86)-771-5350031. ORCID ID: http://orcid.org/0000-0001-6133-7078.

 Global reach, higher impact