Impact Factor ISSN: 1837-9664

 Global reach, higher impact
J Cancer 2018; 9(14):2532-2542. doi:10.7150/jca.23535 This issue Cite
Research Paper
Association Analysis between Body Mass Index and Genomic DNA Methylation across 15 Major Cancer Types
Yinmin Gu1,2, Catherine Wei-Hong Zhang3, Liang Wang4, Yuhui Zhao4, Hui Wang5, Qinong Ye6 ![]() , Shan Gao2,7
, Shan Gao2,7 ![]()
1. University of Science and Technology of China, Hefei 230026, China.
2. CAS Key Laboratory of Bio-medical Diagnostics, Suzhou Institute of Biomedical Engineering and Technology, Chinese Academy of Sciences, Suzhou 215163, China.
3. ImmuFucell Biotechnology Co., Ltd., Beijing 100102, China.
4. CAS Key Laboratory of Pathogenic Microbiology and Immunology, Institute of Microbiology, Chinese Academy of Sciences, Beijing 100101, China.
5. Institute of Biomedical Engineering, Department of Engineering Science, University of Oxford, Oxford, United Kingdom.
6. Department of Medical Molecular Biology, Beijing Institute of Biotechnology, Beijing 100850, China.
7. Medical College, Guizhou University, Guiyang 550025, China.
Received 2017-10-28; Accepted 2018-5-1; Published 2018-6-22
Abstract
Cancer incidence and mortality increase with increasing body mass index (BMI), but BMI-associated epigenetic alterations in cancer remain elusive. We hypothesized that BMI would be associated with DNA methylation alterations in cancers. To test this hypothesis, here, we estimated the associations between DNA methylation and BMI through two different methods across 15 cancer types, at approximately 485,000 CpG sites and 2415 samples using data from The Cancer Genome Atlas. After comparing the DNA methylation levels in control BMI and high BMI individuals, we found differentially methylated CpG sites (DMSs) in cholangiocarcinoma (CHOL), colon adenocarcinoma (COAD), and uterine corpus endometrial carcinoma (UCEC) (False Discovery Rate < 0.05). The DMSs of COAD or UCEC were enriched in several obesity-induced and cancer-related pathways. Next, when BMI was used as a continuous variable, we identified BMI-associated methylated CpG sites (BMS) (P (Bonferroni) < 0.05) in CHOL (BMS = 1), COAD (BMS = 1), and UCEC (BMS = 4) using multivariable linear regression. In UCEC, three of the BMSs can predict the clinical outcomes and survival of patients with the tumors. Overall, we observed associations between DNA methylation and high BMI in CHOL, COAD, and UCEC. Furthermore, three BMI-associated CpGs were identified as potential biomarkers for UCEC prognosis.
Keywords: Association analysis, Body mass index, Cancer, DNA methylation, Epigenetics
Introduction
Body mass index (BMI) is the most widely used measurement of adiposity, which is an established risk factor for various diseases, including type 2 diabetes, cardiovascular disease, metabolic disturbances, and cancers 1-3. High BMI (25 kg/m2 or greater), including overweight and obesity, contribute to cancer incidence and death across a broad range of cancers 4,5. High BMI affects the majority of the adult population in most developed countries, and its prevalence is increasing rapidly in developing countries. If the current worldwide trends continue, the number of people with obesity will reach nearly 2.0 billion by 2025 6. In addition, the prevalence of cancer has increased in parallel with obesity 7. In the period between 1982 and 2012, a quarter of the cancer cases could be attributed to high BMI 8. Overall, high BMI is likely one of the drivers for the increasing incidences of cancer.
Numerous genome-wide association studies between single nucleotide polymorphisms (SNPs) and BMI have allowed for a better understanding of the biological basis of high BMI resulting in diseases 9,10. A study on pancreatic cancer found that the inflammatory NF-κB-mediated chemokine signaling pathway was associated with obesity, and contribute to a risk for pancreatic cancer 11. Another study revealed that 7 BMI-associated SNPs located in 8 obesity-related genes were significantly associated with a risk for endometrial cancer 12. Similarly, SNPs in genes known to be associated with metabolism and obesity are relevant to prostate cancer 13. These findings suggest that high BMI associated with multiple genes and can influence various biological pathways, thus contributing to the susceptibility of complex human cancers.
Further advances in genomic technologies have brought epigenome-wide association studies (EWAS) to focus on improving the understanding of epigenetic alterations that are associated with diseases 14. DNA methylation modulation, a well-known and critical regulation level of epigenetic machinery, is easily susceptible to environmental factors 15-17. Unlike stable and conserved genetic variants, epigenetic processes are highly dynamic during an individual's lifetime, which has attracted much attention to the study of DNA methylation 18. Increasing evidences for DNA methylation sites in relation to high BMI support the hypothesis that altered DNA methylation of metabolically important genes are mediated by adiposity in human blood 3,19,20. Moreover, alterations in DNA methylation are consequences of adiposity rather than the trigger 3.
Changes in DNA methylation can indeed be implicated in the initiation and progression of neoplasm 21. Sirtuin 1, a gene related to epigenetic silencing, links obesity to cancer, and also plays a role in colorectal cancer development, suggesting that obesity-related epigenetic changes may be an important determinant in colorectal cancer 22. DNA methylation patterns that link high BMI to cancer development appear to be predictable, however, they are not well understood. Furthermore, a previous study that analyzed 345 breast tumor samples has also shown an association between BMI and DNA methylation in tumor tissues 23. The publicly available Cancer Genome Atlas (TCGA) has provided large-scale genome sequencing data alongside clinical features for over 30 human tumors, which allows researchers to systematically study possible interactions between epigenetic changes induced by high BMI and cancer risk 24. In this study, we examined genome-wide DNA methylation profiles in tumor tissues to investigate whether BMI levels change and whether these changes were associated with a high BMI. Understanding the epigenetic molecular links may provide an avenue for diagnostic and therapeutic strategies.
Materials and Methods
The data from The Cancer Genome Atlas
We downloaded patients' clinical information from the Broad GDAC Firehose (http://gdac.broadinstitute.org/) and selected 15 types of cancers with the patients' weight and height information at diagnosis to estimate individual BMI values as weight in kilograms divided by the square of height in meters. These cancers include bladder urothelial carcinoma (BLCA), cervical squamous cell carcinoma and endocervical adenocarcinoma (CESC), cholangiocarcinoma (CHOL), colon adenocarcinoma (COAD), lymphoid neoplasm diffuse large B-cell lymphoma (DLBC), esophageal adenocarcinoma (EAC), esophageal squamous cell carcinoma (ESCC), kidney renal papillary cell carcinoma (KIRP), liver hepatocellular carcinoma (LIHC), rectum adenocarcinoma (READ), skin cutaneous melanoma (SKCM), thymoma (THYM), uterine corpus endometrial carcinoma (UCEC), uterine carcinosarcoma (UCS), and uveal Melanoma (UVM). Patients without definitive information of age or race were excluded. The Human methylation450 BeadChip datasets (level three) 25 were also downloaded from the Broad GDAC Firehose.
Identification of CpG probes associated with BMI
For adults, BMI was classified according to World Health Organization (WHO) definitions as underweight (BMI < 18.5), normal weight (18.5 ≤ BMI < 25), overweight (25 ≤ BMI < 30), and obese (BMI ≥ 30). In the initial analysis, BMI was used as a categorical variable by dividing the samples into two groups: control BMI subjects (BMI < 25) and high BMI subjects (25 ≥ BMI). Since the four clinical indicators, including age, gender, race and tissue source site, were all provided in the 15 cancers, and three (age, gender and race) of them had been reported to be associated with BMI and DNA methylation 26-29, we included the four variables into linear models. After adjusting for age, gender, race, and tissue source site, differentially methylated CpG probes between two groups were identified using the linear models for microarray data (limma) package (default), which uses linear models to assess differential methylation, whereby information is shared across probes 30. Differentially methylated CpG sites (DMSs) were identified if the resulting adjusted P-value was < 0.05. The Benjamini-Hochberg method 31 was used to adjust the P-values and ensure that the False Discovery Rate (FDR) was < 0.05. In the second analysis, BMI was not normally distributed in any cancers and therefore was transformed by rank normalization, which was performed using the rntransform function in the R GenABEL package 32. The Lillie test in nortest package, a modification of the Kolmogorov-Smirnov test, was used to determine whether the data were normally distributed. Multivariable linear regression of normalize-transformed BMI with methylation level at each CpG probe was adjusted for gender, age, race, and tissue source site.
Pathway enrichment analysis
To evaluate the functional relevance of DMSs, a The Kyoto Encyclopedia of Genes and Genomes (KEGG) pathway enrichment analysis for genes involved in DMSs was performed using the Database for Annotation, Visualization and Integrated Discovery (DAVID) software 33. The significant enrichment pathways were identified with P < 0.05.
Statistical analysis
Statistical analyses were performed using the R software. The survival difference between patient groups was analyzed using the Kaplan-Meier and log-rank test function in survival package. The methylation level was compared between two groups by the Wilcoxon rank test. Over- or under-representation of the CpGs were determined using the chi-square test. P values less than 0.05 were considered statistically significant.
Results
The characteristics of the TCGA samples analyzed
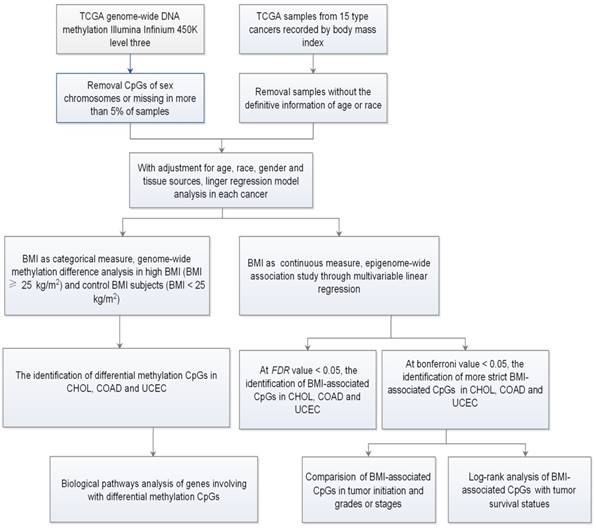
To characterize the specific genome-wide DNA methylation profile that is associated with BMI in cancers, we chose 15 publically available cancer datasets from TCGA (Table 1 and Table S1). Totally, there are 2415 samples including 883 control BMI samples and 1532 high BMI samples. The average age ranged from 48.4 to 69.6 years old, and the average BMI ranged from 22.6 to 34.4 kg/m2. After adjusting for age, race, gender, and tissue source site, we firstly treated BMI as a categorical measure, and performed DMSs analyses between high and control BMIs for each cancer through limma package. Secondly, we treated BMI as a continuous measure, and identified BMI-associated methylated sites (BMSs) using the multivariable linear regression models (Fig. 1).
The characteristics of eligible TCGA samples
| Cancer types | Age (years) | Races | Gender (% male) | BMI (kg/m2) | No. Control BMI | No. High BMI |
|---|---|---|---|---|---|---|
| BLCA | 67.8 (10.5) | a(284); b(43); c(18) | 75% | 27.1 (6.3) | 142 | 203 |
| CESC | 48.4 (13.5) | a(189);b(19); c(23); d(7); e(1) | 0% | 28.4 (7.8) | 89 | 150 |
| CHOL | 63.4 (12.8) | a(30);b(3); c(2) | 45.7% | 28.0 (5.3) | 10 | 25 |
| COAD | 64.4 (13.1) | a(164);b(8); c(51);d(1) | 54% | 29.4 (17.4) | 75 | 149 |
| DLBC | 56.3 (13.9) | a(29);b(18); c(1) | 45.8% | 25.9 (5.9) | 25 | 23 |
| ESCC | 58.7 (10.5) | a(41);b(44); c(3) | 85.2% | 22.6 (3.4) | 70 | 18 |
| EAC | 66.6 (11.8) | a(66);b(1) | 88.1% | 28.6 (6.4) | 16 | 51 |
| KIRP | 61.7 (12.0) | a(152);b(4); c(39);d(1) | 74.5% | 32.1 (32.8) | 47 | 149 |
| LIHC | 59.1 (12.9) | a(159);b(157) c(14);d(1) | 68.6% | 26.1 (8.5) | 175 | 156 |
| READ | 61.1 (11.5) | a(62);c(5) | 59.7% | 27.2 (5.8) | 18 | 49 |
| SKCM | 59.4 (15.3) | a(227);b(11); c(1) | 59.0% | 28.0 (6.1) | 79 | 160 |
| THYM | 58.8 (12.9) | a(83);b(12); c(3) | 52.0% | 27.2 (6.03) | 38 | 60 |
| UCEC | 64.0 (11.0) | a(275);b(87); c(8);d(2);e(7) | 0% | 34.4 (13.0) | 65 | 314 |
| UCS | 69.6 (9.22) | a(40);b(3); c(8) | 0% | 29.6 (9.03) | 17 | 34 |
| UVM | 61.3 (13.7) | a(53) | 52.8% | 28.7 (8.9) | 17 | 36 |
Abbreviations: a, White; b, Asian; c, Black or African American; d, American indian or Alaska native; e, Native hawaiian or other pacific islander. For age and BMI, data are mean (Standard Error). For race, data are race names (number).
Flow chart indicating study design.
Genome-wide methylation differences in high and control BMI
High BMI has an increased risk for cancers 34. To gain insight into the association between high BMI and DNA methylation, we used 25 kg/m2 as a cutoff threshold to divide high BMI and control cases (Table 1). We separately examined DNA methylation levels between the two groups across the 15 types of cancers. In COAD, the average global DNA methylation levels in high BMI cases (β value = 0.46) were significantly lower than the control cases (β value = 0.47) (P = 0.0024). None of other cancers displayed a statistical significance (Fig. 2a). Using limma method and a FDR value of < 0.05 as the significance cut-off value for downstream analyses, we identified 3, 1169, and 394 DMSs in CHOL, COAD (Table S2), and UCEC (Table S3), respectively. There were no DMSs in the other 12 cancers. 3 DMSs in CHOL included cg26987376 that was located at an intergenic region, cg21515384 that was located at 200 bp upstream of the transcription start site (TSS200) of the 3-oxoacid CoA-transferase 1 (OXCT1), and cg02725055 that was located at 1500 bp upstream of the transcriptional start site (TSS1500) of the transcription factor 4 (TCF4). Furthermore, OXCT1 plays important roles in ketone and fatty acid metabolism 35. TCF4 (also known as TCF7L2) is also identified to be a possible determinant of type 2 diabetes mellitus and is a transcription factor of the Wnt signaling pathway, which also plays a crucial role in insulin secretion and proglucagon gene expression 36,37.
Analysis of differences in genomic DNA methylation levels in cases of high body mass index (BMI) and controls. (A) The differences in genomic DNA methylation levels in 15 cancer types. (B) Volcano plot showing the distribution of CpG sites from the site-level test assessed by methylation differences and FDR values. CpGs in blue indicate a FDR < 0.05. (C) Significant differences in the genomic distributions of the differentially methylated CpGs regarding the CpG context and the gene region, compared with all analyzed sites on the Infinium HumanMethylation450 BeadChip, by chi-square test. (* p < 0.05; ** p < 0.01; *** p < 0.001; N_Shelf, North Shelf; S_Shelf, South Shelf; N_Shore, North Shore; S_ Shore, South Shore).
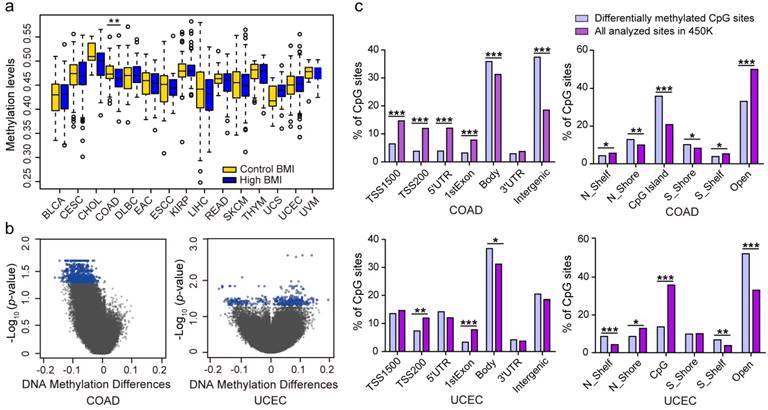
Among the 1169 DMSs identified in COAD, 1168 DMSs exhibited low methylation levels, and a single DMS exhibited high methylation level in patients with high BMIs (Fig. 2b). Compared to all of the analyzed sites, the DMSs were underrepresented in the promoter regions, including the TSS1500, TSS200, 5' untranslated regions (5' UTR), and 1st exons, but were overrepresented in the gene body and intergenic regions (Fig. 2c). Regarding the CpG context, the 1169 DMSs were significantly overrepresented in the CpG islands and DNA regions within 2 kb of the CpG islands (North Shore and South Shore). Additionally, the genomic regions outside the CpG islands and their 2 kb flanking regions were underrepresented. The 394 DMSs identified in samples of high BMI in UCEC consisted of 128 hypomethylated CpGs and 266 hypermethylated CpGs. These DMSs were significantly overrepresented in the gene body regions and underrepresented in the TSS200 and 1st exons. Regarding the CpG context, the DNA regions 2 kb outside of the CpG islands were overrepresented and the North Shore and CpG island regions were observed to be underrepresented (Fig. 2c), suggesting that altered methylated regions for high BMI are clearly tumor- or tissue-specific.
Biological pathways analysis
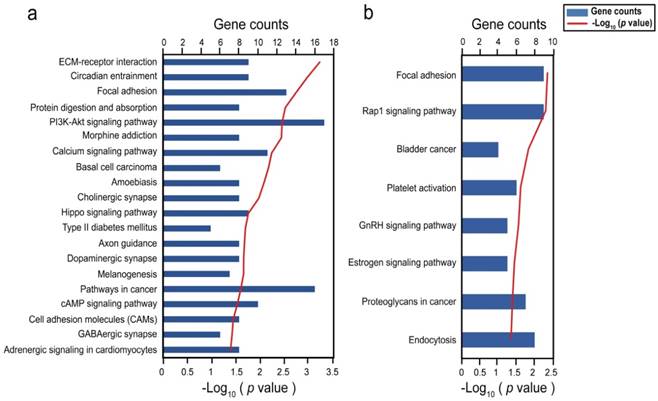
To understand the functions of DMSs-containing genes, we performed a functional enrichment analysis using the DAVID software 33. In COAD, 1168 DMSs corresponded to 449 unique genes. KEGG pathway analysis provided significant enrichment in 20 pathways (P < 0.05), including numerous biological processes pertinent to cancer, such as the phosphatidylinositol 3-kinase (PI3K)/Akt and hippo signaling pathways (Fig. 3a). Interestingly, type II diabetes mellitus which has been reported to be associated with an excess risk of colorectal cancer 38, was also included. Tenascin XB, encoding a member of the tenascin family of extracellular matrix (ECM) glycoproteins 39, had 23 CpGs with high methylation and was involved in pathways of PI3K-Akt signaling, focal adhesion, and ECM-receptor interaction. Collagen type genes of the three pathways were also subject to methylation in certain CpGs. It is clear that the ECM plays an important role in adipocyte development and function and as such in lipid metabolism, weight regulation, and obesity 39. 116 DMSs enriched in pathways mostly located at the gene body regions of their genes (Table S4). We did not identify any significant correlation between these DMSs and their genes in COAD, probably due to that there were 19 overlapping samples between transcriptome and methylome. In UCEC, 394 DMSs corresponded to 253 unique genes, which were involved in focal adhesion, rap 1 signaling pathway, bladder cancer, platelet activation, GnRH signaling pathway, estrogen signaling pathway, proteoglycans in cancer, and endocytosis (P < 0.05) (Fig. 3b). Nearly all of these pathways included the epidermal growth factor receptor (EGFR), SRC proto-oncogene, and non-receptor tyrosine kinase, were reported to be drivers of tumorigenesis 40,41. 31 DMSs enriched in pathways mostly located at the gene body regions of their genes (Table S5). Among them, 4 DMSs (cg01222719, cg17307474, cg22187246, cg11209289) in gene body regions and 4 DMSs (cg00130530, cg23410129, cg12726213, cg26033529) in promoter regions, were negatively correlated with their corresponding genes (Table S5).
Bar graph showing significant KEGG pathways of genes involving with differentially methylated CpGs. (A) Biological pathways in COAD; (B) Biological pathways in UCEC.
Epigenome-wide association study through multivariable linear regression model
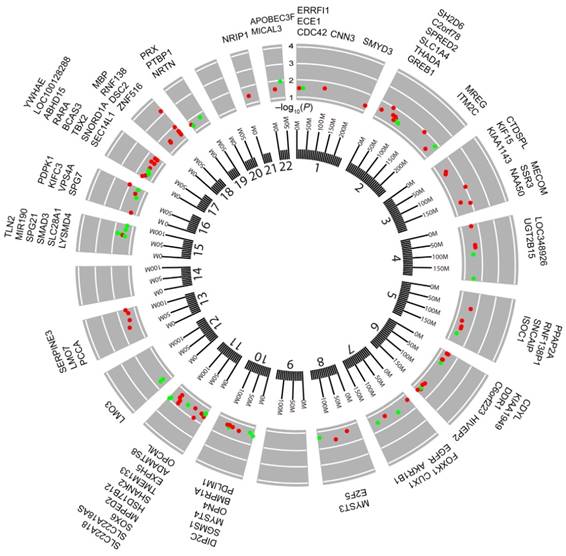
Next, to investigate whether or not there was a correlation between BMI and DNA methylation in cancers, BMI was used as a continuous measure, and EWASs were performed between CpG sites and BMI using FDR < 0.05 as the cutoff threshold. We identified 1 BMS in CHOL and COAD, respectively, whereas we found 113 BMSs in UCEC (Table S6). However, we were unable to identify any significant BMSs in the other 12 cancers that were investigated. The identified BMSs included cg04545963 (β = 0.680, FDR = 0.024) located in NF-κB inhibitor alpha (NFKBIA) in CHOL and cg15542880 (β = -0.082, FDR = 0.020) located in dual serine/threonine and tyrosine protein kinase (DSTYK) in COAD. Moreover, the identified 113 BMSs in UCEC were annotated to 84 unique genes, and approximately 32% of the BMSs showed a positive correlation to BMI (Table S6). The genomic location revealed that 113 BMSs were distributed among 19 chromosomes except for chromosomes 9, 14, and 20 (Fig. 4). Some BMSs were located at genes involved with metabolically relevant events. For example, UDP glucuronosyltransferase family 2 member B15 (UGT2B15) was known as a member of the UDP-glucuronosyltransferases superfamily catalyzing the conjugation of various lipid-soluble endogenous substances and xenobiotics with the glucuronic acid moiety UDP-glucuronic acid 42. SRY-box 6 (SOX6), a transcription factor, has been linked to the regulation of the expressions of key adipogenic regulators as well as synergy with epigenetic pathways involving mesoderm-specific transcript genes that are associated with adipocyte size 43. Meanwhile, a SNP in SOX6 gene, rs297325, located 0.22 Mb downstream of cg21992400 (β = -0.088, FDR < 0.05), has been identified to associate with the risk of both BMI and endometrial cancer 12. Among the 84 genes, tumor-related genes were also found, such as T-box 2 44, discoidin domain receptor tyrosine kinase 1 45, and lysine acetyltransferase 6A 46. These results further supported the findings that BMI is associated with DNA methylation profiles in CHOL, COAD, and UCEC.
Circos plot of the epigenome-wide association of DNA methylation in UCEC with body mass index (BMI). Results are presented as CpG-specific association test results (-log10 (FDR)) ordered by genomic position. Green symbols, CpGs positively associated with BMI; Red symbols, CpGs negatively associated with BMI; Chromosome numbers are shown on the inner ring. Tick marks on the outer ring identify the genomic locis reaching epigenome-wide significance. The genes located by the 113 locis are listed around the circos plot.
BMSs in UCEC implicated to tumor progression and patient survival
Using the more stringent Bonferroni correction for multiple testing (Bonferroni-corrected P < 0.05) in the analyses of multivariable linear regression models, cg04545963 in CHOL and cg15542880 in COAD were still significantly associated with BMI. However, in UCEC, the number of significant BMSs was markedly reduced, and only 4 BMSs remained, including cg12645852 (β = -0.107, Bonferroni-corrected P = 5.85E-04) located in an intergenic region, cg09621472 (β = -0.107, Bonferroni-corrected P = 0.018) located in NatE catalytic subunit of N (alpha)-acetyltransferase 50 (NAA50), cg27131667 (β = -0.198, Bonferroni-corrected P = 0.028) located in spastic paraplegia 7 (SPG7), and cg14044785 (β = -0.116, Bonferroni-corrected P = 0.041) located in thyroid adenoma associated (THADA). Of these 4 BMSs, cg12645852, cg09621472, and cg14044785 in patients with high BMI in UCEC had significant hypomethylation when compared to controls.
BMI is a prognostic factor in patients with cancer. Bladder cancer and colorectal cancer show lower mortality in patients with higher BMI values 47. However, the increase of BMI at an older age is associated with a lower overall survival time in patients with pancreatic cancer 48. To explore whether BMS can also predict tumor survival outcome, based on these stringent BMSs, we therefore respectively categorized the study cases into low and high levels according to the median of methylation levels of these 6 BMSs and subsequently performed Kaplan-Meier and Log-rank test. With regards to methylation status, cg04545963 in CHOL, cg15542880 in COAD, and cg12645852 in UCEC did not significantly affect the patient survival rates (Fig. 5a). For cg09621472, cg27131667, cg14044785, patients with UCEC with low methylated levels had improved survival rates when compared with those who had high methylated levels (P = 0.0008, 0.0248, 0.0109, respectively, Fig. 5a), suggesting that cg09621472, cg27131667, and cg14044785 could be used as potential biomarkers for predicting survival outcomes of patients with UCEC.
Analysis of body mass index (BMI)-associated CpGs during the survival initiation, stage, and progression of CHOL, COAD, and UCEC. (A) Kaplan-Meier survival analysis. The patients were divided into low and high groups using the median cutoff value of DNA methylated levels for the 6 BMI-associated CpGs, respectively. HR, hazard ratio. (B) The methylation levels of BMI-associated CpGs in the initiation and progression of the three cancers (* p < 0.05, ** p < 0.01, *** p < 0.001, no represents statistically insignificant).
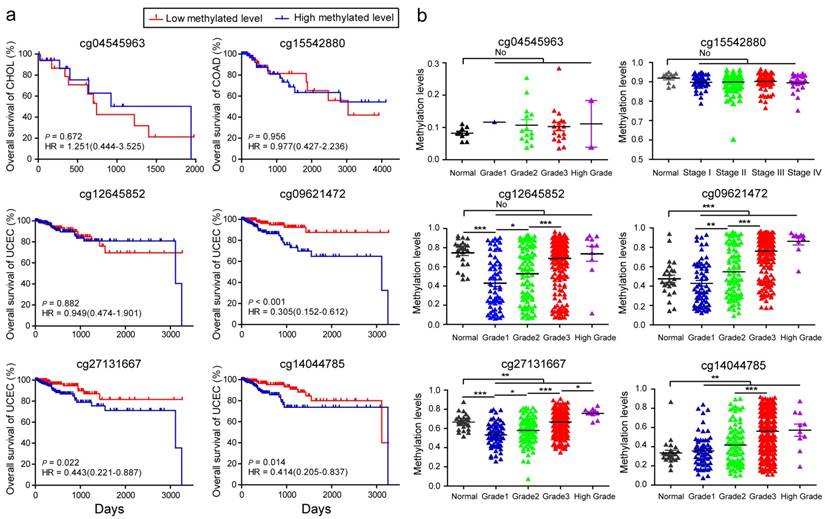
Furthermore, analyses were performed to investigate whether these BMSs had implications in tumor initiation and progression. The methylation status of cg04545963 was not significantly associated with the initiation and grade of CHOL, and neither was cg15542880 in COAD (Fig. 5b). We found that, in adjacent tissue, the methylation levels of cg12645852 and cg27131667 were significantly higher than tumor tissue of the early stages (grade 1) from UCEC. However, for cg09621472, cg27131667, and cg14044785, the methylation levels in adjacent tissues were lower than those of tumor tissues (Fig. 5b). Interestingly, with advancing tumor grade, the methylation levels of the 4 BMSs in UCEC significantly increased and displayed the most notable increase from grade 2 to grade 3 (all P < 0.0001, the different β values between the two grades are 0.1598, 0.2135, 0.0883, 0.1447, respectively). Furthermore, their high methylation levels were also associated with other advanced clinical tumor parameters, including tumor invasion percentage, clinical stage, and histologic diagnosis type (Table S7). The dataset of GSE67116 49 from the GEO database showed higher methylation levels of cg09621472 (P < 0.001) and cg27131667 (P = 0.014) in 33 patients with endometrial metastasis cancer relative to 53 patients with endometrial primary cancer. These data suggested that cg12645852, cg09621472, cg27131667, and cg14044785 may be associated with the effect of BMI on UCEC advancement.
Discussions
In this study, we characterized the genome-wide DNA methylation profiles associated with BMI in 15 cancer types by modeling BMI first as a categorical variable and then as a continuous variable. The two analyses consistently showed that the dynamic features of DNA methylation in the three known obesity-related cancers (CHOL, COAD, and UCEC) 50,51 associated with BMI, but not in the other 12 major cancers.
The observed hypomethylation patterns in COAD with high BMI is predominant, indicating that high BMI cases with COAD may regulate gene expression through the attenuation of DNA methylation. These genes containing DMSs play roles in the pathogenesis of colorectal cancer (e.g. DCC netrin 1 receptor; netrin 1; Wnt family member 3A; Wnt family member 5A; receptor tyrosine kinase like orphan receptor 2; RAR related orphan receptor A) 52-57. Most genes with DMSs enrichment were in the PI3K-AKT signaling pathway, an intercellular signaling pathway responsible for carcinogenesis and metastasis of many cancers 58. This finding is consistent with a previous report showing that the PI3K-AKT signaling pathway links obesity risk factors and colon carcinogenesis processes 59. In obesity cases, increased levels of blood insulin, insulin-like growth factor I, leptin, tumor necrosis factor, and interleukin 6, and decreased levels of adiponectin activate the PI3K-AKT signal pathway, further activating downstream signals for cell survival, cell growth and cell cycle, and ultimately resulting in cancer development. Alterations in DNA methylation also respond to adiposity 3, therefore, in COAD, high BMI inhibits methylation of PI3K-AKT signaling pathway genes, which in turn may activate the pathway and the development of COAD. Another noteworthy pathway is that for type II diabetes. Adipose tissue of obesity cases releases various factors, such as non-esterified fatty acids and pro-inflammatory cytokines, which could contribute to development of insulin resistance and perturb β-cell function, thus resulting in type II diabetes 2. This disease plays an important role in the pathogenesis of colon adenocarcinoma. Moreover, epidemiologic studies were directed at providing a consistent association and several shared genetic factors between type II diabetes and subsequent risk of colon cancer 38,60,61. We identified, in patients with COAD and high BMI, significant hypomethylation of type II diabetes pathway genes, thus supporting the possibility that an alteration in this pathway may result in the induction of DNA methylation, and that a high BMI may have an important role in some of the downstream effects of COAD development. Even though the other 18 biological pathways in COAD linking obesity to cancer have not been reported, these pathways allow us to examine whether DNA methylation alterations due to high BMI have effects on colon cancer, particularly in case of cancer-related pathways such as the Hippo signaling pathway and cAMP signaling pathway and in ECM-receptor interaction. High BMI cases in UCEC also present methylation differences in comparison with controls. Some DMSs were located at genes involved in the development of UCEC (e.g. EGFR; kinase suppressor of ras 1; metastasis associated 1; syndecan 1; secreted protein acidic and cysteine rich) 62-66. Increased platelet activity is mainly related to reactive oxygen species and inflammation adipokines as well as a reduced sensitivity to insulin 67. Obesity drives adipose inflammation, leading to induction of aromatase and increased estrogen signaling in adipose depots 68. These results indicated that high BMI may contributes to modulation of two pathways involved in platelet activation and estrogen signaling as a result of DNA methylation in UCEC. These pathways could provide guidance for further understanding the effects of high BMI on the development of cancer.
When BMI was used as a continuous measure in the EWAS with a strict Bonferroni correction (P < 0.05), methylation alterations were identified in the genes including NFKBIA, DSTYK, NAA50, SPG7, and THADA. These genes are highly associated with human disease susceptibility 69-81, but associations of DNA methylation among them have not been reported. Additionally, BMI-associated CpGs located in NAA50, SPG7, and THADA among UCEC tumor tissues are significantly associated with the survival time and tumor progression of this cancer, indicating that BMI may encourage the role of tumor mechanism through controlling DNA methylation. Intensive epigenetic studies have demonstrated a causal relationship between high BMI or obesity and altered epigenetic regulation in a great deal of metabolically important genes or regions 3,19,20,82. Although results of this study reveal that there are no major changes in metabolic processes, the discordance may be interpreted by tissue heterogeneity and tissue-specific patterns of DNA methylation. This deduction is consistent with previous reports showing that DNA methylation in HIF3A was associated with BMI in white blood cells and adipose tissue, but not in breast tumor tissue 20,23,83. Furthermore, most studies have previously focused on blood or adipose tissue that are metabolically active; however, this cannot be used to reflect epigenetic patterns of other tissues. In another study using breast tumor tissue, obesity was shown to influence the methylation of some cancer-relevant genes and pathways involved in carcinogenesis 23. The use of human primary tumor tissues in our study from 15 tumor types exclusive of the breast cancer significantly revealed new information. Thus, we demonstrated that high BMI may induce metabolic perturbations, leading to alterations in DNA methylation in cancer development-related and obesity-induced pathways in primary tumor tissues of CHOL, COAD, and UCEC.
Excluding the overweight group, we also analyzed the methylation differences between obese and control BMI of cancer patients (Table S8). The result suggested that the cutoff values of BMI influence the methylation differences. Removal of the overweight group resulted in detections of DMSs (Table S8). TCGA dataset is heterogeneous and lack of unified information parameters (e.g., the history of smoking and drinking, etc.) in the subjects examined. This may be the reason why BMI-associated methylation patterns were not determined in the other 12 tumors. We further analyzed regression association analysis between BMI and DNA methylation in adjacent tissues from CHOL, COAD, UCEC, but failed to identify any significant BMSs. Further investigations may be needed when more samples become available in the future. In addition, DMS outcomes might be inadequately estimated in gene expression because the number of the overlapping samples between transcriptome and methylome was low. BMI grouping is possible and it can minimize the possible bias due to an underestimation of weight. However, BMI grouping obscures detection of possible correlations at within-group level. Instead, the BMI is a continuous variable in TCGA dataset, allowing the identifications of significant CpGs with the considerations of common confounders (age, gender, race, tissue source site) via multiple linear regression. With larger datasets in the future, improvement may be made on specifying how independent variables are entered into a given linear regression modeling. More sophisticated models may be deployed to improve the analytical power too, because possibilities of lacking normal and/or random distributions of independent variables, as well as the linear validity between independent variables and BMI could reduce the statistical power of the linear regression model. Therefore, these BMI-associated methylation pattern still need to be validated by a large-scale clinical samples.
Collectively, we systemically analyzed the association of BMI with genomic DNA methylation in tumor tissues. This study supports the view that changes in DNA methylation represent an intermediate step between the BMI and CHOL, COAD, or UCEC, which may in turn provide information for guiding treatment options for patients with CHOL, COAD, and UCEC with high BMIs.
Acknowledgements
This work was supported by grants from National Natural Science Foundation of China (81472827 and 81773023), the National Key R&D Program of China (2016YFC1302100), Hundred-Talent Program and Frontier Research Program (QYZDB-SSW-SMC038) of Chinese Academy of Sciences. We would like to thank The Cancer Genome Atlas pilot project.
Supplementary Material
Supplementary table S1.
Supplementary table S2.
Supplementary table S3.
Supplementary table S4.
Supplementary table S5.
Supplementary table S6.
Supplementary table S7.
Supplementary table S8.
Competing Interests
The authors have declared that no competing interest exists.
References
1. Wang YC, McPherson K, Marsh T. et al. Health and economic burden of the projected obesity trends in the USA and the UK. Lancet. 2011;378:815-25
2. Kahn SE, Hull RL, Utzschneider KM. Mechanisms linking obesity to insulin resistance and type 2 diabetes. Nature. 2006;444:840-6
3. Wahl S, Drong A, Lehne B. et al. Epigenome-wide association study of body mass index, and the adverse outcomes of adiposity. Nature. 2017;541:81-6
4. Calle EE, Rodriguez C, Walker-Thurmond K. et al. Overweight, obesity, and mortality from cancer in a prospectively studied cohort of U.S. adults. N Engl J Med. 2003;348:1625-38
5. Calle EE, Kaaks R. Overweight, obesity and cancer: epidemiological evidence and proposed mechanisms. Nat Rev Cancer. 2004;4:579-91
6. NCD Risk Factor Collaboration (NCD-RisC). Trends in adult body-mass index in 200 countries from 1975 to 2014: a pooled analysis of 1698 population-based measurement studies with 19.2 million participants. Lancet. 2016;387:1377-96
7. Flegal KM, Carroll MD, Ogden CL. et al. Prevalence and trends in obesity among US adults, 1999-2008. JAMA. 2010;303:235-41
8. Arnold M, Pandeya N, Byrnes G. et al. Global burden of cancer attributable to high body-mass index in 2012: a population-based study. Lancet Oncol. 2015;16:36-46
9. Speliotes EK, Willer CJ, Berndt SI. et al. Association analyses of 249,796 individuals reveal 18 new loci associated with body mass index. Nat Genet. 2010;42:937-48
10. Willer CJ, Speliotes EK, Loos RJF. et al. Six new loci associated with body mass index highlight a neuronal influence on body weight regulation. Nat Genet. 2009;41:25-34
11. Tang H, Wei P, Duell EJ. et al. Genes-environment interactions in obesity- and diabetes-associated pancreatic cancer: a GWAS data analysis. Cancer Epidemiol Biomarkers Prev. 2014;23:98-106
12. Delahanty RJ, Beeghly-Fadiel A, Xiang Y-B. et al. Association of obesity-related genetic variants with endometrial cancer risk: a report from the Shanghai Endometrial Cancer Genetics Study. Am J Epidemiol. 2011;174:1115-26
13. Edwards TL, Giri A, Motley S. et al. Pleiotropy between genetic markers of obesity and risk of prostate cancer. Cancer Epidemiol Biomarkers Prev. 2013;22:1538-46
14. Rakyan VK, Down TA, Balding DJ. et al. Epigenome-wide association studies for common human diseases. Nat Rev Genet. 2011;12:529-41
15. Portela A, Esteller M. Epigenetic modifications and human disease. Nat Biotech. 2010;28:1057-68
16. Lienert F, Wirbelauer C, Som I. et al. Identification of genetic elements that autonomously determine DNA methylation states. Nat Genet. 2011;43:1091-7
17. Feil R, Fraga MF. Epigenetics and the environment: emerging patterns and implications. Nat Rev Genet. 2012;13:97-109
18. Mill J, Petronis A. Molecular studies of major depressive disorder: the epigenetic perspective. Mol Psychiatry. 2007;12:799-814
19. Crujeiras AB, Diaz-Lagares A, Sandoval J. et al. DNA methylation map in circulating leukocytes mirrors subcutaneous adipose tissue methylation pattern: a genome-wide analysis from non-obese and obese patients. Sci Rep. 2017;7:41903
20. Dick KJ, Nelson CP, Tsaprouni L. et al. DNA methylation and body-mass index: a genome-wide analysis. Lancet. 2014;383:1990-8
21. Nephew KP, Huang TH-M. Epigenetic gene silencing in cancer initiation and progression. Cancer Lett. 2003;190:125-33
22. Nosho K, Shima K, Irahara N. et al. SIRT1 histone deacetylase expression is associated with microsatellite instability and CpG island methylator phenotype in colorectal cancer. Mod Pathol. 2009;22:922-32
23. Hair BY, Troester MA, Edmiston SN. et al. Body mass index is associated with gene methylation in estrogen receptor-positive breast tumors. Cancer Epidemiol Biomarkers Prev. 2015;24:580-6
24. Cline MS, Craft B, Swatloski T. et al. Exploring TCGA Pan-Cancer data at the UCSC Cancer Genomics Browser. Sci Rep. 2013;3:2652
25. Yang X, Gao L, Zhang S. Comparative pan-cancer DNA methylation analysis reveals cancer common and specific patterns. Brief Bioinform. 2016 doi: 10.1093/bib/bbw063
26. Jackson A S, Stanforth P R, Gagnon J. et al. The effect of sex, age and race on estimating percentage body fat from body mass index: The Heritage Family Study. Int J Obesity. 2002;26:789
27. Richardson B. Impact of aging on DNA methylation. Ageing Res Rev. 2003;2:245-261
28. Vaissière T, Hung R J, Zaridze D. et al. Quantitative analysis of DNA methylation profiles in lung cancer identifies aberrant DNA methylation of specific genes and its association with gender and cancer risk factors. Cancer Res. 2009;69:243-252
29. Piyathilake C J, Henao O, Frost A R. et al. Race-and age-dependent alterations in global methylation of DNA in squamous cell carcinoma of the lung (United States). Cancer Cause Control. 2003;14:37-42
30. Smyth GK. Linear models and empirical bayes methods for assessing differential expression in microarray experiments. Stat Appl Genet Mol Biol. 2004;3:Article3
31. Benjamini Y, Hochberg Y. Controlling The False Discovery Rate - A Practical And Powerful Approach To Multiple Testing. J R Stat Soc. 1995;57:289-300
32. Aulchenko YS, Ripke S, Isaacs A. et al. GenABEL: an R library for genome-wide association analysis. Bioinformatics. 2007;23:1294-6
33. Dennis GJ, Sherman BT, Hosack DA. et al. DAVID: Database for Annotation, Visualization, and Integrated Discovery. Genome Biol. 2003;4:P3
34. Parr CL, Batty GD, Lam TH. et al. Body-mass index and cancer mortality in the Asia-Pacific Cohort Studies Collaboration: pooled analyses of 424,519 participants. Lancet Oncol. 2010;11:741-52
35. Yan J, Young ME, Cui L. et al. Increased glucose uptake and oxidation in mouse hearts prevent high fatty acid oxidation but cause cardiac dysfunction in diet-induced obesity. Circulation. 2009;119:2818-28
36. Yi F, Brubaker PL, Jin T. TCF-4 mediates cell type-specific regulation of proglucagon gene expression by beta-catenin and glycogen synthase kinase-3beta. J Biol Chem. 2005;280:1457-64
37. Damcott CM, Pollin TI, Reinhart LJ. et al. Polymorphisms in the transcription factor 7-like 2 (TCF7L2) gene are associated with type 2 diabetes in the Amish: replication and evidence for a role in both insulin secretion and insulin resistance. Diabetes. 2006;55:2654-9
38. de Kort S, Simons CCJM, van den Brandt PA. et al. Diabetes mellitus type 2 and subsite-specific colorectal cancer risk in men and women: results from the Netherlands Cohort Study on diet and cancer. Eur J Gastroenterol Hepatol. 2016;28:896-903
39. Mariman E C M, Wang P. Adipocyte extracellular matrix composition, dynamics and role in obesity. Cell Mol Life Sci. 2010;67:1277-1292
40. Yarden Y. The EGFR family and its ligands in human cancer: signalling mechanisms and therapeutic opportunities. Eur J Cancer. 2001;37:3-8
41. Irby R B, Yeatman T J. Role of Src expression and activation in human cancer. Oncogene. 2000;19:5636
42. Tchernof A, Levesque E, Beaulieu M. et al. Expression of the androgen metabolizing enzyme UGT2B15 in adipose tissue and relative expression measurement using a competitive RT-PCR method. Clin Endocrinol. 1999;50:637-42
43. Leow SC, Poschmann J, Too PG. et al. The transcription factor SOX6 contributes to the developmental origins of obesity by promoting adipogenesis. Development. 2016;143:950-61
44. Wansleben S, Peres J, Hare S. et al. T-box transcription factors in cancer biology. Biochim Biophys Acta. 2014;1846:380-91
45. Miao L, Zhu S, Wang Y. et al. Discoidin domain receptor 1 is associated with poor prognosis of non-small cell lung cancer and promotes cell invasion via epithelial-to-mesenchymal transition. Med Oncol. 2013;30:626
46. Yu L, Liang Y, Cao X. et al. Identification of MYST3 as a novel epigenetic activator of ERalpha frequently amplified in breast cancer. Oncogene. 2016 doi: 10.1038/onc.2016.433
47. Fedirko V, Romieu I, Aleksandrova K. et al. Pre-diagnostic anthropometry and survival after colorectal cancer diagnosis in Western European populations. Int J cancer. 2014;135:1949-60
48. Li D, Morris J S, Liu J. et al. Body mass index and risk, age of onset, and survival in patients with pancreatic cancer. Jama. 2009;301:2553-62
49. Teschendorff AE, Yang Z, Wong A. et al. Correlation of Smoking-Associated DNA Methylation Changes in Buccal Cells With DNA Methylation Changes in Epithelial Cancer. JAMA Oncol. 2015;1:476-85
50. Li J-S, Han T-J, Jing N. et al. Obesity and the risk of cholangiocarcinoma: a meta-analysis. Tumour Biol. 2014;35:6831-8
51. M Kyrgiou, I Kalliala, G Markozannes. et al. Adiposity and cancer at major anatomical sites: umbrella review of the literature. BMJ. 2017;356:j477. doi: 10.1136/bmj.j477
52. Mehlen P, Fearon E R. Role of the dependence receptor DCC in colorectal cancer pathogenesis. J Clin Oncol. 2004;22:3420-28
53. Forcet C, Stein E, Pays L. et al. Netrin-1-mediated axon outgrowth requires deleted in colorectal cancer-dependent MAPK activation. Nature. 2002;417:443
54. Qi L, Song W, Liu Z. et al. Wnt3a Promotes the vasculogenic mimicry formation of colon cancer via wnt/β-catenin signaling. Int J Mol Sci. 2015;16:18564-79
55. Ying J, Li H, Yu J. et al. WNT5A exhibits tumor-suppressive activity through antagonizing the Wnt/β-catenin signaling, and is frequently methylated in colorectal cancer. Clin Cancer Res. 2008;14:55-61
56. Lara E, Calvanese V, Huidobro C. et al. Epigenetic repression of ROR2 has a Wnt-mediated, pro-tumourigenic role in colon cancer. Mol Cancer. 2010;9(1):170
57. Lee JM, Kim IS, Kim H. et al. RORalpha attenuates Wnt/beta-catenin signaling by PKCalpha-dependent phosphorylation in colon cancer. Mol Cell. 2010;37:183-95
58. Garcia-Echeverria C, Sellers WR. Drug discovery approaches targeting the PI3K/Akt pathway in cancer. Oncogene. 2008;27:5511-26
59. Huang X-F, Chen J-Z. Obesity, the PI3K/Akt signal pathway and colon cancer. Obes Rev. 2009;10:610-6
60. Cheng I, Caberto CP, Lum-Jones A. et al. Type 2 diabetes risk variants and colorectal cancer risk: the Multiethnic Cohort and PAGE studies. Gut. 2011;60:1703-11
61. Campbell PT, Deka A, Jacobs EJ. et al. Prospective study reveals associations between colorectal cancer and type 2 diabetes mellitus or insulin use in men. Gastroenterology. 2010;139:1138-46
62. Konecny G E, Santos L, Winterhoff B. et al. HER2 gene amplification and EGFR expression in a large cohort of surgically staged patients with nonendometrioid (type II) endometrial cancer. Br J Cancer. 2009;100:89
63. Llobet D, Eritja N, Domingo M. et al. KSR1 is overexpressed in endometrial carcinoma and regulates proliferation and TRAIL-induced apoptosis by modulating FLIP levels. Am J Pathol. 2011;178:1529-43
64. Balasenthil S, Broaddus R R, Kumar R. Expression of metastasis-associated protein 1 (MTA1) in benign endometrium and endometrial adenocarcinomas. Hum pathol. 2006;37:656-61
65. Oh J H, Kim J H, Ahn H J. et al. Syndecan-1 enhances the endometrial cancer invasion by modulating matrix metalloproteinase-9 expression through nuclear factor κB. Gynecol Oncol. 2009;114:509-15
66. Rodríguez-Jiménez F J, Caldés T, Iniesta P. et al. Overexpression of SPARC protein contrasts with its transcriptional silencing by aberrant hypermethylation of SPARC CpG-rich region in endometrial carcinoma. Oncol Rep. 2007;17:1301-7
67. Anfossi G, Russo I, Trovati M. Platelet dysfunction in central obesity. Nutr Metab Cardiovasc Dis. 2017;19:440-9
68. Howe LR, Subbaramaiah K, Hudis CA. et al. Molecular pathways: adipose inflammation as a mediator of obesity-associated cancer. Clin Cancer Res. 2013;19:6074-83
69. Hayden MS, Ghosh S. NF-kappaB, the first quarter-century: remarkable progress and outstanding questions. Genes Dev. 2012;26:203-34
70. Lai H, Chen Q, Li X. et al. Association between genetic polymorphism in NFKB1 and NFKBIA and coronary artery disease in a Chinese Han population. Int J Clin Exp Med. 2015;8:21487-96
71. Sanna-Cherchi S, Sampogna R V, Papeta N. et al. Mutations in DSTYK and dominant urinary tract malformations. N Engl J Med. 2013;369:621-9
72. Payton S. Genetics: DSTYK gene linked to urinary tract defects. Nat Rev Urol. 2013;10:492
73. Williams BC, Garrett-Engele CM, Li Z. et al. Two putative acetyltransferases, san and deco, are required for establishing sister chromatid cohesion in Drosophila. Curr Biol. 2003;13:2025-36
74. Chu C-W, Hou F, Zhang J. et al. A novel acetylation of beta-tubulin by San modulates microtubule polymerization via down-regulating tubulin incorporation. Mol Biol Cell. 2011;22:448-56
75. Finak G, Bertos N, Pepin F. et al. Stromal gene expression predicts clinical outcome in breast cancer. Nat Med. 2008;14:518-27
76. Detwiller KY, Fernando NT, Segal NH. et al. Analysis of hypoxia-related gene expression in sarcomas and effect of hypoxia on RNA interference of vascular endothelial cell growth factor A. Cancer Res. 2005;65:5881-9
77. Morris AP, Voight BF, Teslovich TM. et al. Large-scale association analysis provides insights into the genetic architecture and pathophysiology of type 2 diabetes. Nat Genet. 2012;44:981-90
78. Almontashiri NAM, Chen H-H, Mailloux RJ. et al. SPG7 variant escapes phosphorylation-regulated processing by AFG3L2, elevates mitochondrial ROS, and is associated with multiple clinical phenotypes. Cell Rep. 2014;7:834-47
79. Thomsen SK, Ceroni A, van de Bunt M. et al. Systematic Functional Characterization of Candidate Causal Genes for Type 2 Diabetes Risk Variants. Diabetes. 2016;65:3805-11
80. Eeles RA, Kote-Jarai Z, Al Olama AA. et al. Identification of seven new prostate cancer susceptibility loci through a genome-wide association study. Nat Genet. 2009;41:1116-21
81. Zeggini E, Scott LJ, Saxena R. et al. Meta-analysis of genome-wide association data and large-scale replication identifies additional susceptibility loci for type 2 diabetes. Nat Genet. 2008;40:638-45
82. Aslibekyan S, Demerath EW, Mendelson M. et al. Epigenome-wide study identifies novel methylation loci associated with body mass index and waist circumference. Obesity. 2015;23:1493-501
83. Huang Y-T, Chu S, Loucks EB. et al. Epigenome-wide profiling of DNA methylation in paired samples of adipose tissue and blood. Epigenetics. 2016;11:227-36
Author contact
![]() Corresponding authors: Qinong Ye, Department of Medical Molecular Biology, Beijing Institute of Biotechnology, Beijing 100850, China; Tel: 8610-66931830; Fax: 8610-88271216; E-mail: yeqn66com and Shan Gao, CAS Key Laboratory of Bio-medical Diagnostics, Suzhou Institute of Biomedical Engineering and Technology, Chinese Academy of Sciences, Suzhou 215163, China; Tel: 86-512-69588300; Fax: 0512-69588088; E-mail: gaosac.cn.
Corresponding authors: Qinong Ye, Department of Medical Molecular Biology, Beijing Institute of Biotechnology, Beijing 100850, China; Tel: 8610-66931830; Fax: 8610-88271216; E-mail: yeqn66com and Shan Gao, CAS Key Laboratory of Bio-medical Diagnostics, Suzhou Institute of Biomedical Engineering and Technology, Chinese Academy of Sciences, Suzhou 215163, China; Tel: 86-512-69588300; Fax: 0512-69588088; E-mail: gaosac.cn.