Impact Factor ISSN: 1837-9664

 Global reach, higher impact
J Cancer 2018; 9(17):3016-3022. doi:10.7150/jca.26133 This issue Cite
Research Paper
Identification of Genes and Pathways Involved in Ovarian Epithelial Cancer by Bioinformatics Analysis
Yun Zhou1, Olivia Layton2, Li Hong1 ![]()
1. Department of Gynaecology and Obstetrics, Renmin Hospital of Wuhan University, Wuhan, Hubei, 430060, P.R. China
2. Department of Pharmacology & Experimental Therapeutics, Boston University School of Medicine, Boston, MA, 02118, USA
Received 2018-3-17; Accepted 2018-6-9; Published 2018-7-30
Abstract
Ovarian epithelial cancer (OEC) is an often fatal disease with poor prognosis in women with high-stage disease. In contrast, ovarian low malignant potential (LMP) tumors with favorable prognosis behaves as a disease between benign and malignant tumors. The involved genes and pathways between benign-like LMP and aggressive OEC are largely unknown. This study integrated two cohorts profile datasets to investigate the potential key candidate genes and pathways associated with OEC. Gene expression in two datasets (GSE9891 and GSE12172), including 327 OECs and 48 LMP tumors, were analyzed. 559 differentially expressed genes were found to overlap, 251 up-regulated and 308 down-regulated. Subsequently, analysis of gene ontology, signaling pathway enrichment and protein-protein interaction (PPI) network was performed. Gene ontology analysis clustered the up-regulated and down-regulated genes based on significant enrichment. 282 nodes/ differentially expressed genes (DEGs) were identified from DEGs PPI network complex, and two most significant k-clique modules were identified from PPI. In a summary, using integrated bioinformatics analysis, we are able to identify biomarkers potentially significant in the pathogenesis of OEC, which can improve our understanding of the cause and molecular events. These candidate genes and pathways could be used for further confirmation, and lead to better disease diagnose and therapy.
Keywords: ovarian epithelial cancer, low malignant potential tumor, chemokine, neoplasm invasiveness, bioinformatics
Introduction
Ovarian epithelial cancer (OEC) is the fourth leading cause of female cancer death in the developed world [1], with 50% of all cases occurring in women older than 65 years [2]. Ovarian epithelial cancers account for 75% of all ovarian tumors, and 90-95% of ovarian malignancies. The American Cancer Society estimates a total of 22,240 new cases and attributes 14,070 deaths to the disease in 2018. Ovarian cancer burden in China is relatively stable due to the increased aging population [3]. The disease has a low survival rate due to the fact that the majority of patients when first diagnosed are already at an advanced stage of ovarian cancer since symptoms are often not apparent during the early development of it. Surgery followed with platinum-based chemotherapy is the standard treatment. In spite of the great improvement in the current therapeutic approach, the survival rate at 5 years for the whole population of ovarian cancer patients is still low (46.5%), and is even worse (29%) in women with late-stage distant disease diffusion [4]. High mortality in ovarian cancer underscores the high demand to reveal underlying molecular mechanisms, and to discover molecular biomarkers for early diagnosis, prevention and target therapy.
Different from ovarian epithelial cancer, low malignant potential (LMP) tumors are a distinct subset of epithelial tumor with behavior characteristics in between benign and malignant tumors, and make up approximately 15% of all epithelial ovarian tumors [5]. As abnormal cells form in the tissue covering the ovary and do not usually grow into the stroma, LMP tumors are also called borderline malignant ovarian cancer. LMP tumors, which most often affect younger women, display atypical nuclear structure and metastatic behavior, but are considered noninvasive with 5-year survival rates greater than 95% in contrast to a <45% survival for advanced high-grade OEC [6, 7].
In the past two decades, about twenty microarray-based gene profiles were performed to seek new insights for biomarkers of ovarian cancers [8]. They focused on the prognostic value of gene expression signatures and made advances in disease stratification and prognosis prediction. However, the results were generated from an individual cohort, and were always inconsistent in independent studies. The genetic mechanisms of OEC are far from being understood. An integrated bioinformatics method combined with gene expression profiling will be important to discover more reliable biomarkers for ovarian epithelial cancer.
In this study, the screening of differentially expressed genes between ovarian low malignant potential tumors and ovarian malignant tumors in two individual gene expression datasets were performed, and subsequent analysis of gene ontology, signaling pathway enrichment and protein-protein interaction (PPI) network were carried out. We proposed novel biomarkers for further study.
Materials and Methods
Gene Datasets
Two gene expression datasets (GSE9891, GSE12172) were obtained from NCBI Gene Expression Omnibus (GEO) database, available at http://www.ncbi.nlm.nih.gov/geo/. GSE9891 comprises molecular profiling from 285 ovarian samples, which include 18 ovarian low malignant potential tumors and 267 malignant ovarian cancers. GSE12172 includes the expression profile of 30 low malignant potential tumors and 60 ovarian malignant serous tumors that originated from ovary epithelial tissue. The experiments of both datasets were performed in Affymetrix Human Genome U133 Plus 2.0 Array microarray platform.
Data Preprocessing and Differentially Expressed Genes (DEGs) Analysis
By using the robust multi array average (RMA) [9] algorithm in R affy package, the raw array data was converted into expression values, and subsequently background correction, quintile normalization and probe summarization were performed. Differentially expressed genes between low malignant potential tumors and malignant ovarian cancers were analyzed by paired t-test based on the limma package in R language. The adjustment of raw p-value to false discovery rate (FDR) was carried out by the Benjamini & Hochberg method [10]. FDR < 0.01 and |log2FC| > 1.5 were considered as the cutoff value for DEGs screening.
Gene ontology and signaling pathway enrichment analysis of DEGs
Gene ontology analysis (GO) and functional enrichment of the DEGs in the molecular function, biological process and cellular component categories were performed with DAVID, Panther (http://www.pantherdb.org/) [11] and GO (http://geneontology.org/) [12] online database. KEGG PATHWAY (http://www.genome.jp/kegg) and Reactome (http://www.reactome.org) databases were used to perform signaling pathway enrichment analysis with p < 0.05 as a cut-off criterion.
Construction of the PPI network and module analysis
The interactions between the proteins translated from the identified DEGs were searched by STRING Database (http://www.string-db.org/, version 10.5) [13], and a confidence score > 0.4 was used as cut-off criterion. Then cytoscape software (http://www.cytoscape.org/) [14] was used to visualize the PPI network. Cluster analysis of the PPI network was performed by CFinder (http://www.cfinder.org/) [15].
CFinder is based on the Clique Percolation Method algorithm to locate the k-clique communities of networks, where k refers to the number of nodes in the subgraph [16]. k is the size of the complete subgraphs whose large scale organizations are analytically and numerically investigated. A k-cliques value of > 10 was selected as the cut-off criterion. Pathway enrichment analysis of two selected modules was performed with a cut-off of p < 0.05.
Results
Identification of DEGs
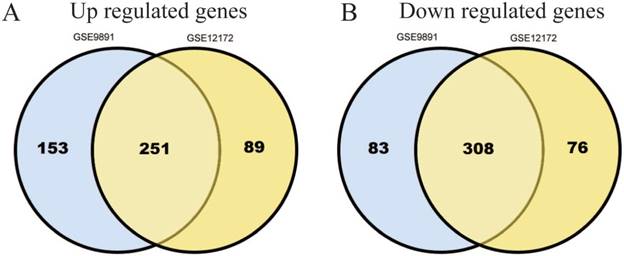
795 DEGs were screened in GSE9891 database, which include 404 up-regulated genes and 391 down-regulated ones.724 DEGs were screened in GSE12172 database, which include 340 up-regulated genes and 384 down-regulated ones. Among these two databases, there are total 559 genes (251 up-regulated and 308 down-regulated) that overlapped (Figure 1A, B).
Identification of 559 commonly changes DEGs from the two profile datasets (GSE9891, GSE12172). Different color areas represented different datasets. The cross areas meant the commonly changed DEGs. DEGs were identified with t-test, statistically significant DEGs were defined with p<0.05 and [log2FC]>1.5 as the cut-off criterion.
DEGs Gene Ontology Analysis
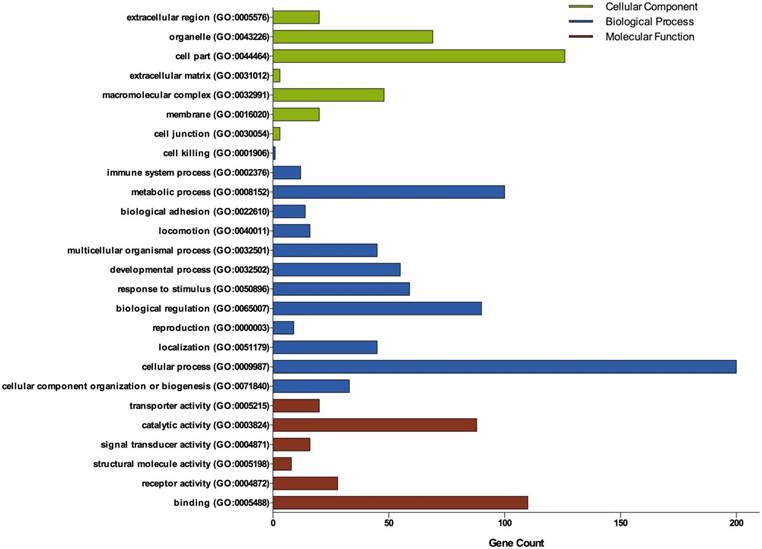
Three groups of DEGs: molecular function, biological process and cellular component were classified by gene ontology (GO) analysis (Figure 2). Among these GO functions, cellular process (GO:0009987), cell part (GO:0044464), binding (GO:0005488), metabolic process (GO:0008152) and biological regulation (GO:0065007) were the top five ones involved in ovarian cancer. Up-regulated genes were mainly enriched in CXCR3 chemokine receptor binding, immune response, chemokine-mediated signaling pathway, chemokine activity, positive regulation of cAMP metabolic process, transcriptional activator activity, RNA polymerase II core promoter proximal region sequence-specific binding and sequence-specific DNA binding (Table 1). Down-regulated genes were mainly enriched in microtubule, microtubule motor activity, dynein complex, nucleoside kinase activity and nucleoside diphosphate kinase activity (Table 2).
Gene Ontology analysis of DEGs in ovarian cancer. GO analysis classified the DEGs into 3 groups: molecular function, biological process and cellular component.
Significant enriched GO terms of up-regulated DEGs in ovarian cancer
| Term name | Description | Count | p-value |
|---|---|---|---|
| Enrichment Score: 2.46 | |||
| GO:0048248 | CXCR3 chemokine receptor binding | 4 | 1.49E-05 |
| GO:0006955 | immune response | 17 | 2.97E-05 |
| GO:0070098 | chemokine-mediated signaling pathway | 7 | 1.64E-04 |
| GO:0008009 | chemokine activity | 6 | 2.47E-04 |
| GO:0030816 | positive regulation of cAMP metabolic process | 3 | 0.00191 |
| GO:0043950 | positive regulation of cAMP-mediated signaling | 3 | 0.00804 |
| GO:0007267 | cell-cell signaling | 9 | 0.00918 |
| GO:0006935 | chemotaxis | 6 | 0.01338 |
| GO:0002690 | positive regulation of leukocyte chemotaxis | 3 | 0.01781 |
| GO:0051281 | positive regulation of release of sequestered calcium ion into cytosol | 3 | 0.03821 |
| GO:0032496 | response to lipopolysaccharide | 6 | 0.04135 |
| Enrichment Score: 2.06 | |||
| GO:0001077 | transcriptional activator activity, RNA polymerase II core promoter proximal region sequence-specific binding | 12 | 9.65E-05 |
| GO:0043565 | sequence-specific DNA binding | 17 | 3.48E-04 |
| GO:0045944 | positive regulation of transcription from RNA polymerase II promoter | 22 | 0.00447 |
| GO:0000978 | RNA polymerase II core promoter proximal region sequence-specific DNA binding | 11 | 0.00836 |
| GO:0006366 | transcription from RNA polymerase II promoter | 13 | 0.01569 |
| GO:0003700 | transcription factor activity, sequence-specific DNA binding | 17 | 0.09053 |
Significant enriched GO terms of down-regulated DEGs in ovarian cancer
| Term name | Description | Count | p-value |
|---|---|---|---|
| Enrichment Score: 3.67 | |||
| GO:0005874 | microtubule | 17 | 1.12E-06 |
| GO:0003777 | microtubule motor activity | 9 | 3.62E-06 |
| GO:0030286 | dynein complex | 6 | 5.22E-06 |
| GO:0007018 | microtubule-based movement | 7 | 3.48E-04 |
| GO:0016887 | ATPase activity | 7 | 0.01885 |
| Enrichment Score: 1.80 | |||
| GO:0019206 | nucleoside kinase activity | 3 | 0.00550 |
| GO:0004550 | nucleoside diphosphate kinase activity | 3 | 0.02158 |
| GO:0015949 | nucleobase-containing small molecule interconversion | 3 | 0.03346 |
Signaling Pathway Enrichment Analysis
Based on KEGG and Reactome databases, the top five enriched pathways of up-regulated genes were related to Chemokine receptors bind chemokines, G alpha (i) signalling events, Chemokine signaling pathway, Cytokine-cytokine receptor interaction and Mitotic Prometaphase (Table 3). ACKR2, CCL11, CDCA8, CENPE, CXCL10, CXCL11, CXCL13, CXCL14, CXCL9, GNGT1, GPR17, NPW, NUF2, PDYN, PTGER3, SKA1, SPC25 and TNFRSF17 were the genes involved in these five signaling pathways. The most significant enriched pathway in down-regulated genes was Interconversion of nucleotide di- and triphosphates, involving AK7, AK9 and AK8 (Table 3).
Signaling pathway enrichment analysis of DEGs function in ovarian cancer
| Pathway | Name | Count | p-value | Genes |
|---|---|---|---|---|
| Up-regulated DEG | ||||
| R-HSA-380108 | Chemokine receptors bind chemokines | 6 | 5.26E-04 | CCL11, CXCL13, CXCL9, ACKR2, CXCL11, CXCL10 |
| R-HSA-418594 | G alpha (i) signaling events | 9 | 0.00675 | GNGT1, PTGER3, CXCL13, NPW, CXCL9, GPR17, PDYN, CXCL11, CXCL10 |
| KEGG: hsa04062 | Chemokine signaling pathway | 7 | 0.01032 | CCL11, GNGT1, CXCL14, CXCL13, CXCL9, CXCL11, CXCL10 |
| KEGG: hsa04060 | Cytokine-cytokine receptor interaction | 7 | 0.02668 | CCL11, CXCL14, CXCL13, CXCL9, TNFRSF17, CXCL11, CXCL10 |
| R-HSA-68877 | Mitotic Prometaphase | 5 | 0.03419 | SPC25, CDCA8, NUF2, CENPE, SKA1 |
| R-HSA-2500257 | Resolution of Sister Chromatid Cohesion | 5 | 0.04855 | SPC25, CDCA8, NUF2, CENPE, SKA1 |
| Down-regulated DEG | ||||
| R-HSA-499943 | Interconversion of nucleotide di- and triphosphates | 3 | 0.01646 | AK7, AK9, AK8 |
Analysis of PPI network and modules
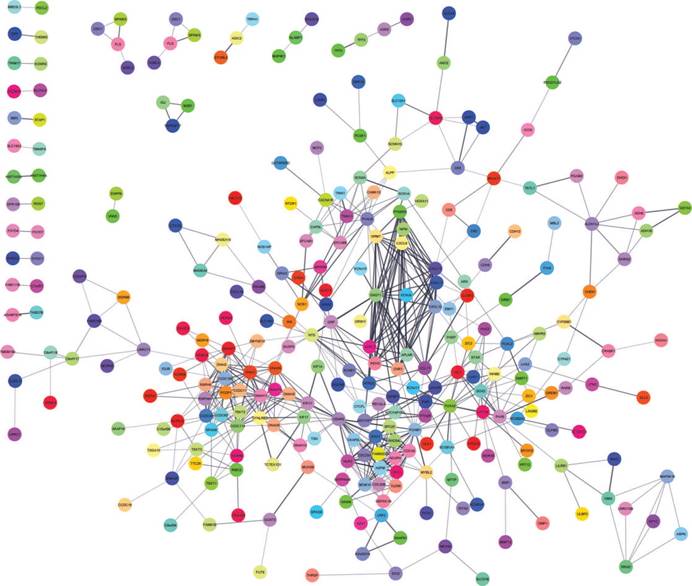
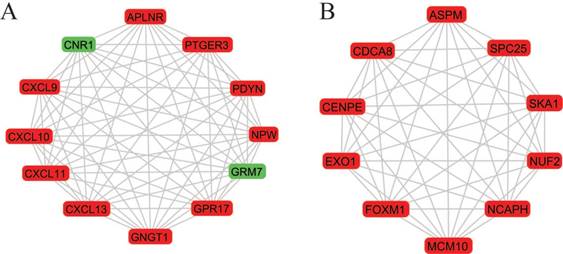
A total of 282 DEGs of the 559 commonly changed DEGs were screened into the DEGs PPI network complex, containing 282 nodes and 652 edges (Figure 3). Using CFinder with a k-cliques value of > 10, two modules, including module 1 (Figure 4A) and module 2 (Figure 4B) were extracted from the constructed PPI network. Pathway enrichment analysis showed that Module 1 consisted of 12 nodes and 66 edges (Figure 4A, Table 4), which are mainly associated with G-protein coupled receptor signaling pathway, CXCR3 chemokine receptor binding and CXC chemokine, and that Module 2 consisted of 10 nodes and 45 edges (Figure 4B, Table 5), which are mainly associated with mitotic cell cycle process, nuclear division and chromosome segregation.
DEGs protein-protein interaction network complex. Total of 282 DEGs were screened into, containing 282 nodes and 652 edges.
Two most significant k-clique modules in the PPI network. (A) Module 1 consisted of 12 nodes and 66 edges, which are mainly associated with G-protein coupled receptor signaling pathway, CXCR3 chemokine receptor binding and CXC chemokine; (B) Module 2 consisted of 10 nodes and 45 edges, which are mainly associated with mitotic cell cycle process, nuclear division and chromosome segregation. Genes in red represent as upregulation and genes in green represent as downregulation.
Top 10 of pathway enrichment analysis of Module 1 genes function
| Category | Term name | Description | Count | p-value |
|---|---|---|---|---|
| GO Process | GO:0007186 | G-protein coupled receptor signaling pathway | 11 | 7.03E-10 |
| GO Function | GO:0048248 | CXCR3 chemokine receptor binding | 4 | 1.40E-09 |
| InterPro | IPR001089 | CXC chemokine | 4 | 2.73E-08 |
| InterPro | IPR018048 | CXC chemokine, conserved site | 4 | 2.73E-08 |
| GO Process | GO:0070098 | chemokine-mediated signaling pathway | 5 | 1.36E-07 |
| GO Process | GO:0048247 | lymphocyte chemotaxis | 4 | 9.50E-07 |
| InterPro | IPR001811 | Chemokine interleukin-8-like domain | 4 | 1.05E-06 |
| Pfam | PF00048 | Small cytokines (intecrine/chemokine), interleukin-8 like | 4 | 1.48E-06 |
| GO Process | GO:0032496 | response to lipopolysaccharide | 6 | 9.96E-06 |
| KEGG Pathways | 04062 | Chemokine signaling pathway | 5 | 1.02E-05 |
Top 10 of pathway enrichment analysis of Module 2 genes function
| Category | Term name | Description | Count | p-value |
|---|---|---|---|---|
| GO Process | GO:1903047 | mitotic cell cycle process | 9 | 3.82E-09 |
| GO Process | GO:0007049 | cell cycle | 10 | 3.82E-09 |
| GO Process | GO:0000278 | mitotic cell cycle | 9 | 6.37E-09 |
| GO Process | GO:0007067 | mitotic nuclear division | 7 | 7.95E-08 |
| GO Process | GO:0007059 | chromosome segregation | 6 | 2.14E-07 |
| GO Process | GO:0051301 | cell division | 7 | 4.07E-07 |
| GO Component | GO:0000793 | condensed chromosome | 5 | 8.13E-06 |
| GO Component | GO:0000775 | chromosome, centromeric region | 5 | 8.13E-06 |
| GO Component | GO:0000777 | condensed chromosome kinetochore | 4 | 4.33E-05 |
| GO Component | GO:0000779 | condensed chromosome, centromeric region | 4 | 4.33E-05 |
Discussion
Invasiveness is one of the aggressive features of ovarian epithelial cancer, in particular the advanced high-grade disease. In contrast, the low malignant potential tumor behaves as a located lesion within the tissue covering the ovary. Characterizing the molecular difference between LMP tumor and OEC will shed light on the mechanism controlling the invasive trait of OEC malignances. In the present study, we integrated two individual cohorts of profile datasets, and used multiple bioinformatics tools to identify significant genes and pathways between LMP tumors and ovarian epithelia cancers. A total of 559 differentially expressed genes were screened in two public available GEO datasets, including 251 up-regulated and 308 down-regulated genes. Based on the gene ontology analysis, a greater majority of the DEGs were involved in biological process, specifically the cellular process, than in cellular component or molecular function (Figure 2). GO function analysis revealed that more significant enrichments in the up-regulated DEGs were CXCR3 chemokine, immune response and chemokine-mediated signaling pathway.
Through literature survey, we found that the increased expression and release of pro-inflammatory chemokines have been associated with progression of ovarian cancer, which may induce tumor cell proliferation, survival, migration, and angiogenesis [17-19]. The enrichments of chemokine and immune response pathway in this study highly validated their important roles in OEC malignancies. Consistent with Gene Ontology analysis, signaling pathway enrichment analysis displayed the same signaling pathways in the up-regulated DEGs: Chemokine receptors bind chemokines, G alpha (i) signaling events, Chemokine signaling pathway and Cytokine-cytokine receptor interaction. Chemokines are a family of cytokines that induce chemotaxis of target cells and bind to the G protein coupled chemokine receptors. Other than the function of inducing leukocyte migration (including dendritic cells, macrophages, and neutrophils) into the infected or injured sites [20], they can promote cancer progression [21-25].
GO analysis in down-regulated DEGs showed that more significant enrichments were microtubule, microtubule motor activity, dynein complex and microtubule-based movement. All of these enrichments were associated with microtubule function. Microtubules are highly dynamic structures that play an important role in cellular growth, vesicular transport and mitosis [26]. They are composed of α/β-tubulin heterodimers [27]. Alterations in specific β-tubulin isotypes in epithelial cancers are associated with resistance to tubulin-binding agent chemotherapy and more aggressive disease [28]. Microtubules were linked in tumor cell migration and metastasis [26].
More interestingly, 12 genes were selected in the most significant k-clique module 1 of the PPI network: APLNR, CNR1, CXCL9, CXCL10, CXCL11, CXCL13, GNGT1, GPR17, GRM7, NPW, PDYN, PTGER3. Among them, most genes were chemokines and involved cancer immunity. APLNR is a member of G-protein coupled receptor signaling pathway, which was significantly mutated in human cancers [29]. APELA, the ligand of APLNR, can promote ovarian cancer cell growth and migration [30]. CNR1 gene expression was down-regulated in endometrial carcinomas, another gynecologic cancer which was validated by qRT-PCR [31]. Inversely, Messalli et al. found that expression of CB1R (alias of CNR1) increased from benign and borderline to malignant tumors by immunohistochemical quantification [32]. A possible reason for the discrepancy between gene and protein expression is that other post-transcription and/or post-translation mechanisms affect CNR1 expression. CXCL9 and CXCL10 expression was associated with improved patient survival, and these two chemokines were synergistically induced by inflammatory cytokines [33]. CXCL11 promoted proliferation and migration of ovarian cancer cells via the chemokine receptor CXCR3, thus CXCL11-CXCR3 signaling represented therapeutic targets in ovarian cancer [34]. In independent cohorts of ovarian cancer patients, high CXCL13 correlated strongly with better prognosis [35]. Based on the function of uncovered genes, we hypothesized, GNGT1, GPR17, GRM7, NPW, PDYN and PTGER3 can influence OEC development via chemokine signaling.
In module 2, ASPM, CDCA8, CENPE, EXO1, FOXM1, MCM10, NCAPH, NUF2, SKA1 and SPC25 were displayed and mainly associated with mitotic cell cycle. Most of these genes were studied and identified in ovarian cancers. Deregulation of ASPM in OEC correlates with tumor progression, grade and survival [36, 37]. CDCA8 was significantly higher in ovarian cancer cells compared with ovarian epithelial cells by using quantitative PCR with reverse transcription analysis [38]. CENPE, a cell cycle regulating gene, was up-regulated in chemo-resistant ovary tumors [39]. CENPE proteins were significantly up-regulated in the fibroblasts co-cultured with ovarian cancer cells [40]. Attenuating EXO1 expression by small interfering RNA augments the chemotherapy efficacy against ovarian cancer [41]. FOXM1 acted as a transcriptional activator involved in cell proliferation to promote cell cycle progression in OEC cells [42]. NUF2 was significantly aberrantly overexpressed in ovary serous adenocarcinomas, and silencing of NUF2 induced increased apoptosis [43]. It is speculated that the undiscovered four genes (MCM10, NCAPH, SKA1, SPC25) involved in cell cycle may exert effects in OEC.
Taken together, chemokine-related signaling, mitotic cell cycle and microtubule pathways play important roles in pathogenesis and aggressiveness of ovarian epithelial cancer. Nine novel up-regulated genes (GNGT1, GPR17, NPW, PDYN, PTGER3, MCM10, NCAPH, SKA1, SPC25) and one down-regulated gene (GRM7) are linked with OEC invasiveness. This is the first time the identified genes from this study have been proposed, but these results will require confirmation through further studies.
Acknowledgements
This work was supported by the National Natural Science Foundation of China (81471442).
Competing Interests
The authors have declared that no competing interest exists.
References
1. Jayson GC, Kohn EC, Kitchener HC, Ledermann JA. Ovarian cancer. Lancet. 2014;384:1376-88
2. Yancik R. Ovarian cancer. Age contrasts in incidence, histology, disease stage at diagnosis, and mortality. Cancer. 1993;71:517-23
3. Wang B, Liu SZ, Zheng RS, Zhang F, Chen WQ, Sun XB. Time trends of ovarian cancer incidence in China. Asian Pac J Cancer Prev. 2014;15:191-3
4. Testa U, Petrucci E, Pasquini L, Castelli G, Pelosi E. Ovarian Cancers: Genetic Abnormalities, Tumor Heterogeneity and Progression, Clonal Evolution and Cancer Stem Cells. Medicines (Basel). 2018:5
5. Morice P, Uzan C, Fauvet R, Gouy S, Duvillard P, Darai E. Borderline ovarian tumour: pathological diagnostic dilemma and risk factors for invasive or lethal recurrence. Lancet Oncol. 2012;13:e103-15
6. Bonome T, Lee JY, Park DC, Radonovich M, Pise-Masison C, Brady J. et al. Expression profiling of serous low malignant potential, low-grade, and high-grade tumors of the ovary. Cancer Res. 2005;65:10602-12
7. Hauptmann S, Friedrich K, Redline R, Avril S. Ovarian borderline tumors in the 2014 WHO classification: evolving concepts and diagnostic criteria. Virchows Arch. 2017;470:125-42
8. Konecny GE, Winterhoff B, Wang C. Gene-expression signatures in ovarian cancer: Promise and challenges for patient stratification. Gynecol Oncol. 2016;141:379-85
9. Irizarry RA, Hobbs B, Collin F, Beazer-Barclay YD, Antonellis KJ, Scherf U. et al. Exploration, normalization, and summaries of high density oligonucleotide array probe level data. Biostatistics. 2003;4:249-64
10. Benjamini Y, Hochberg Y. Controlling the False Discovery Rate - a Practical and Powerful Approach to Multiple Testing. J Roy Stat Soc B Met. 1995;57:289-300
11. Mi H, Dong Q, Muruganujan A, Gaudet P, Lewis S, Thomas PD. PANTHER version 7: improved phylogenetic trees, orthologs and collaboration with the Gene Ontology Consortium. Nucleic Acids Res. 2010;38:D204-10
12. Ashburner M, Ball CA, Blake JA, Botstein D, Butler H, Cherry JM. et al. Gene ontology: tool for the unification of biology. The Gene Ontology Consortium. Nat Genet. 2000;25:25-9
13. Szklarczyk D, Morris JH, Cook H, Kuhn M, Wyder S, Simonovic M. et al. The STRING database in 2017: quality-controlled protein-protein association networks, made broadly accessible. Nucleic Acids Res. 2017;45:D362-D8
14. Shannon P, Markiel A, Ozier O, Baliga NS, Wang JT, Ramage D. et al. Cytoscape: a software environment for integrated models of biomolecular interaction networks. Genome Res. 2003;13:2498-504
15. Adamcsek B, Palla G, Farkas IJ, Derenyi I, Vicsek T. CFinder: locating cliques and overlapping modules in biological networks. Bioinformatics. 2006;22:1021-3
16. Derenyi I, Palla G, Vicsek T. Clique percolation in random networks. Phys Rev Lett. 2005;94:160202
17. Xu L, Fidler IJ. Interleukin 8: an autocrine growth factor for human ovarian cancer. Oncol Res. 2000;12:97-106
18. Szlosarek P, Balkwill F. The inflammatory cytokine network of epithelial cancer: therapeutic implications. Novartis Found Symp. 2004;256:227-37 discussion 37-40, 59-69
19. Waugh DJ, Wilson C. The interleukin-8 pathway in cancer. Clin Cancer Res. 2008;14:6735-41
20. Newton K, Dixit VM. Signaling in innate immunity and inflammation. Cold Spring Harb Perspect Biol. 2012:4
21. Kunkel SL, Strieter RM, Chensue SW, Basha M, Standiford T, Ham J. et al. Tumor necrosis factor-alpha, interleukin-8 and chemotactic cytokines. Prog Clin Biol Res. 1990;349:433-44
22. Baggiolini M, Dewald B, Moser B. Human chemokines: an update. Annu Rev Immunol. 1997;15:675-705
23. Murphy PM. Chemokines and the molecular basis of cancer metastasis. N Engl J Med. 2001;345:833-5
24. Mantovani A, Allavena P, Sica A, Balkwill F. Cancer-related inflammation. Nature. 2008;454:436-44
25. Rainczuk A, Rao J, Gathercole J, Stephens AN. The emerging role of CXC chemokines in epithelial ovarian cancer. Reproduction. 2012;144:303-17
26. Fife CM, McCarroll JA, Kavallaris M. Movers and shakers: cell cytoskeleton in cancer metastasis. Br J Pharmacol. 2014;171:5507-23
27. Luduena RF. A hypothesis on the origin and evolution of tubulin. Int Rev Cell Mol Biol. 2013;302:41-185
28. Kavallaris M. Microtubules and resistance to tubulin-binding agents. Nat Rev Cancer. 2010;10:194-204
29. Kan Z, Jaiswal BS, Stinson J, Janakiraman V, Bhatt D, Stern HM. et al. Diverse somatic mutation patterns and pathway alterations in human cancers. Nature. 2010;466:869-73
30. Yi Y, Tsai SH, Cheng JC, Wang EY, Anglesio MS, Cochrane DR. et al. APELA promotes tumour growth and cell migration in ovarian cancer in a p53-dependent manner. Gynecol Oncol. 2017;147:663-71
31. Ayakannu T, Taylor AH, Willets JM, Brown L, Lambert DG, McDonald J. et al. Validation of endogenous control reference genes for normalizing gene expression studies in endometrial carcinoma. Mol Hum Reprod. 2015;21:723-35
32. Messalli EM, Grauso F, Luise R, Angelini A, Rossiello R. Cannabinoid receptor type 1 immunoreactivity and disease severity in human epithelial ovarian tumors. Am J Obstet Gynecol. 2014;211:234 e1-6
33. Bronger H, Singer J, Windmuller C, Reuning U, Zech D, Delbridge C. et al. CXCL9 and CXCL10 predict survival and are regulated by cyclooxygenase inhibition in advanced serous ovarian cancer. Br J Cancer. 2016;115:553-63
34. Lau TS, Chung TK, Cheung TH, Chan LK, Cheung LW, Yim SF. et al. Cancer cell-derived lymphotoxin mediates reciprocal tumour-stromal interactions in human ovarian cancer by inducing CXCL11 in fibroblasts. J Pathol. 2014;232:43-56
35. Rachidi SM, Qin T, Sun S, Zheng WJ, Li Z. Molecular profiling of multiple human cancers defines an inflammatory cancer-associated molecular pattern and uncovers KPNA2 as a uniform poor prognostic cancer marker. PLoS One. 2013;8:e57911
36. Bruning-Richardson A, Bond J, Alsiary R, Richardson J, Cairns DA, McCormack L. et al. ASPM and microcephalin expression in epithelial ovarian cancer correlates with tumour grade and survival. Br J Cancer. 2011;104:1602-10
37. Alsiary R, Bruning-Richardson A, Bond J, Morrison EE, Wilkinson N, Bell SM. Deregulation of microcephalin and ASPM expression are correlated with epithelial ovarian cancer progression. PLoS One. 2014;9:e97059
38. Lawrenson K, Li Q, Kar S, Seo JH, Tyrer J, Spindler TJ. et al. Cis-eQTL analysis and functional validation of candidate susceptibility genes for high-grade serous ovarian cancer. Nat Commun. 2015;6:8234
39. Ju W, Yoo BC, Kim IJ, Kim JW, Kim SC, Lee HP. Identification of genes with differential expression in chemoresistant epithelial ovarian cancer using high-density oligonucleotide microarrays. Oncol Res. 2009;18:47-56
40. Zhang XY, Hong SS, Zhang M, Cai QQ, Zhang MX, Xu CJ. Proteomic alterations of fibroblasts induced by ovarian cancer cells reveal potential cancer targets. Neoplasma. 2018;65:104-12
41. Zhou J, Wang Y, Wang Y, Yin X, He Y, Chen L. et al. FOXM1 modulates cisplatin sensitivity by regulating EXO1 in ovarian cancer. PLoS One. 2014;9:e96989
42. Barger CJ, Zhang W, Hillman J, Stablewski AB, Higgins MJ, Vanderhyden BC. et al. Genetic determinants of FOXM1 overexpression in epithelial ovarian cancer and functional contribution to cell cycle progression. Oncotarget. 2015;6:27613-27
43. Sethi G, Pathak HB, Zhang H, Zhou Y, Einarson MB, Vathipadiekal V. et al. An RNA interference lethality screen of the human druggable genome to identify molecular vulnerabilities in epithelial ovarian cancer. PLoS One. 2012;7:e47086
Author contact
![]() Corresponding author: Li Hong, E-mail; drhongli1011net, Tel: +86-27-88041911.
Corresponding author: Li Hong, E-mail; drhongli1011net, Tel: +86-27-88041911.