3.2
Impact Factor
ISSN: 1837-9664
J Cancer 2018; 9(20):3715-3722. doi:10.7150/jca.27546 This issue Cite
Research Paper
LncRNA GACAT1 Promotes Gastric Cancer Cell Growth, Invasion And Migration By Regulating MiR-149-mediated Of ZBTB2 And SP1
West China Second University Hospital, Sichuan University, Chengdu, China
Received 2018-5-29; Accepted 2018-8-1; Published 2018-9-8
Abstract
Long non-coding RNAs (lncRNAs) were involved in the progression of gastric cancer (GC). In our study, we have determined that GACAT1 expression was upregulated in GC. Overexpression of GACAT1 promoted GC cell proliferation, invasion and migration. We also determined that miR-149 directly interacts with the target site on GACAT1. Furthermore, we investigated that miR-149 downregulated ZBTB2 and SP1 expressions which were induced by GACAT1, miR-149 inhibited GC cell growth and invasion mediated by GACAT1. In conclusion, we found that miR-149 downregulated ZBTB2 and SP1 expressions, and inhibited GC cell progression mediated by GACAT1. Therefore, we indicated that GACAT1 and miR-149 may be potential therapeutic targets for GC.
Keywords: GACAT1, miR-149, ZBTB2, SP1, Gastric cancer, Invasion
Introduction
Gastric cancer (GC), a universal carcinoma around the globe, remains difficult to cure, due to a lack of sensitive biomarkers or obvious symptoms at the early stage. GC involves complex processes, including genetic and epigenetic changes [1]. The dysregulation of oncogenes [2,3,4,5] and tumor suppressors [6,7,8,9] contributes to the carcinogenesis of GC. However, the molecular factors underlying GC development, which may be useful for the development of treatments, still need to be explored.
Non-coding RNAs have been strongly implicated in the development course of GC [10,11,12]. Noncoding RNAs include small ncRNAs (<200nt) and long ncRNAs(>200nt). MicroRNAs, which are a class of small ncRNAs, have been widely investigated for their capacity to regulate genes through causing mRNA degradation or repressing protein translation [13]. Numerous microRNAs have been implicated as potential oncogenes or tumor suppressors affecting cancer development [11,14,15]. Relative to other noncoding RNAs, long ncRNAs (lncRNAs) lack evolutionary conservatism among species [16], and thus the mechanisms of lncRNAs in human diseases are not fully understood. However, recent evidence has strongly supported the hypothesis that lncRNAs are involved in cell physiological processes and may participate in the pathogenesis of human diseases, including cancer [17,18].
GACAT1 was first described by Xia et al. When it was found to be associated with GC. Their study also demonstrated that GACAT1 was upregulated in GC and may therefore be an oncogene and a potential biomarker for GC [19].
In our study, we confirmed that in our cohort, the expression of lncRNA GACAT1 was markedly upregulated in GC tissues. Then, we investigated whether microRNA-149 (miR-149) is a downstream target of GACAT1. In vitro assays suggested that miR-149 may be inhibited by GACAT1. Furthermore, functional assays indicated that the GACAT1/miR-149 axis affects GC cell proliferation, invasion and migration, and thus, that axis may be a potential target for GC treatment.
Material and Methods
Tissue samples
Fresh GC tissues and paired adjacent normal tissues were collected after surgical resection. And all GC patients enrolled in this study did not receive chemotherapy or radiotherapy. This study has also approved by the ethics committee from Sichuan University. The histological results of the GC samples were confirmed based on guidelines from the World Health Organization (WHO). All samples were stored at -80 °C before being used. Informed consent was also provided by all patients.
Cell culture, generation of constructs, and transfection
The normal gastric mucosal epithelial cells (GSE-1) and GC cell lines (BGC-823, MGC-803, SGC7901 and HGC-27) were maintained in common RPMI-1640 medium (Invitrogen,USA) with 10% fetal bovine serum (FBS, Invitrogen,USA) at 37 °C with 5% CO2. The Lipofectamine 3000 Reagent (Invitrogen) was used for the transfection assays. The sequences of the regions selected for targeting by GACAT1 siRNAs were shown in Table 1.
The sequences of the regions selected for targeting by GACAT1 siRNAs
| Gene | Sequences |
|---|---|
| si-GACAT1#1 | Sense: GGA GCA GAA UUA GAA CAA UUU Anti-sense: UUC CUC GUC UUA AUC UUG UUA |
| si-GACAT1#2 | Sense: GUA GCC UGC UCC AGA UUA UUU' Anti-sense: UUC AUC GGA CGA GGU CUA AUA |
| si-GACAT1#3 | Sense: GCU GGC UUC ACC UCU CAA UUU Anti-sense: UUC GAC CGA AGU GGA GAG UUA |
qRT-PCR assay
Total RNA was obtained from the GC tissues and cell lines with TRIzol reagent (Life Technologies). qRT-PCR was performed to access mRNAs or miRNAs expressions. In this study, 2 μg total RNA was used for the construction of a cDNA library, which was carried out with M-MLV reverse transcriptase (Promega). The GACAT1 gene was amplified from the cDNA library. The sequences of the primers used were shown in Table 2.
MTT assay
MGC-803 (6,000 cells/well) and SGC7901 (8,000 cells/well) were added into a 96-well plate. The next day, the inoculated cells were transfected with pcDNA3.1/GACAT1, si-GACAT1 or a control vector at a concentration of 0.2 µg per well. At different time points, the wells were treated with10 μL of MTT. After 4 h. 100 μL of dimethyl sulfoxide (DMSO) was added to the culture plate. Finally, the absorbance was detected at 590 nm.
Primer sequences for qRT-PCR analysis
| Gene | Primer sequences |
|---|---|
| GAPDH | Forward: 5'-TGT TCG TCA TGG GTG TGA AC-3' Reverse: 5'-ATG GCA TGG ACT GTG GTC AT-3' |
| GACAT1 | Forward: 5'- ACC GGA GGA AAA TCC CTA GC-3' Reverse: 5'-CCA TAA AAG GGG CGG CTG T-3' |
| U6 | Forward: 5'-CTC GCT TCG GCA GCA CA-3' Reverse: 5'-AAC GCT TCA CGA ATT TGC GT-3' |
| miR-149 | Forward: 5'-CAT CCT TTC TGG CTC CGT GT-3' Reverse: 5'-GCG TGA TTC GTG CTC GTA TAT C-3' |
Wound-healing assay
Twenty-four hours after transfection with pcDNA3.1/GACAT1, si-GACAT1 or NC, MGC-803 cells and SGC7901 cells (5 × 10³ cells/well) were obtained and plated in 6-well plates. When the cells had formed a confluent monolayer, wounds were made by scratching with 10-µl pipette tips. The treated cells were cultured in a serum-free medium. Photographs were taken at 0 and 24h by using Q-Imagine Software.
miRNA target prediction
The miRNA target algorithm on the RegRNA prediction website (http://regrna.mbc.nctu.edu.tw/) was used to predict the miRNA target genes.
Luciferase reporter assay
Wild-type and mutant type GACAT1 plasmids were structured. MGC-803 cells (5 × 10⁴ cells/well) were seeded into 24-well plates and co-transfected with wild-type GACAT1 or mutant type GACAT1 and scramble control or miR-149 by using Lipofectamine 3000. After 48h, the reporter gene activities were analyzed by the Dual-Luciferase Reporter Assay System (Promega).
Transwell assay
Cell invasion abilities were evaluated using Transwell cell culture chambers. The GC cells (2×10⁵) were transiently transfected with pcDNA3.1/GACAT1 and either si-GACAT1 or the control vector. Approximately 28h after transfection, 1.5×10⁵ cells were mixed by 300 μL of serum-free medium. Then, the cells were seeded into the upper layer, and the complete mediums were plated into the bottom. After 24h, the cells which were migrated to the other side of the transwell were stained with 0.5% crystal violet, and cells remained on the upper membrane surface were removed. The random fields in each membrane were counted using inverted fluorescence microscope (Leica Microsystems GmbH, Wetzlar, Germany) at 20 × objective.
Western blot analysis
Total protein extractions from CFs were carried out using Radio-Immunoprecipitation Assay (RIPA) buffer (Beyotime, Shanghai, China), and protein concentrations were detected with the Bradford method (Bradford, 1976). 20 μg total protein extracts were isolated with 8% SDS-PAGE and then electrophoretically transferred onto PVDF membranes. Then membranes were blocked with 5% non-fat dry milk, followed by primary antibodies at 4 °C overnight. Afterwards, the blots were incubated with horseradish peroxidase-conjugated secondary antibody (Abcam, Cambridge, UK) at room temperature for 1.5 h. Final revelation was performed with enhanced chemiluminescence (Thermo Scientific, Shanghai, China). Finally, proteins were visualized using enhanced chemoluminiscence (Perkin Elmer, USA).
Statistics
Data were expressed as mean ± SD, statistical analysis was carried out using one-way analysis of variance between two groups; multiple-factor analysis (MFA) was used for comparisons between multiple groups. Significance was defined as P < 0.05.
Results
GACAT1 is upregulated and miR-149 is downregulated in human GC
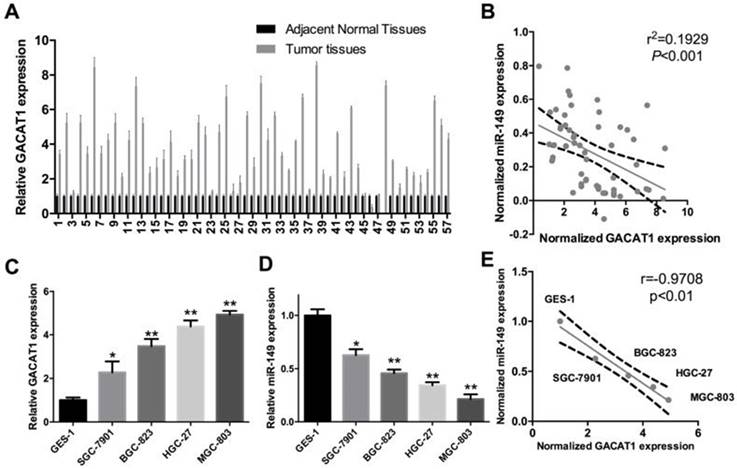
As shown in Fig. 1A, we confirmed that GACAT1 expression was observably increased in GC tissues (P < 0.01). Simultaneously, we proved that there was a negative correlation between GACAT1 and miR-149 expression in GC tissues (r = 0.4698, P < 0.01, Fig. 1B). Secondly, we detected GACAT1 and miR-149 expression in GES-1 cells and four GC cell lines (SGC7901, BGC823, HGC27 and MGC-803). The results showed that compared to GES1, GACAT1 was elevated in the four GC cell lines (P < 0.05, P < 0.01, Fig. 1C). Among those GC cell lines, MGC-803 had the highest expression of GACAT1, and SGC-7901 had a relatively low expression of GACAT1. We also found that miR-149 was decreased in the four GC cell lines compared to GES1 cells (P < 0.05, P < 0.01, Fig. 1D). Among those GC cell lines, MGC-803 had the lowest expression of miR-149, and SGC-7901 had a relatively high expression of miR-149; thus, those two cell lines were chosen for further study. Furthermore, we found that there was a negative correlation between GACAT1 and miR-149 expression in four different GC cell lines (SGC7901, BGC823, HGC27 and MGC-803) and GES1 cells (r=-0.9708, P < 0.01, Fig. 1E).
GACAT1 is upregulated and miR-149 is downregulated in human GC. (A) We used qRT-PCR assay to detect the differential GACAT1 expression in 57 pairs of fresh human GC tissues and corresponding adjacent normal tissues. GAPDH was used as an internal reference (P < 0.05). (B) The correlation between GACAT1 and miR-149 expression was analyzed (r = 0.4698, P < 0.01). GACAT1 were normalized to GAPDH, miR-149 was normalized to U6. (C) qRT-PCR was used to detect GACAT1 expression in four GC cell lines (SGC7901, BGC823, HGC27 and MGC-803) and normal human gastric epithelium cell line GES1. GAPDH was used as an internal reference (*P < 0.05, **P < 0.01, ***P < 0.001). (D) qRT-PCR was used to detect miR-149 expression in four GC cell lines and GES1 cells. U6 was used as an internal reference (*P < 0.05, **P < 0.01). (E) The correlation between miR-149 and GACAT1 was analyzed in four different GC cell lines (SGC7901, BGC823, HGC27 and MGC-803) and GES1 cells (r=-0.9708, P < 0.01).
GACAT1 promotes GC cell proliferation, invasion and migration
To further study the role of GACAT1 in GC development, we silenced GACAT1 expression in MGC-803 cells by siRNAs transfection and upregulated GACAT1 expression in SGC7901 cells by transfection with pcDNA3.1/GACAT1. We used qRT-PCR assay to assess the transfection efficiency. The results showed that pcDNA3.1/GACAT1 could effectively upregulate GACAT1 expression in SGC-7901, and GACAT1#1 siRNA could effectively downregulate GACAT1 expression in MGC-803 cells (Fig. 2A-B). Then, an MTT assay indicated that the overexpression of GACAT1 obviously enhanced the proliferation abiltity of SGC7901 cells (P < 0.05, Fig. 2C). Meanwhile, the knockdown of GACAT1 significantly inhibited the proliferation of MGC-803 cells after 72 h (P < 0.05, Fig. 2D).
GACAT1 promotes GC cells proliferation, invasion and migration. (A) The relative expression level of GACAT1 was detected by qRT-PCR assay after SGC7901 cells were transfected with pcDNA3.1/GACAT1 and a control vector (*P < 0.05). (B) The relative expression level of GACAT1 was detected by qRT-PCR assay after SGC7901 cells were transfected with different three si-GACAT1s and si-NC in (*P < 0.05). (C, D) SGC7901 cells were transfected with pcDNA3.1 and pcDNA3.1/GACAT1, respectively; MGC-803 cells were transfected with si-GACAT1 or RNAi negative control (NC), respectively. Then, an MTT assay was performed to measure the proliferation ability at 24 h, 48 h and 72 h post-transfection. Values represent means ± SD of three replicates (*P < 0.05). (E, G) A wound-healing assay was performed to evaluate the migration ability of the treated SGC7901 cells (*P < 0.05). (F, H) A wound-healing assay was performed to evaluate the migration ability of the treated MGC-803 cells. Three independent experiments were performed (*P < 0.05). (I, K) Transwell analysis of SGC7901 cells after treatment with pcDNA3.1 and pcDNA3.1/GACAT1. The relative ratio of invasive and migrated cells per field was shown (*P < 0.05). (J, L) Transwell analysis of MGC-803 cells after treatment with si-GACAT1 or RNAi NC, and the relative ratio of invasive and migrated cells was counted (*P < 0.05).
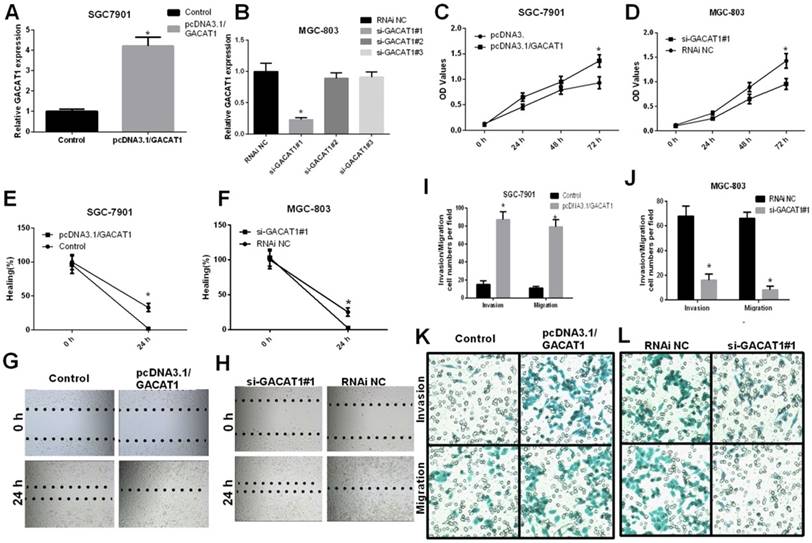
A wound-healing assay was performed to study the effect of GACAT1 on the migration of GC cells. Ectopic expression of GACAT1 significantly promoted migration, while silencing GACAT1 suppressed the migration of GC cells (P < 0.05, Fig. 2E-H). Transwell invasion and migration assays demonstrated that the overexpression of GACAT1 enhanced the migration and invasion abilities of SGC7901 cells (P < 0.05, Fig. 2I and 2K). Moreover, migration and invasion abilities were suppressed in MGC-803 cells with si-GACAT1 group, compared with the control group (P < 0.05, Fig. 2J and 2L). These results clearly indicated that GACAT1 promoted GC cell proliferation, invasion and migration in vitro.
MiR-149 directly interacts with the target site on GACAT1
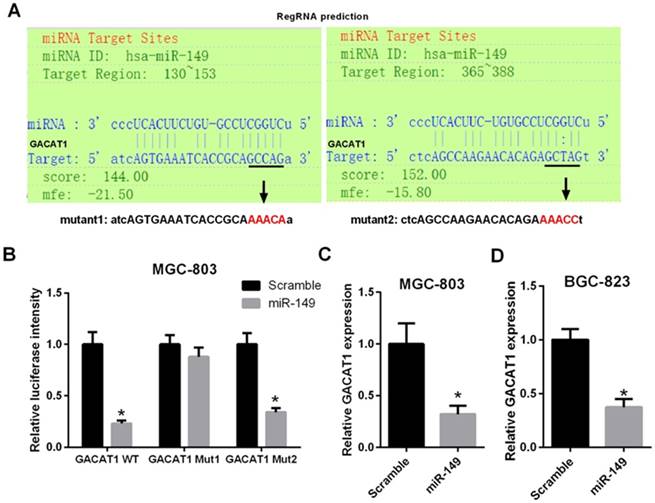
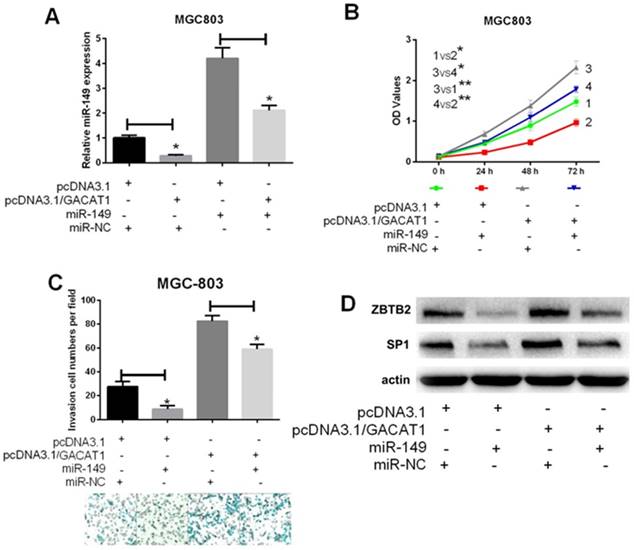
RegRNA was used to predict the interaction between GACAT1 and miR-149. The algorithm identified two putative miR-149 binding sites at the regions of 130-153 and 365-388 of GACAT1 (Fig. 3A). Then, we constructed a wild-type and mutant (mut1 and mut2) GACAT1 luciferase plasmids, which contained miR-149 binding sites. Next, MGC-803 cells were co-transfected with miR-149, wild-type and mutant (mut1 and mut2) GACAT1 luciferase plasmids. Forty-eight hours later, the treated cells were collected for the luciferase assays. MiR-149 significantly reduced the wild-type GACAT1 luciferase activity (P < 0.05, Fig. 3B) but did not affect mutant activity. These results suggested that miR-149 directly interacted with the target site of GACAT1 at the regions of 130-153 and 365-388. Furthermore, we found that overexpress of GACAT1 was found to reduce the expression level of endogenous miR-149 in MGC-803 and SGC-7901 cells (P < 0.05, Fig. 3C and 3D). To further examine whether miR-149 was regulated by GACAT1, we first co-transfected MGC-803 cells with pcDNA3.1/GACAT1 and miR-149. We observed that miR-149 expression was significantly decreased in GACAT1+miR-NC group compared with pcDNA3.1+miR-NC group; miR-149 expression was significantly increased in GACAT1+miR-149 group compared with GACAT1+miR-NC group; miR-149 expression was significantly decreased in GACAT1+miR-149 group compared with pcDNA3.1+ miR-149 group. Therefore, we suggested that the decreased expression of miR-149 caused by the GACAT1 vector could be reversed by miR-149 mimics (Fig. 4A). Importantly, overexpression of miR-149 was able to attenuate the effect of overexpressing GACAT1 on promoting cell proliferation, invasion and migration (Fig. 4B and 4C).
miR-149 downregulates ZBTB2 and SP1 expressions, and inhibits GC cell progression induced by GACAT1
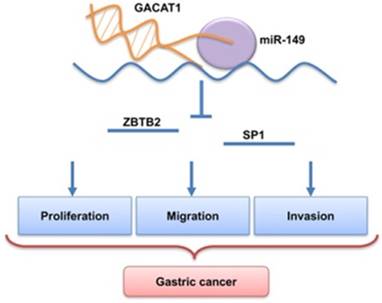
Previous research reported that miR-149 inhibits tumorigenesis by targeting ZBTB2 [20]. It was also found that the transcription factor Sp1 (SP1) was a direct target of miR-149. Therefore, in this study, we performed a Western blot to investigate whether GACAT1 could change the expression levels of ZBTB2 and SP1 through regulating miR-149. The results indicated that the expressions of ZBTB2 and SP1 were upregulated in GACAT1+miR-NC group compared with pcDNA3.1+ miR-NC group; the expressions of ZBTB2 and SP1 were downregulated in GACAT1+miR-149 group compared with GACAT1+miR-NC group. Therefore, we suggested that overexpression of GACAT1 promoted ZBTB2 and SP1 expressions, which may be attributed by miR-149 in GC cells. Indeed, restoring miR-149 was found to repress the protein level of ZBTB2 and SP1 (Fig. 4D). Therefore, miR-149 inhibits GACAT1 expression, and then affects GC cell growth, migration and invasion (Fig. 5).
MiR-149 directly interacts with the target site on GACAT1. (A) Schematic model of the predicted binding sites between GACAT1 and miR-149, including wide-type and mutant binding sequence in GACAT1. (B) Luciferase reporter assays was performed in MGC-803 cells co-transfected with wild-type or mutant GACAT1 along with miR-149 (*P < 0.05). (C, D) The expression level of miR-149 was analyzed by qRT-PCR assay in treated MGC-803 cells and SGC-7901 cells (*P < 0.05).
miR-149 downregulates ZBTB2 and SP1 expressions, and inhibits GC cell progression induced by GACAT1. MGC-803 cells were transfected with pcDNA3.1/GACAT1 or pcDNA3.1 simultaneously with miR-149 mimics or the miR-control, respectively. (A) The relative expression level of miR-149 was detected by qRT-PCR assay (*P < 0.05). (B) MTT assay was used to measure the proliferation ability (*P < 0.05). (C) Transwell assay was used to measure the invasion ability (*P < 0.05). (D) Western blot assay was used to the protein expression levels of ZBTB2 and SP1. (E) miR-149 inhibits GACAT1 expression, and then affected GC cell growth, migration and invasion.
A model of mechanism of lncRNA GACAT1 promotes gastric cancer cell proliferation, invasion and migration through the miR-149-mediated regulation of ZBTB2 and SP1
Discussion
Recently, lncRNAs have been implicated as vital factors in carcinogenesis and cancer progression; however, the potential function(s) and mechanistic details of most lncRNAs in human cancers remain unclear. Research has shown that lncRNA GACAT1 was upregulated in GC tissues compared with paracancerous tissues (Fold change = 4.1, P = 0.008) [19]. While, previous research has also indicated that AC096655.1-002 was significantly downregulated in GC tissues compared with paracancerous tissues (P < 0.001, lncRNA AC096655.1-002 has been officially named as GACAT1) [21-22]. In our study, we reconfirmed that lncRNA GACAT1 was upregulated 57 GC tissues and GC cells. In addition, we also revealed that the knockdown of GACAT1 significantly suppressed GC cell proliferation, invasion and migration, whereas the overexpression of GACAT1 had the opposite effect. These findings suggest that GACAT1 acts as an oncogene in GC, and its overexpression contributes to GC tumorigenesis and progression. The reason of the contradiction may be because molecular expression is specific at different stages of cancer. It also may be explained by the different role of GACAT1 in different subtype of GC. However, additional studies are needed to further verify this observation in the prognostic and therapeutic effects of GACAT1 in GC in vitro and in vivo.
Furthermore, we identified that miR-149 directly interacted with the target site on GACAT1 through bioinformatics prediction software and a luciferase report assay. To clarify the functional roles of GACAT1 and miR-149 in regulating GC cell proliferation, invasion and migration, two independent GC cell lines were used. Functional assays demonstrated that GACAT1 regulates GC cell proliferation, invasion and migration. Importantly, we demonstrated that the overexpression of miR-149 could restore the phenotypes that are altered by GACAT1 overexpression.
To date, the role of miR-149 in cancer development remains controversial [23,24,25,26]. On the one hand, miR-149 can act as a tumor suppressor by targeting certain oncogenes. For example, miR-149 inhibits breast cancer cell carcinogenesis by directly targeting GIT1 [27], and miR-149 also inhibits U251 cell tumorigenesis by regulating p-AKT1, PCNA, CyclinD1 and MMP-2[28]. Furthermore, miR-149 acts as an EMT suppressor by directly targeting Forkhead box M1 (FOXM1) in NSCLC cells [29], and MiR-149 has been found to target ZBTB2 in GC [20]. On the other hand, miR-149 could function as an oncogene in other types of cancers, including nasopharyngeal carcinomas (NPC) [30] and melanomas [24]. However, the relevance of miR-149 and lncRNAs in GC is still unknown. Herein, we showed that miR-149 is significantly decreased in GC cell lines and tumor tissues, compared with normal controls. Our study also demonstrated the tumor-suppressing role of miR-149 in GC cells. We also investigated a new role of miR-149 wherein it acts as a downstream regulator of GC progress.
ZBTB2 belongs to the POK family of transcription factors, which participate in the ARF-HDM2-p53-p21 signaling pathway [31], and Sp1 has been investigated as a sequence-specific DNA-binding protein that regulates many downstream genes [32]. ZBTB2 and Sp1 have been shown to be direct targets of miR-149 [33]. In our research, we confirmed that miR-149 directly reduced the protein levels of ZBTB2 and SP1 in GC cell lines, and this regulation was itself regulated by GACAT1. Taken together, we concluded that GACAT1 promotes GC cell proliferation, invasion and migration through the miR-149-mediated regulation of ZBTB2 and SP1.
In this study, we established a signaling system involving GACAT1, miR-149, ZBTB2 and SP1 in the regulation of the tumorigenesis of GC cells. Our results can be summarized by the following major findings. 1) lncRNA GACAT1 was increased in GC tissues, and thus, it may be a positive prognostic molecular marker for patients with GC. 2) The effects of GACAT1 on GC cell proliferation, invasion and migration indicate that GACAT1 exhibits oncogenic effects on GC tumorigenesis and progression. 3) We demonstrated that miR-149 directly interacted with the target site on GACAT1. 4) We showed that miR-149 decreased ZBTB2 and SP1 expressions which were induced by GACAT1 in GC cells. Taken together, our results may provide the basis for a new therapeutic approach to GC treatments that target the lncRNA GACAT1/miR-149 axis. However, further studies are needed to perform to testify the roles of GACAT1 on the occurrence and development progresses of GC by miR-149 in different GC cells in vitro and the animal model of GC in vivo.
In our study, we also found that GACAT1 significantly downregulated miR-149 expression, the possible mechanism was that GACAT1 affects a certain transcription factor, and then regulates miR-149 expression. In our study, we will further explore this hypothesis.
Acknowledgements
The current study was supported by grants from the Science Project of Sichuan Province (NO. 2016SZ0059).
Competing Interests
The authors have declared that no competing interest exists.
References
1. Patel TN, Roy S, Ravi R. Gastric cancer and related epigenetic alterations. Ecancermedicalscience. 2017;11:714
2. Inui N. Antiemetic therapy for non-anthracycline and cyclophosphamide moderately emetogenic chemotherapy. Medical oncology. 2017;34:77
3. Carl-McGrath S, Lendeckel U, Ebert M, Roessner A, Rocken C. The disintegrin-metalloproteinases ADAM9, ADAM12, and ADAM15 are upregulated in gastric cancer. International journal of oncology. 2005;26:17-24
4. Xiao Q, Li L, Xie Y. et al. Transcription factor E2F-1 is upregulated in human gastric cancer tissues and its overexpression suppresses gastric tumor cell proliferation. Cellular oncology: the official journal of the International Society for Cellular Oncology. 2007;29:335-349
5. Yang YQ, Zhang LJ, Dong H. et al. Upregulated expression of S100A6 in human gastric cancer. Journal of digestive diseases. 2007;8:186-193
6. Cheng YY, Jin H, Liu X. et al. Fibulin 1 is downregulated through promoter hypermethylation in gastric cancer. British journal of cancer. 2008;99:2083-2087 2008
7. Wang LJ, Jin HC, Wang X. et al. ZIC1 is downregulated through promoter hypermethylation in gastric cancer. Biochemical and biophysical research communications. 2009;379:959-963
8. Liu Z, Wang X, Lu Y. et al. Expression of 15-PGDH is downregulated by COX-2 in gastric cancer. Carcinogenesis. 2008;29:1219-1227
9. Song HJ, Myung SJ, Kim IW. et al. 15-hydroxyprostaglandin dehydrogenase is downregulated and exhibits tumor suppressor activity in gastric cancer. Cancer investigation. 2011;29:257-265
10. Tian J, Hu X, Gao W. et al. Identification of the long noncoding RNA LET as a novel tumor suppressor in gastric cancer. Molecular medicine reports. 2017;15:2229-2234
11. Chen YL, Xu QP, Guo F, Guan WH. MicroRNA-302d downregulates TGFBR2 expression and promotes hepatocellular carcinoma growth and invasion. Experimental and therapeutic medicine. 2017;13:681-687
12. Liu Y, Sun Y, Zhao A. MicroRNA-134 suppresses cell proliferation in gastric cancer cells via targeting of GOLPH3. Oncology reports. 2017;37:2441-2448
13. Winter J, Jung S, Keller S, Gregory RI, Diederichs S. Many roads to maturity: microRNA biogenesis pathways and their regulation. Nature cell biology. 2009;11:228-234
14. Zhang Y, Zhu X, Zhu X. et al. MiR-613 suppresses retinoblastoma cell proliferation, invasion, and tumor formation by targeting E2F5. Tumour biology: the journal of the International Society for Oncodevelopmental Biology and Medicine. 2017;39:1010428317691674
15. Ge X, Gong L. MiR-590-3p suppresses hepatocellular carcinoma growth by targeting TEAD1. Tumour biology: the journal of the International Society for Oncodevelopmental Biology and Medicine. 2017;39:1010428317695947
16. Nesterova TB, Barton SC, Surani MA, Brockdorff N. Loss of Xist imprinting in diploid parthenogenetic preimplantation embryos. Developmental biology. 2001;235:343-350
17. Tano K, Akimitsu N. Long non-coding RNAs in cancer progression. Frontiers in genetics. 2012;3:219
18. Wapinski O, Chang HY. Long noncoding RNAs and human disease. Trends in cell biology. 2011;21:354-361
19. Xia T, Liao Q, Jiang X. et al. Long noncoding RNA associated-competing endogenous RNAs in gastric cancer. Sci Rep. 2014;4:6088
20. Wang Y, Zheng X, Zhang Z. et al. MicroRNA-149 inhibits proliferation and cell cycle progression through the targeting of ZBTB2 in human gastric cancer. PloS one. 2012;7:e41693
21. Sun W, Wu Y, Yu X. et al. Decreased expression of long noncoding RNA AC096655.1-002 in gastric cancer and its clinical significance. Tumour Biol. 2013;34:2697-2701
22. Xiao B, Guo J. Long noncoding RNA AC096655.1-002 has been officially named as gastric cancer-associated transcript 1, GACAT1. Tumour Biol. 2013;34:3271
23. Lin RJ, Lin YC, Yu AL. miR-149* induces apoptosis by inhibiting Akt1 and E2F1 in human cancer cells. Molecular carcinogenesis. 2010;49:719-727
24. Jin L, Hu WL, Jiang CC. et al. MicroRNA-149*, a p53-responsive microRNA, functions as an oncogenic regulator in human melanoma. Proceedings of the National Academy of Sciences of the United States of America. 2011;108:15840-15845
25. Liu H, Brannon AR, Reddy AR. et al. Identifying mRNA targets of microRNA dysregulated in cancer: with application to clear cell Renal Cell Carcinoma. BMC systems biology. 2010;4:51
26. Li D, Chen P, Li XY. et al. Grade-specific expression profiles of miRNAs/mRNAs and docking study in human grade I-III astrocytomas. Omics: a journal of integrative biology. 2011;15:673-682
27. Chan SH, Huang WC, Chang JW. et al. MicroRNA-149 targets GIT1 to suppress integrin signaling and breast cancer metastasis. Oncogene. 2014;33:4496-4507
28. Pan SJ, Zhan SK, Pei BG, Sun QF, Bian LG, Sun BM. MicroRNA-149 inhibits progression of glioma cells via blockade of AKT1 signaling. International journal of immunopathology and pharmacology. 2012;25:871-881
29. Ke Y, Zhao W, Xiong J, Cao R. miR-149 Inhibits Non-Small-Cell Lung Cancer Cells EMT by Targeting FOXM1. Biochemistry research international. 2013;2013:506731
30. Luo Z, Zhang L, Li Z. et al. An in silico analysis of dynamic changes in microRNA expression profiles in stepwise development of nasopharyngeal carcinoma. BMC medical genomics. 2012;5:3
31. Jeon BN, Choi WI, Yu MY. et al. ZBTB2, a novel master regulator of the p53 pathway. The Journal of biological chemistry. 2009;284:17935-17946
32. Suske G. The Sp-family of transcription factors. Gene. 1999;238:291-300
33. He X, He Y, Xi B. et al. LncRNAs expression in preeclampsia placenta reveals the potential role of LncRNAs contributing to preeclampsia pathogenesis. PLoS One. 2013;8:e81437
Author contact
![]() Corresponding authors: Yimin Hua, West China Second University Hospital, Sichuan University, Chengdu, China (e-mail: nathan_huacom) and Xiaoqing Shi, West China Second University Hospital, Sichuan University, Chengdu, China (e-mail:shixiaoqingedu.cn)
Corresponding authors: Yimin Hua, West China Second University Hospital, Sichuan University, Chengdu, China (e-mail: nathan_huacom) and Xiaoqing Shi, West China Second University Hospital, Sichuan University, Chengdu, China (e-mail:shixiaoqingedu.cn)

 Global reach, higher impact