3.2
Impact Factor
ISSN: 1837-9664
J Cancer 2018; 9(21):3912-3922. doi:10.7150/jca.25900 This issue Cite
Research Paper
Identifying a Novel Biomarker TOP2A of Clear Cell Renal Cell Carcinoma (ccRCC) Associated with Smoking by Co-Expression Network Analysis
1. Department of Urology, Zhongnan Hospital of Wuhan University, Wuhan, China
2. Department of Biological Repositories, Zhongnan Hospital of Wuhan University, Wuhan, China
3. Laboratory of Precision Medicine, Zhongnan Hospital of Wuhan University, Wuhan, China
4. Human Genetics Resource Preservation Center of Hubei Province, Wuhan, China
5. Department of Pathology, Lombardi Comprehensive Cancer Center, Georgetown University Medical School, Washington DC, USA
Received 2018-3-6; Accepted 2018-8-26; Published 2018-10-10
Abstract
Although it is well known that smoking is one of pathogenesis of clear cell renal cell carcinoma (ccRCC), the underlying molecular mechanism is still unclear. In our study, the microarray dataset GSE46699 is analyzed by weighted gene co-expression network analysis (WGCNA). Then we identify 15 co-expressed gene modules in which the lightcyan module (R2 = 0.30) is the most significant. Combined with the protein-protein interaction (PPI) network and WGCNA, two hub genes are identified. Meanwhile, linear regression analyses indicate that TOP2A has a higher connection with smoking in ccRCC, survival analysis proved that overexpression of TOP2A in ccRCC could lead to shorter survival time. Furthermore, bioinformatical analyses based on GSE46699 and GSE2109 as well as qRT-PCR experiment show similar results that TOP2A is significantly up-regulated in smoking ccRCC compared to non-smoking ccRCC samples. In addition, Functional analysis, pathway enrichment analysis and gene set enrichment analysis (GSEA) indicate that high expression of TOP2A is related to cell cycle and p53 signaling pathway in ccRCC samples. Moreover, in vitro experiments revealed that TOP2A induced cell cycle arrest at G2 phase and proliferation inhibition via p53 phosphorylation. Taken together, by using WGCNA, we have identified a novel biomarker named TOP2A, which could affect the development of smoking-related ccRCC by regulating cell cycle and p53 signaling pathway.
Keywords: weighted gene co-expression network analysis (WGCNA), TOP2A, biomarker, smoking, clear cell renal cell carcinoma (ccRCC)
Introduction
Renal cell carcinoma is the third most frequent urological malignant neoplasms worldwide, among which, clear cell renal cell carcinoma (ccRCC) accounts for approximately 80-90% [1]. It is estimated that about 14,400 deaths and 63,990 new cases associated with renal cell carcinoma occur during 2017 in the U.S [2]. Smoking, hypertension, and obesity are proven to be the high risk of renal cell carcinoma [3,4]. Among these, smoking increases renal cell carcinoma risk by 54% in men and by 22% in women [5]. Therefore, it is urgent to identify the molecular mechanism of ccRCC associated with smoking to understand the pathogenesis of smoking-related ccRCC and to find a novel biomarker for early diagnosis and treatment.
The breakthrough in sequencing of cancer genomes make great contribute to reveal the potential pathological mechanisms in various cancers [6].
The description of GSE46699, GSE2109 and GSE10072.
| GEO Dataset | Platform | Tumor type | Total samples | Non-smoking samples | Smoking samples | Normal samples | Tumor samples |
|---|---|---|---|---|---|---|---|
| GSE46699 | Affymetrix Human Genome U133 Plus 2.0 Array | ccRCC | 130 | 84 | 46 | 63 | 67 |
| GSE2109 | Affymetrix Human Genome U133 Plus 2.0 Array | ccRCC | 283 | 140 | 143 | - | 283 |
| GSE10072 | Affymetrix Human Genome U133A Array | LUAD | 107 | 31 | 76 | 49 | 58 |
However, few studies concentrate on the interrelated genes which may have similar function. Weighted gene co-expression network analysis (WGCNA) is a system biology approach which has been widely applied to identifying the hub genes associated with clinical features in various cancer [7,8]. According to the gene expression profiles, WGCNA can construct a gene co-expression network and divide the co-expressed genes into different modules. After that, WGCNA can find the most related module with clinical traits and identify the most central genes among it [9].
In this study, we utilized WGCNA to identify hub genes of ccRCC associated with smoking, which may decipher the potential mechanisms between smoking and ccRCC.
Material and Methods
Study design and collection of microarray data
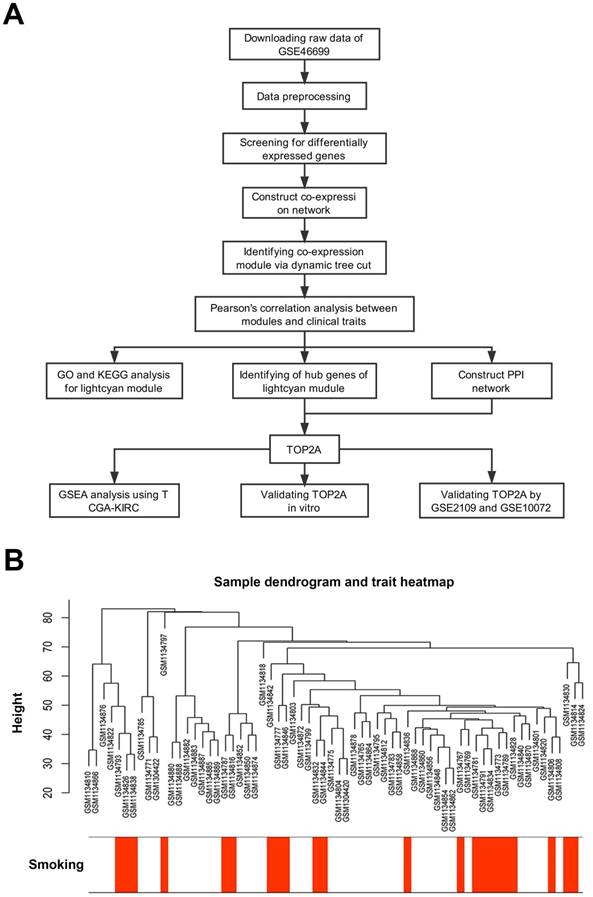
First, we designed a flow chart to understand the whole process of the study (Figure 1A). The raw data of GSE46699 was obtained from the Gene Expression Omnibus database (http://www.ncbi.nlm.nih.gov/geo/) and was annotated according to the Affymetrix Human Genome U133 Plus 2.0 Array platform (Affymetrix, Santa Clara, CA, USA). This dataset contained 130 samples, including 40 non-smoking normal samples, 44 non-smoking tumor samples, 23 smoking normal samples, 23 smoking tumor samples. Moreover, another two datasets GSE2109 and GSE10072 were downloaded to validate the results. The description of GSE46699, GSE2109 and GSE10072 were listed in Table 1.
Data preprocessing
Robust Multiarray Averaging (RMA) background correction, log2 transformed and quantile normalization were sequentially utilized to process the raw expression data. Then, the ''affy'' R package and Affymetrix annotation files were used to summarize and annotate the probes respectively. Besides, sample clustering was applied to evaluate the quality of GSE46699 (Figure 1B). Test sets GSE2109 and GSE10072 were performed the same data preprocessing.
Screening for differentially expressed genes
The limma R package, based on empirical Bayes methods and linear models, was used to find DEGs between smoking and non-smoking ccRCC samples. The DEGs threshold was set at a false discovery rate (FDR) < 0.05 and |log2 fold change (FC)| > 0.585 to be further analyzed.
Constructing gene co-expression network
Before we utilized the “WGCNA” package to construct the scale-free gene co-expression network [10,11], we first verified the qualification of DEGs. Then, Pearson's correlation matrices were conducted and a weighted adjacency matrix were performed by a formula amn = |cmn|β (cmn represents Pearson's correlation between genes, amn represents adjacency between genes, the β parameter could magnify the correlation between genes). An appropriate power of β was chosen on basis of standard scale-free networks. Subsequently, we transformed the adjacency into topological overlap matrix (TOM) [12] and identified modules including similar genes by hierarchically clustering genes [13].
Discovering module of interest
We first defined module eigengenes (MEs) as the most principal component and summarize all genes into a single characteristic expression profile. Then, the interested module was identified by calculating the relevance between MEs and smoking. After that, the log10 transformation of the P value was defined as gene significance (GS) and the average GS for all genes in the module was defined as the module significance (MS). Finally, the module with the highest MS score was chosen as the one related to smoking.
Identification and validation of hub genes
Genes in the interested module with module membership > 0.8 and gene significance > 0.2 were defined as hub gene. Then, we constructed protein-protein interaction (PPI) networks and screen hub nodes through mapping all genes to the Cytoscape v3.4.0 software (http://cytoscape.org/) [14] and the Search Tool for the Retrieval of Interacting Genes (STRING, http://www.string-db.org/) [15,16]. To screen the most important hub gene, we performed linear regression analysis to observe the relationship between the hub gene and smoking. In orders to further validate the results, we used GSE2109 and GSE10072 datasets to check the relevance between the hub gene and smoking. Furthermore, The Gene Expression Profiling Interactive Analysis (GEPIA, http://gepia.cancer-pku.cn/) was used to validate the expression and prognosis of hub gene [17,18].
Functional enrichment analysis
DEGs in the interested module were put into The Database for Annotation, Visualization and Integrated Discovery (DAVID, https://david.ncifcrc.gov/) [19] to obtain the enriched biological process and KEGG pathway with the cutoff criteria of P < 0.05.
Description of the study. (A) Flow chart of this study. (B) Sample dendrogram and cigarette smoking heatmap (GSE46699).
Gene Set Enrichment Analysis (GSEA)
According to the expression level of the hub gene, we divided 530 samples of ccRCC downloaded from TCGA into two groups. To detect whether the previously defined biological processes and KEGG pathway were enriched in the two groups, we conducted GSEA with the cutoff criteria of FDR < 0.05 [20].
Ethics statement
Human ccRCC tissue samples (n=18) and human paracancerous tissues (n=18) were all collected from patients suffering renal cancer in surgery and were stored in liquid nitrogen for later RNA isolation. The study was approved by the Ethics Committee at Zhongnan Hospital of Wuhan University (approval number: 2015029). All experimental methods were carried out in accordance with the approved guidelines.
Cell culture
Human ccRCC cell line 786-O was purchased from Chinese Academy of Sciences in Shanghai. 786-O was cultured in RPMI-1640 (Gibco, China) medium with 10% fetal bovine serum (FBS, Gibco, Australia) in a humidified atmosphere containing 5% CO2 at 37 °C.
Total RNA isolation and quantitative real time PCR (qRT-PCR)
Total RNA was isolated from kidney tissues by RNeasy Mini Kit (Cat. #74101, Qiagen, Germany). 1 µg of total RNA was used as the template to synthesize first-strand cDNA by utilizing ReverTra Ace qPCR RT Kit (Toyobo, China). All primers were conducted with iQTM SYBR® Green Supermix (Bio-Rad, China) in a final volume of 20 μl with Bio-Rad iCycler (Cat. #CFX96).
Primer sequences of TOP2A (annealing temperature is 60°C): 5'-ACCATTGCAGCCTGTAAATGA-3' (forward); 5'-GGGCGGAGCAAAATATGTTCC-3' (reverse).
Primer sequences of GAPDH (loading control, annealing temperature is 60°C): 5'-GGAGCGAGATCCCTCCAAAAT-3' (forward); 5'-GGCTGTTGTCATACTTCTCATGG-3' (reverse).
Relative gene abundance was calculated from the ΔΔCT values as: 2-ΔΔCT.
Cell transfection and reagents
The three specific small interfering RNAs: siTOP2A-1: 5'-CUCCUAACUUCUAGUAACUTT-3'; siTOP2A-2: 5'-GAUCCACCAAAGAUGUCAATT-3'; siTOP2A-3: 5'-GUCCAGUUAAACAAGAAGUTT-3' against TOP2A were synthesized by Genepharma Ltd. in Suzhou, China. For transfection, Lipofectamine 2000 (Invitrogen, USA) was used as the transfection reagent according to the manufacturer's instructions.
MTT assay
The MTT (methyl thiazolyl tetrazolium, Sigma-Aldrich, MO, USA) assay was used for cell viability measurement in ccRCC cells. After transfection for 48 h, 786-O cells were seeded in 96-well plates (3000 cells per well) in RPMI-1640 medium containing 10% FBS for 5 days. Then, 20 μl of MTT reagent was added to each well for 4 h at 37 °C. After discarding the medium, the precipitates were dissolved by 200 μl of DMSO. The absorbance was measured at 490 nm using a Spectramax M5 spectrophotometer (Molecular Devices, Sunnyvale, USA).
Colony formation assay
After transfection for 48 h, 786-O cells were plated in 6-well plates (800 per well) and cultured for 14 days. Then, surviving colonies (> 50 cells per colony) were fixed by 4% PFA for 30 min, stained with crystal violet and photographed.
Flow cytometry analysis for the alterations of cell cycle
For cell cycle analysis, 786-O cells were harvested and washed by cold PBS for three times after transfection for 48 h. Then, the cells were resuspended with 1× DNA Staining Solution containing propidium iodide and permeabilization solution (Multisciences, China) in the dark. After incubation at 37 °C for 30 min. The sample was analyzed by flow cytometry analysis (Cat. #FC500, Beckman, USA).
Western blot analysis
The RIPA buffer with protease inhibitor and phosphatase inhibitor (Sigma-Aldrich, USA) was used to extract total protein of 786-O cells. We used 10% SDS-PAGE to resolve the total protein and transferred the SDS-PAGE to PVDF membrane (Millipore, USA). Then, membranes were blocked by 5% non-fat milk and incubated with primary antibodies at 4°C for overnight. After washing, secondary antibody was used to incubated the membranes at room temperature for 2 h. Bands were visualized using an enhanced chemiluminescence (ECL) kit (Bio-rad, USA) and detected by BIO-RAD ChemiDoc MP Imaging System (Bio-Rad, USA).
Western blotting was performed using the following antibodies: anti-TOP2A, 1:1000 (Proteintech); anti-CDK1, 1:1000 (Abcam); anti-CDK2, 1:1000 (Abcam ); anti-CCNA1/2, 1:2000 (Abcam); anti-p-TP53, 1:1000 (Abcam); anti-TP53, 1:1000 (Abcam). Blotting membranes were stripped and probed again with anti-GAPDH antibodies (Santa) as a loading control.
Statistical analyses
All analyses were performed at least three times and represented data from three individual experiments. Two-tailed Student's t-tests were used to assess the statistical significance of differences between the groups. Statistical analyses were performed using SPSS 16.0. Statistical significance was considered as a P value < 0.05.
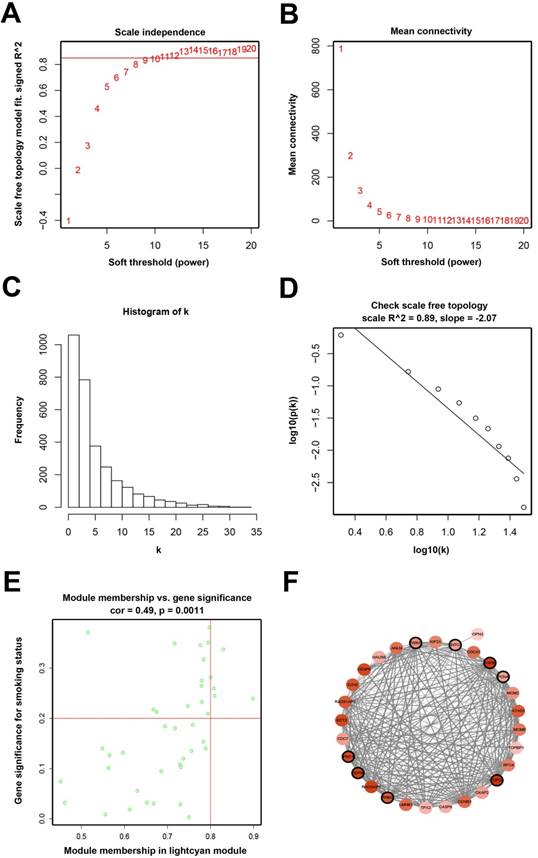
Determination of soft-thresholding power and analysis of hub genes as well as protein-protein interaction network (PPI). (A) Analysis of the scale-free fit index for various soft-thresholding powers (β). (B) Analysis of the mean connectivity for various soft-thresholding powers. (C) Histogram of connectivity distribution when β = 11. (D) Checking the scale-free topology when β = 11. (E) Scatter plot of module eigengenes in lightcyan module. (F) PPI network of genes in the lightcyan module.
Results
Screening for differentially expressed genes (DEGs)
A total of 3053 overlapping DEGs were chosen for further analysis. Among these, 1736 were up-regulated and 1317 were down-regulated.
Constructing co-expression network
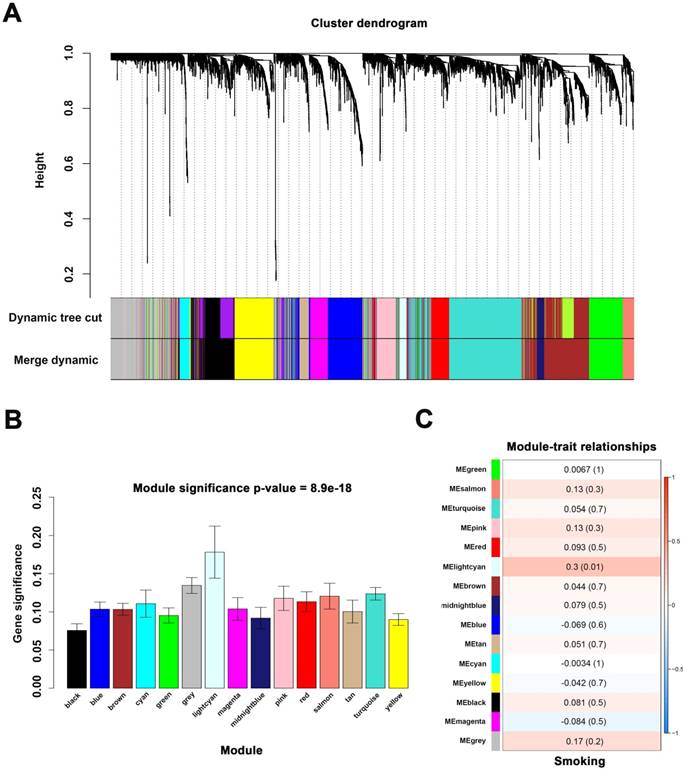
When we set the soft threshold power β to 11 (scale-free R2=0.89), the link between genes in the gene network satisfied a scale-free network distribution (Figure 2A-D). A total of 15 co-expressed modules were identified (Figure 3A).
Finding module of interest
We applied 2 approaches to verify the relevance between each module and smoking. Consequently, the lightcyan module (r = 0.3, P = 0.01) exhibited higher MS and greater connection with smoking (Figure 3B-C) and was identified as the most relevant module.
Identification of hub genes
Seven hub genes (PRC1, TOP2A, SMC4, RACGAP1, CENPK, PAPD4, ECT2) were defined by module connectivity (Figure 2E) and eight hub genes (PRC1, TOP2A, ZWINT, KNTC1, ASPM, PCNA, RRM2, CEP55) were defined as hub nodes (Figure 2F).
Validation of hub genes
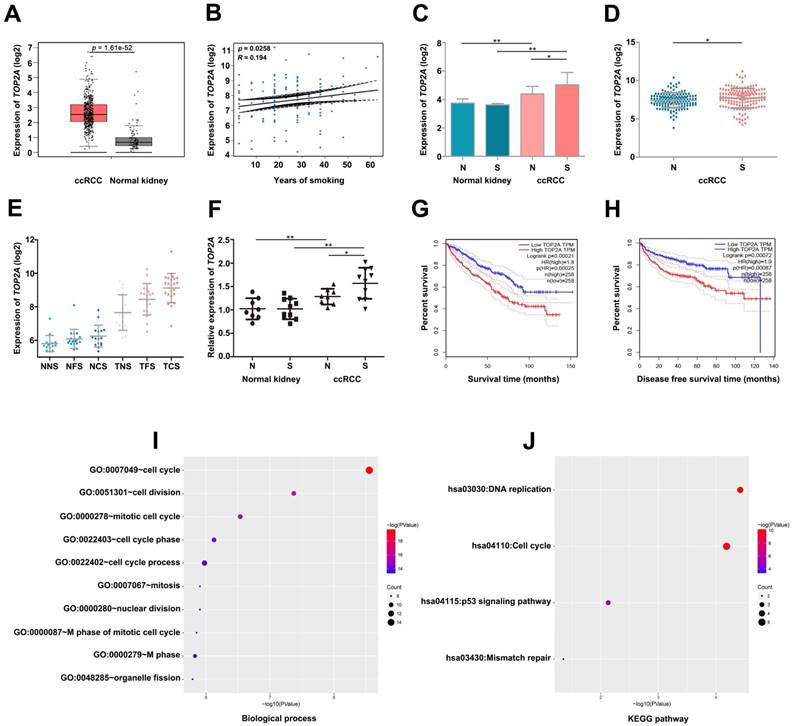
By conducting linear regression analysis with GSE2109, we observed that TOP2A was more relevant to smoking (Figure 4B), and we selected TOP2A as the hub gene. According to GEPIA database, we found TOP2A were more highly expressed in ccRCC samples (Figure 4A). Meanwhile, GSE2109 and GSE46699 showed that TOP2A was significantly overexpressed in smoking ccRCC than non-smoking ccRCC samples (Figure 4C, D). Interestingly, GSE10072 also proved the positive correlation between the expression of TOP2A and smoking in lung adenocarcinoma (Figure 4E). The P value of Figure 4E was listed in Table 2. More convincingly, the qRT-PCR experiment revealed that TOP2A was obviously up-regulated in smoking ccRCC patients as well (Figure 4F). In addition, the survival analysis uncovered that up-regulation of TOP2A had an obviously shorter overall survival time and disease-free survival time (Figure 4G- H).
Functional Enrichment Analysis
Biological process (BP) in the lightcyan module was found to focus on cell cycle, cell division, mitotic cell cycle, cell cycle phase and cell cycle process (Figure 4I). KEGG pathway enrichment analysis showed DNA replication, cell cycle and p53 signaling pathway were significantly enriched in lightcyan module (Figure 4J).
The P value of the GSE10072 in Figure 4E.
| Smoking status | Mean±SD | Smoking status | Mean±SD | P | |
|---|---|---|---|---|---|
| NNS | 5.805±0.469 | VS | NFS | 6.088±0.555 | 0.116475331 |
| NNS | 5.805±0.469 | VS | NCS | 6.251±0.631 | 0.00052866 |
| NFS | 6.088±0.555 | VS | NCS | 6.251±0.631 | 0.034655055 |
| NNS | 5.805±0.469 | VS | NFS+NCS | 6.642±0.598 | 0.002130744 |
| TNS | 7.658±1.028 | VS | TFS | 8.451±0.913 | 0.076959943 |
| TNS | 7.658±1.028 | VS | TCS | 9.123±0.851 | 0.001676115 |
| TFS | 8.451±0.913 | VS | TCS | 9.123±0.851 | 0.148011761 |
| TNS | 7.658±1.028 | VS | TNS+TCS | 8.835±0.939 | 0.003132606 |
| NNS+NFS+ NCS | 6.054±0.585 | VS | TNS+TFS+ TCS | 8.510±1.098 | 1.95169E-25 |
Identify modules associated with the smoking of ccRCC. (A) Dendrogram of all differentially expressed genes clustered. (B) Distribution of average gene significance in the modules associated with smoking of ccRCC. (C) The correlation between module eigengenes and the smoking group.
Validate the relationship between TOP2A and smoking ccRCC samples. (A) TOP2A is significantly overexpressed in the ccRCC according to GEPIA database. (B) Linear regression analysis between the expressions of TOP2A and smoking group. (C) The expression of TOP2A is correlated with smoking of ccRCC in GSE46699 (N represents non-smoking patients, S represents smoking patients). (D) TOP2A expression is correlated with smoking of ccRCC in GSE2109. (E) TOP2A expression is positive correlation with smoking status in lung adenocarcinoma in GSE10072 (NNS: Normal never smoked, NFS: Normal former smoker, NCS: Normal current smoker, TNS: Tumor never smoked, TFS: Tumor former smoker, TCS: Tumor current smoker). (F) qRT-PCR indicates the expression of TOP2A is up-regulated in smoking ccRCC tissues. (G-H) Kaplan-Meier survival curve downloaded from GEPIA database demonstrate that up-regulation of TOP2A have a significantly shorter overall survival time and disease-free survival time. (I) Biological processes and (J) KEGG pathway enrichment analysis of TOP2A.
Gene Set Enrichment Analysis (GSEA)
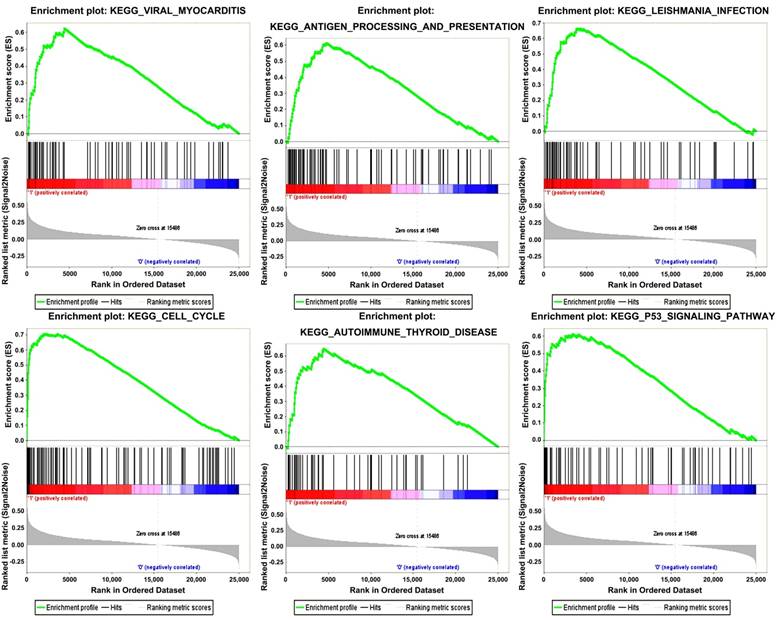
Six gene sets (cell cycle, leishmanial infection, antigen processing and presentation, autoimmune thyroid disease, viral myocarditis and p53 signaling pathway) were enriched in samples with highly expressed TOP2A by conducting GSEA (Figure 5).
Knockdown of TOP2A inhibited cell proliferation by triggered cell cycle arrest at G2 phase in ccRCC cell
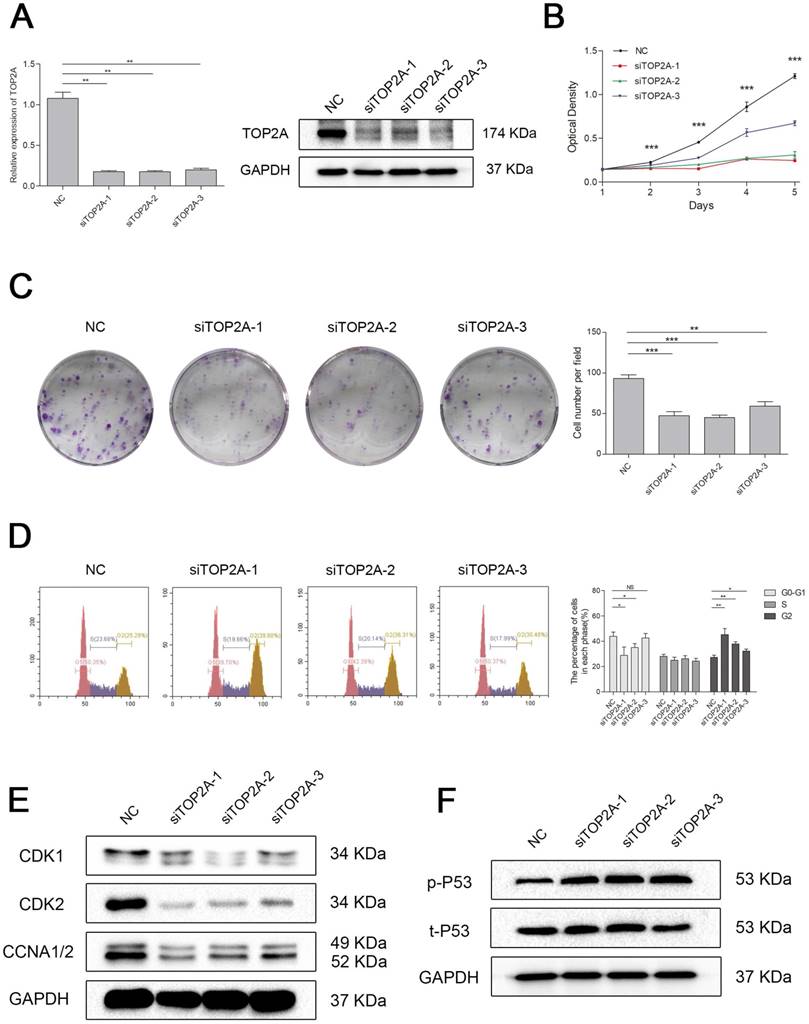
To explore the biological role of TOP2A in ccRCC, we established a model of TOP2A deficiency in 786-O cell line. The knockdown efficiency of the siRNAs was validated by qRT-PCR and Western blot analysis (Figure 6A). MTT assay revealed that downregulation of TOP2A inhibited the cell proliferation significantly comparing with the NC group (Figure 6B). This uncovered that silencing TOP2A inhibited the proliferative capacity of ccRCC cell. The colony formation assays demonstrated a similar conclusion (Figure 6C). Flow cytometry analysis also showed that knockdown of TOP2A triggered cell cycle arrest at G2 phase (Figure 6D). Indeed, cell cycle related proteins such as Cyclin A1/2 and CDK1/2 were significantly decreased in the ccRCC cell in TOP2A knockdown group (Figure 6E). Moreover, TOP2A deficiency strongly induced phosphorylated p53 in ccRCC cells (Figure 6F).
Discussion
In our study, the lightcyan module associated with smoking of ccRCC was identified by applying WGCNA. Seven hub genes were obtained from the module. Then, we constructed PPI networks and found that PRC1 and TOP2A were both hub genes in PPI network and WGCNA. Furthermore, linear regression analyses indicated that TOP2A was the most correlated hub gene with the smoking ccRCC samples. The GEPIA database indicated that TOP2A was significantly overexpressed and resulted in poorer prognosis in ccRCC samples.
TOP2A encodes topoisomerase 2-alpha, an enzyme that plays a key role in the topologic states of DNA during replication and transcription, which is essential for chromosome condensation and segregation [21]. Our group had revealed TOP2A played a critical role in ccRCC carcinogenesis and progression, involving in the biological process of ccRCC proliferation [22,23]. Meanwhile, two publications suggested that TOP2A is overexpressed in colorectal cancer and hepatocellular carcinoma [24,25], and overexpression of TOP2A was presumed to inhibit cell proliferation in colorectal cancer [26]. What's more, several investigators have reported that TOP2A is an independent prognostic biomarker in various cancer, such as nasopharyngeal carcinoma, breast cancer, pancreatic cancer and renal cell carcinoma [27-30].
Given that a cigarette contains approximately 50 chemicals that are associated with carcinogenesis [31], it is not surprising that cigarette smoking is one of an etiology of renal cell carcinoma. In fact, the relationship between cigarette smoking and the development of renal cell carcinoma has been widely recognized, and previous reports demonstrated that overall survival time was significantly shorter in renal cell carcinoma patients who smoke [32-34].
Gene set enrichment analysis (GSEA). “Viral myocarditis”, “Antigen processing and presentation”, “Leishmania infection”, “Cell cycle”, “Autoimmune Thyoid disease”, “P53 signaling pathway” were enriched in ccRCC samples with TOP2A highly expressed.
Downregulation of TOP2A inhibited cell proliferation by triggered cell cycle arrest at G2 phase in ccRCC cells. (A) The expression of TOP2A in transcriptional level (upper picture) and translation level (lower picture) by treating with siTOP2A-1, siTOP2A-2 and siTOP2A-3 in 786-O cell line. The proliferative capacity was measured by (B) MTT assay and (C) colony formation assays in 786-O cell line. (D) Flow cytometry analysis of TOP2A deficiency group and NC group in 786-O cell line. (E) Cell cycle related proteins such as Cyclin A1/2 and CDK1/2 were significantly decreased in the 786-O cell line in TOP2A knockdown group. (F) TOP2A deficiency strongly induced phosphorylated p53 in 786-O cell line.
It is noteworthy that many researchers have concentrated on elucidating the potential molecular mechanism of smoking-related lung cancer [35-37]. However, there is little progress in illustrating the specific underlying molecular alterations triggered by cigarette smoking in the development of ccRCC. Our study unveiled that TOP2A was significantly up-regulated in smoking ccRCC samples in GSE46699 and GSE2109 datasets, which was consistent with the positive correlation between TOP2A and smoking status in lung adenocarcinoma in GSE10072 dataset. Moreover, the result of qRT-PCR experiment revealed that TOP2A was significantly up-regulated in smoking ccRCC than non-smoking ccRCC samples. More importantly, in vitro experiments uncovered that TOP2A inhibited the proliferative capacity and induced cell cycle arrest at G2 phase via p53 phosphorylation.
To explain how TOP2A accelerated the tumorigenesis of ccRCC related to cigarette smoking, we conducted KEGG pathway enrichment analyses and GSEA. Combined with the results of the two methods, we speculated that the potential pathways influenced by TOP2A were cell cycle and p53 signaling pathway. It has been proved that cell cycle pathway can regulate the proliferation of colorectal cancer and lung adenocarcinoma [38,39]. Additionally, many researchers have uncovered that p53 signaling pathway is essential to carcinogenesis, proliferation, apoptosis, and progression [40-42]. Interestingly, Mizuno S. et al. [43] indicated p53 signaling pathway was important for the pathogenesis of smoking-related emphysematous changes. In addition, synchronous double primary lung cancers have been reported to be induced by heavy smoking via p53 pathway [44]. Taken all of these evidences into account, TOP2A is likely to be a potential key gene in the development of smoking-related ccRCC by regulating cell cycle and p53 signaling pathway.
The major limitation of our study is lack of adequate evidence in illustrating the specific pathway of smoking-related ccRCC regulated by TOP2A. Further experiments in mRNA and protein levels are needed. A large-scale epidemiological survey of the relationship between smoking and ccRCC may be helpful to verify our results.
In conclusion, we used WGCNA, PPI network, GSEA and qRT-PCR to identify and validate the hub gene of ccRCC associated with cigarette smoking. TOP2A was identified to be a potential biomarker of ccRCC associated with cigarette smoking by regulating cell cycle signaling and p53 signaling pathway. In future, TOP2A may be used to assist in the diagnosis of ccRCC in smoking patients.
Acknowledgements
The excellent technical assistance of Danni Shan is gratefully acknowledged. We also would like to acknowledge the KEGG database developed by Kanehisa Laboratories. This study was supported in part by grants from the Hubei Province Health and Family Planning Scientific Research Project [grant number WJ2017H0002], Wuhan Clinical Cancer Research Center of Urology and Male Reproduction [grant number 303-230100055] and National Natural Science Foundation of China [grant number 81772730]. The funders had no role in study design, data collection and analysis, decision to publish, or preparation of the manuscript.
Competing Interests
The authors have declared that no competing interest exists.
References
1. Torre LA, Bray F, Siegel RL. et al. Global cancer statistics, 2012. CA Cancer J Clin. 2015;65:87-108
2. Siegel RL, Miller KD, Jemal A. Cancer Statistics, 2017. CA Cancer J Clin. 2017;67:7-30
3. Hunt JD, van der Hel OL, McMillan GP. et al. Renal cell carcinoma in relation to cigarette smoking: meta-analysis of 24 studies. Int J Cancer. 2005;114:101-08
4. Chow WH, Gridley G, Fraumeni JJ. et al. Obesity, hypertension, and the risk of kidney cancer in men. N Engl J Med. 2000;343:1305-11
5. Doehn C, Grunwald V, Steiner T. et al. The Diagnosis, Treatment, and Follow-up of Renal Cell Carcinoma. Dtsch Arztebl Int. 2016;113:590-96
6. Stratton MR, Campbell PJ, Futreal PA. The cancer genome. Nature. 2009;458:719-24
7. He Z, Sun M, Ke Y. et al. Identifying biomarkers of papillary renal cell carcinoma associated with pathological stage by weighted gene co-expression network analysis. Oncotarget. 2017;8:27904-14
8. Liu X, Hu AX, Zhao JL. et al. Identification of Key Gene Modules in Human Osteosarcoma by Co-Expression Analysis Weighted Gene Co-Expression Network Analysis (WGCNA). J Cell Biochem. 2017
9. Giulietti M, Occhipinti G, Principato G. et al. Weighted gene co-expression network analysis reveals key genes involved in pancreatic ductal adenocarcinoma development. Cell Oncol (Dordr). 2016;39:379-88
10. Horvath S, Dong J. Geometric interpretation of gene coexpression network analysis. PLoS Comput Biol. 2008;4:e1000117
11. Mason MJ, Fan G, Plath K. et al. Signed weighted gene co-expression network analysis of transcriptional regulation in murine embryonic stem cells. BMC Genomics. 2009;10:327
12. Yip AM, Horvath S. Gene network interconnectedness and the generalized topological overlap measure. BMC Bioinformatics. 2007;8:22
13. Ravasz E, Somera AL, Mongru DA. et al. Hierarchical organization of modularity in metabolic networks. Science. 2002;297:1551-55
14. Shannon P, Markiel A, Ozier O. et al. Cytoscape: a software environment for integrated models of biomolecular interaction networks. Genome Res. 2003;13:2498-504
15. Szklarczyk D, Franceschini A, Wyder S. et al. STRING v10: protein-protein interaction networks, integrated over the tree of life. Nucleic Acids Res. 2015;43:D447-52
16. Franceschini A, Lin J, von Mering C. et al. SVD-phy: improved prediction of protein functional associations through singular value decomposition of phylogenetic profiles. Bioinformatics. 2016;32:1085-87
17. Uhlen M, Fagerberg L, Hallstrom BM. et al. Proteomics. Tissue-based map of the human proteome. Science. 2015;347:1260419
18. Tang Z, Li C, Kang B. et al. GEPIA: a web server for cancer and normal gene expression profiling and interactive analyses. Nucleic Acids Res. 2017;45(W1):W98-W102
19. Huang DW, Sherman BT, Lempicki RA. Systematic and integrative analysis of large gene lists using DAVID bioinformatics resources. Nat Protoc. 2009;4:44-57
20. Croken MM, Qiu W, White MW. et al. Gene Set Enrichment Analysis (GSEA) of Toxoplasma gondii expression datasets links cell cycle progression and the bradyzoite developmental program. BMC Genomics. 2014;15:515
21. Tarpgaard LS, Qvortrup C, Nygard SB. et al. A phase II study of Epirubicin in oxaliplatin-resistant patients with metastatic colorectal cancer and TOP2A gene amplification. BMC Cancer. 2016;16:91
22. Yuan L, Zeng G, Chen L. et al. Identification of key genes and pathways in human clear cell renal cell carcinoma (ccRCC) by co-expression analysis. Int J Biol Sci. 2018;14:266-79
23. Yuan L, Chen L, Qian K. et al. Co-expression network analysis identified six hub genes in association with progression and prognosis in human clear cell renal cell carcinoma (ccRCC). Genom Data. 2017;14:132-40
24. Coss A, Tosetto M, Fox EJ. et al. Increased topoisomerase IIalpha expression in colorectal cancer is associated with advanced disease and chemotherapeutic resistance via inhibition of apoptosis. Cancer Lett. 2009;276:228-38
25. Wong N, Yeo W, Wong WL. et al. TOP2A overexpression in hepatocellular carcinoma correlates with early age onset, shorter patients survival and chemoresistance. Int J Cancer. 2009;124:644-52
26. Gao XH, Li J, Liu Y. et al. ZNF148 modulates TOP2A expression and cell proliferation via ceRNA regulatory mechanism in colorectal cancer. Medicine (Baltimore). 2017;96:e5845
27. Lan J, Huang HY, Lee SW. et al. TOP2A overexpression as a poor prognostic factor in patients with nasopharyngeal carcinoma. Tumour Biol. 2014;35:179-87
28. Zheng H, Li X, Chen C. et al. Quantum dot-based immunofluorescent imaging and quantitative detection of TOP2A and prognostic value in triple-negative breast cancer. Int J Nanomedicine. 2016;11:5519-29
29. Chen D, Maruschke M, Hakenberg O. et al. TOP2A, HELLS, ATAD2, and TET3 Are Novel Prognostic Markers in Renal Cell Carcinoma. Urology. 2017;102:261-65
30. Zhou Z, Liu S, Zhang M. et al. Overexpression of Topoisomerase 2-Alpha Confers a Poor Prognosis in Pancreatic Adenocarcinoma Identified by Co-Expression Analysis. Dig Dis Sci. 2017
31. Shields PG. Molecular epidemiology of smoking and lung cancer. Oncogene. 2002;21:6870-76
32. Kroeger N, Klatte T, Birkhauser FD. et al. Smoking negatively impacts renal cell carcinoma overall and cancer-specific survival. Cancer. 2012;118:1795-802
33. Xu Y, Qi Y, Zhang J. et al. The impact of smoking on survival in renal cell carcinoma: a systematic review and meta-analysis. Tumour Biol. 2014;35:6633-40
34. Sunela KL, Kataja MJ, Kellokumpu-Lehtinen PL. Influence of body mass index and smoking on the long-term survival of patients with renal cell cancer. Clin Genitourin Cancer. 2013;11:458-64
35. Arcila ME, Drilon A, Sylvester BE. et al. MAP2K1 (MEK1) Mutations Define a Distinct Subset of Lung Adenocarcinoma Associated with Smoking. Clin Cancer Res. 2015;21:1935-43
36. Improgo MR, Scofield MD, Tapper AR. et al. From smoking to lung cancer: the CHRNA5/A3/B4 connection. Oncogene. 2010;29:4874-84
37. Liu H, Zhou Y, Boggs SE. et al. Cigarette smoke induces demethylation of prometastatic oncogene synuclein-gamma in lung cancer cells by downregulation of DNMT3B. Oncogene. 2007;26:5900-10
38. Ye LC, Chen T, Zhu DX. et al. Downregulated long non-coding RNA CLMAT3 promotes the proliferation of colorectal cancer cells by targeting regulators of the cell cycle pathway. Oncotarget. 2016;7:58931-38
39. Wang G, Wang H, Zhang C. et al. Rac3 regulates cell proliferation through cell cycle pathway and predicts prognosis in lung adenocarcinoma. Tumour Biol. 2016;37:12597-607
40. Yan S, Wang M, Zhao J. et al. MicroRNA-34a affects chondrocyte apoptosis and proliferation by targeting the SIRT1/p53 signaling pathway during the pathogenesis of osteoarthritis. Int J Mol Med. 2016;38:201-09
41. Xiao S, Zhou Y, Yi W. et al. Fra-1 is downregulated in cervical cancer tissues and promotes cervical cancer cell apoptosis by p53 signaling pathway in vitro. Int J Oncol. 2015;46:1677-84
42. Tsai LH, Chen PM, Cheng YW. et al. LKB1 loss by alteration of the NKX2-1/p53 pathway promotes tumor malignancy and predicts poor survival and relapse in lung adenocarcinomas. Oncogene. 2014;33:3851-60
43. Mizuno S, Ishizaki T, Kadowaki M. et al. p53 Signaling Pathway Polymorphisms Associated With Emphysematous Changes in Patients With COPD. Chest. 2017;152:58-69
44. Lin CC, Chian CF, Perng WC. et al. Synchronous double primary lung cancers via p53 pathway induced by heavy smoking. Ann Saudi Med. 2010;30:236-38
Author contact
![]() Corresponding authors: Dr. Xinghuan Wang, Email: wangxinghuanedu.cn, Tel. +86-27-6781-3104, Fax: +86-27-6781-2892; and Dr. Yu Xiao, Email: yu.xiaoedu.cn, Tel. +86-27-6781-2689, Fax: +86-27-6781-2892.
Corresponding authors: Dr. Xinghuan Wang, Email: wangxinghuanedu.cn, Tel. +86-27-6781-3104, Fax: +86-27-6781-2892; and Dr. Yu Xiao, Email: yu.xiaoedu.cn, Tel. +86-27-6781-2689, Fax: +86-27-6781-2892.

 Global reach, higher impact