Impact Factor ISSN: 1837-9664

 Global reach, higher impact
J Cancer 2018; 9(22):4255-4262. doi:10.7150/jca.26217 This issue Cite
Research Paper
The Association of Baseline Serum Tumour Markers with Outcome of Patients with Metastatic Colorectal Cancer Treated with Anti-EGFR Monoclonal Antibodies in the First Line
Ondrej Fiala1,2 ![]() , Petr Hosek2, Ondrej Sorejs1,2, Vaclav Liska2,3, Tomas Buchler4, Alexandr Poprach5, Radek Kucera6, Ondrej Topolcan6, Monika Sedivcova7, Jindrich Finek1
, Petr Hosek2, Ondrej Sorejs1,2, Vaclav Liska2,3, Tomas Buchler4, Alexandr Poprach5, Radek Kucera6, Ondrej Topolcan6, Monika Sedivcova7, Jindrich Finek1
1. Department of Oncology and Radiotherapy, Medical School and University Hospital in Pilsen, Charles University, Czech Republic
2. Biomedical Center, Faculty of Medicine in Pilsen, Charles University, Czech Republic
3. Department of Surgery, Medical School and University Hospital in Pilsen, Charles University, Czech Republic
4. Department of Oncology and First Faculty of Medicine, Charles University and Thomayer Hospital, Czech Republic
5. Department of Comprehensive Cancer Care and Faculty of Medicine, Masaryk Memorial Cancer Institute and Masaryk University, Zluty kopec 543/7, 656 53 Brno, Czech Republic
6. Department of Immunochemistry, Medical School and University Hospital in Pilsen, Charles University, Czech Republic
7. Bioptic Laboratory, Ltd., Molecular Pathology Laboratory, Pilsen, Czech Republic
Received 2018-3-21; Accepted 2018-7-22; Published 2018-10-20
Abstract
The measurement of serum tumour markers is a simple and non-invasive method for assessing the response to systemic therapies in metastatic colorectal cancer (mCRC) and estimation of prognosis. The aim of our retrospective study was to evaluate the association of baseline serum levels of carcinoembryonic antigen (CEA), carbohydrate antigen 19-9 (CA 19-9), thymidine kinase (TK) and tissue polypeptide specific antigen (TPS) with outcome of patients with mCRC treated with combination of chemotherapy and monoclonal antibodies against epidermal growth factor receptor (anti-EGFR mAbs) in the first line. In our study, the cohort included 102 patients treated with therapy based on anti-EGFR mAbs between years 2011 and 2017 at Department of Oncology and Radiotherapy, Medical School and University Hospital in Pilsen, Czech Republic. Serum samples were collected within one month before the initiation of treatment. In multivariate Cox analysis that included serum tumour markers and clinical baseline parameters show that high baseline serum CA 19-9 was significantly associated with worse progression-free survival (HR=1.871, p=0.0330) and also overall survival (HR=3.903, p=0.0006). We have not demonstrated association of baseline levels of CEA, TK and TPS with patients' outcome. CA 19-9 is commonly used serum tumour marker which is simple and readily available and its candidate prognostic importance in the setting of anti-EGFR therapy deserves to be studied in prospective trials.
Keywords: colorectal cancer, cetuximab, panitumumab, chemotherapy, tumor markers, serum carcinoembryonic antigen, carbohydrate antigen 19-9, thymidine kinase, tissue polypeptide specific antigen
Introduction
Colorectal cancer (CRC) is one of the most common causes of morbidity and mortality in developed countries [1]. Cetuximab and panitumumab are monoclonal antibodies (mAbs) targeting epidermal growth factor receptor (EGFR), widely used in the treatment of metastatic CRC (mCRC). It has been well-established that RAS gene mutations represent predictive biomarker of resistance to the treatment with anti-EGFR mAbs in patients with mCRC [2-11]. However, there is still a proportion of patients with tumours harbouring wild-type RAS gene, who derive no or poor benefit from systemic therapy containing anti-EGFR mAbs. Hence there is a need for surrogate predictive and prognostic biomarkers. The measurement of serum tumour markers is a simple and non-invasive method for assessing the response to systemic therapies in mCRC and estimation of prognosis [12, 13]. The aim of our retrospective study was to evaluate the association of baseline serum levels of carcinoembryonic antigen (CEA), carbohydrate antigen 19-9 (CA 19-9), thymidine kinase (TK) and tissue polypeptide specific antigen (TPS) with outcome of patients with mCRC treated with anti-EGFR mAbs in the first line.
Patients and Methods
Patients and treatment
We retrospectively analyzed clinical data of 102 adult patients with histologically confirmed mCRC treated with anti-EGFR mAbs containing therapy between years 2011 and 2017 at Department of Oncology and Radiotherapy, Medical School and University Hospital in Pilsen, Czech Republic. Cetuximab (Erbitux, Merck & Co., Kenilworth, New Jersey, USA) was administered in combination with chemotherapy or as a single agent in a standard approved dose (initial dose 400 mg/m2, further doses 250 mg/m2 every 7 days). Panitumumab (Vectibix, Amgen Inc., Thousand Oaks, California, USA) was administered in combination with chemotherapy or as a single agent in a standard approved dose (6.0 mg/kg every 14 days). The chemotherapy consisted of the following schedules: fluorouracil and leucovorin in combination with oxaliplatin (FOLFOX) or with irinotecan (FOLFIRI). Cetuximab was combined with FOLFOX in 39 patients and with FOLFIRI in 15 patients, panitumumab was combined with FOLFOX in 47 patients and with FOLFIRI in 1 patient. None of the patients had previously received anti-EGFR therapies. The protocol of our study was approved by the independent ethics committee of the Faculty of Medicine and Teaching Hospital in Pilsen and complied with the International Ethical Guidelines for Biomedical Research Involving Human Subjects, Good Clinical Practice guidelines, the Declaration of Helsinki, and local laws. The patients signed informed consent with the inclusion and subsequent analysis of their data.
The assessment of KRAS and NRAS gene status was performed at the time of diagnosis of metastatic disease. As it is a standard practice in Czech Republic, sample analysis was performed using standardized methods including direct sequencing, real-time PCR (2008-2010) and reverse hybridization method (StripAssay) (since 2010). Although the methods changed over the time, all of them were well-established and certified either by Czech Acreditation Institute (ČIA) or intended for use in clinical laboratories (CE-IVD).
Clinical monitoring
Clinical data were obtained retrospectively from the hospital information system. Physical examination and routine laboratory tests were performed every two weeks; computed tomography (CT) or positron emission tomography - (PET)-CT was performed every three months of the treatment. The objective tumour response was assessed by the attending physician using Response Evaluation Criteria in Solid Tumors (RECIST) [14].
Tumour marker measurement
Serum samples were collected and the measurement was performed within one month before the initiation of anti-EGFR treatment. Peripheral venous blood was drawn using the VACUETTE blood collection system (Greiner Bio-one Company, Kremsmünster, Austria). Serum was separated by 10 minutes centrifugation at 1300 g, and immediately frozen to -80°C. Samples were thawed only once, just prior to analyses. Serum levels of CEA and CA 19-9 were measured using chemiluminescent assay on an Unicel DxI 800 analyzer (BeckmanCoulter, Brea, CA, USA). Serum levels of TK were measured using radioenzymatic assay (REA) on an Stratec 300 analyzer (Immunotech, Prague, Czech Republic). Serum levels of TPS were measured using immunoradiometric assay (IRMA) on a Stratec 300 analyzer (IDL Biotech, Broma, Sweden). The measurements were performed at the Department of Immunochemistry, Medical School and University Hospital in Pilsen, Charles University, Czech Republic, using the following cut-off values: CEA: 3 μg/l; CA 19-9: 28 μg/l; TK: 8 U/l and TPS: 90 μg/l. These are the upper reference values for the tumour markers measured by the used tests.
Statistical analysis
Standard frequency tables and descriptive statistics were used to characterize the sample data set. Progression free survival (PFS) and overall survival (OS) were estimated using the Kaplan-Meier method and all point estimates were accompanied by two-sided 95% confidence intervals. PFS was determined from the date of anti-EGFR initiation until the date of first documented progression or death. OS was determined from the date of anti-EGFR initiation until the date of death. Statistical significance of the differences in PFS and OS according to tumour marker levels was assessed using the log-rank test. Multivariable Cox proportional hazards model was used to evaluate the effect of all potential prognostic factors on the survival indicators. Statistical significance of hazard ratios was assessed by means of the Wald test. The association between RECIST response and tumour marker levels was assessed using the Kruskal-Wallis test. All reported p-values are two-tailed and the level of statistical significance was set at α = 0.05. The statistical analysis was performed using Statistica (version 12 Cz, TIBCO Software Inc., Palo Alto, CA, USA).
Results
Patient characteristics
The study included 102 patients. The median age was 64.0 years (range 36.4-77.6 years). Sixty eight (66.7%) patients were male, 65 (63.7%) had a primary tumour localized in the colon, 54 (52.9%) had metastatic disease at diagnosis, 54 (52.9%) received the cetuximab-containing regimen and 48 (47.1%) received panitumumab-containing regimen. Anti-EGFR mAbs were combined with FOLFOX in 86 (84.3%) patients and with FOLFIRI in 16 (15.7%) patients. The baseline patient characteristics are summarized in Table 1. The baseline levels of serum tumour markers are summarized in Table 2. The median PFS was 10.20 months (95% CI 8.44-12.69), and the median OS was 35.13 months (95% CI 27.06-42.17).
Baseline patient characteristics
| Characteristic | Category | n (%) |
|---|---|---|
| Gender | Male | 68 (66.7) |
| Female | 34 (33.3) | |
| Age | <70 years | 84 (82.4) |
| (range 36.4-77.6, median 64.0) | ≥70 years | 18 (17.6) |
| Localization of primary tumour | Rectum | 37 (36.3) |
| Rectosigma | 35 (34.3) | |
| Ascendens | 14 (13.7) | |
| Descendens | 8 (7.8) | |
| Transversum | 4 (3.9) | |
| Sigma | 3 (2.9) | |
| Caecum | 1 (1.0) | |
| Localization L/R | Left | 82 (80.4) |
| Right | 17 (16.7) | |
| Middle/not defined | 3 (2.9) | |
| Type of chemotherapy | FOLFOX | 86 (84.3) |
| FOLFIRI | 16 (15.7) | |
| Response (RECIST) | CR | 10 (9.8) |
| PR | 49 (48.0) | |
| SD | 10 (9.8) | |
| PD | 14 (13.7) | |
| Not Assessed | 19 (18.6) | |
| Grading | G1 | 14 (13.7) |
| G2 | 68 (66.7) | |
| G3 | 15 (14.7) | |
| Unknown | 5 (4.9) | |
| Synchronous/metachronous | Synchronous | 54 (52.9) |
| Metachronous | 47 (46.1) | |
| Unknown | 1 (1.0) | |
| RAS/KRAS wild-type | RAS | 71 (69.6) |
| KRAS | 31 (30.4) |
Baseline levels of serum tumour markers
| Valid n | Mean | Median | 25%-75% | Min-Max | |
|---|---|---|---|---|---|
| CEA | 88 | 54.3 | 5.6 | 2.3-28 | 0.6-900 |
| CA 19-9 | 87 | 112.2 | 15.0 | 9-55 | 1-1900 |
| TPS | 75 | 271.5 | 144.0 | 79-275 | 11.6-2400 |
| TK | 85 | 11.6 | 8.3 | 5.2-11.9 | 2.5-103 |
Relation between baseline levels of serum tumour markers and treatment efficacy
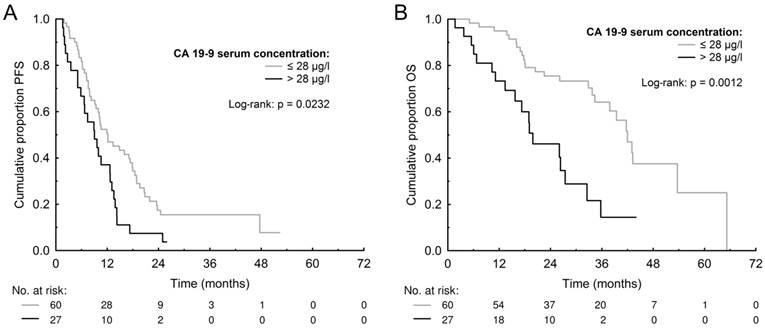
The median PFS and OS for patients with high (>3 μg/l) CEA was 10.24 months (95% CI 8.57-13.06) and 34.32 months (95% CI 26.23-42.92) compared to 10.27 months (95% CI 7.29-17.83) and 36.62 months (95% CI 17.91-52.24) for those with low (≤3 μg/l) CEA (p=0.5239 and p=0.9698). The median PFS and OS for patients with high (>28 μg/l) CA 19-9 was 8.97 months (95% CI 5.66-12.67) and 19.19 months (95% CI 14.00-27.24) compared to 12.00 months (95% CI 9.25- 17.52) and 41.82 months (95% CI 34.42-51.61) for those with low (≤28 μg/l) CA 19-9 (p=0.0232 and p=0.0012) (Figure 1). The median PFS and OS for patients with high (>8 U/l) TK was 9.95 months (95% CI 7.35-12.67) and 32.91 months (95% CI 19.58-39.86) compared to 10.56 months (95% CI 7.89-17.50) and 41.76 months (95% CI 28.30-52.51) for those with low (≤8 U/l) TK (p=0.1209 and p=0.2161). The median PFS and OS for patients with high (>90 μg/l) TPS was 9.44 months (95% CI 7.59-12.15) and 32.92 months (95% CI 24.77-40.62) compared to 12.71 months (95% CI 9.80-17.74) and 42.81 months (95% CI 28.40-54.32) months for those with low (≤90 μg/l) TPS (p=0.3831 and p=0.1654). The PFS and OS data are summarized in Table 3 and survival curves for CA 19-9 are shown in Figure 1. The multivariate Cox proportional hazards model confirmed that high baseline serum CA 19-9 was significantly associated with worse PFS (HR=1.871, p=0.0330) and also OS (HR=3.903, p=0.0006) (Table 4).
Kaplan-Meier estimates of progression-free survival (PFS) (A) and overall survival (OS) (B) according to baseline levels of carbohydrate antigen 19-9 (CA 19-9).
Progression free survival (PFS) and overall survival (OS) according to baseline levels of serum tumour markers
| CEA | p-value(Log rank test) | ||
| ≤ 3 µg/l (n = 26) | > 3 µg/l (n = 62) | ||
| Median PFS (95% CI) | 10.27 months (7.29-17.83) | 10.24 months (8.57-13.06) | 0.5239 |
| 3-month PFS (95% CI) | 84.44% (70.52-98.37) | 92.21% (85.54-98.87) | |
| 6-month PFS (95% CI) | 76.47% (60.17-92.76) | 75.66% (64.98-86.34) | |
| 12-month PFS (95% CI) | 45.26% (25.86-64.65) | 44.50% (31.97-57.02) | |
| 18-month PFS (95% CI) | 31.24% (13.03-49.45) | 22.07% (11.51-32.63) | |
| Median OS (95% CI) | 36.62 months (17.91-52.24) | 34.32 months (26.23-42.92) | 0.9698 |
| 12-month OS (95% CI) | 82.25% (67.47-97.03) | 89.51% (81.77-97.24) | |
| 24-month OS (95% CI) | 63.32% (44.24-82.41) | 66.98% (54.60-79.36) | |
| 36-month OS (95% CI) | 51.18% (27.83-74.54) | 46.26% (30.93-61.59) | |
| CA 19-9 | p-value(Log rank test) | ||
| ≤ 28 µg/l (n = 60) | > 28 µg/l (n = 27) | ||
| Median PFS (95% CI) | 12.00 months (9.25-17.52) | 8.97 months (5.66-12.67) | 0.0232 |
| 3-month PFS (95% CI) | 95.17% (89.75-100.58) | 80.20% (65.19-95.21) | |
| 6-month PFS (95% CI) | 81.52% (71.70-91.34) | 65.95% (48.09-83.82) | |
| 12-month PFS (95% CI) | 49.96% (37.07-62.85) | 34.49% (16.58-52.41) | |
| 18-month PFS (95% CI) | 34.20% (21.84-46.55) | 7.06% (n.a.) | |
| Median OS (95% CI) | 41.82 months (34.42-51.61) | 19.19 months (14.00-27.24) | 0.0012 |
| 12-month OS (95% CI) | 94.22% (88.27-100.18) | 71.75% (54.48-89.03) | |
| 24-month OS (95% CI) | 74.58% (63.21-85.95) | 42.32% (21.75-62.90) | |
| 36-month OS (95% CI) | 62.36% (47.84-76.89) | < 14.42% (n.a.) | |
| TPS | p-value(Log rank test) | ||
| ≤ 90 µg/l (n = 22) | > 90 µg/l (n = 53) | ||
| Median PFS (95% CI) | 12.71 months (9.80-17.74) | 9.44 months (7.59-12.15) | 0.3831 |
| 3-month PFS (95% CI) | 87.53% (73.78-101.27) | 90.75% (82.96-98.55) | |
| 6-month PFS (95% CI) | 81.74% (65.59-97.88) | 75.99% (64.50-87.49) | |
| 12-month PFS (95% CI) | 62.18% (41.93-82.42) | 36.91% (23.66-50.15) | |
| 18-month PFS (95% CI) | 29.95% (10.84-49.07) | 19.83% (8.80-30.86) | |
| Median OS (95% CI) | 42.81 months (28.40-54.32) | 32.92 months (24.77-40.62) | 0.1654 |
| 12-month OS (95% CI) | 89.38% (76.59-102.18) | 87.94% (79.14-96.75) | |
| 24-month OS (95% CI) | 73.50% (54.87-92.13) | 64.27% (50.69-77.86) | |
| 36-month OS (95% CI) | 63.45% (39.55-87.35) | 39.89% (23.75-56.04) | |
| TK | p-value(Log rank test) | ||
| ≤ 8 U/l (n = 39) | > 8 U/l (n = 46) | ||
| Median PFS (95% CI) | 10.56 months (7.89-17.50) | 9.95 months (7.35-12.67) | 0.1209 |
| 3-month PFS (95% CI) | 87.08% (76.55-97.60) | 91.42% (83.33-99.51) | |
| 6-month PFS (95% CI) | 76.84% (63.60-90.08) | 75.17% (62.69-87.65) | |
| 12-month PFS (95% CI) | 47.06% (30.90-63.21) | 40.61% (26.42-54.79) | |
| 18-month PFS (95% CI) | 31.69% (16.37-47.00) | 17.35% (6.41-28.30) | |
| Median OS (95% CI) | 41.76 months (28.30-52.51) | 32.91 months (19.58-39.86) | 0.2161 |
| 12-month OS (95% CI) | 86.00% (74.85-97.15) | 88.28% (78.99-97.57) | |
| 24-month OS (95% CI) | 73.62% (59.06-88.18) | 59.28% (44.49-74.07) | |
| 36-month OS (95% CI) | 56.62% (37.60-75.64) | 42.41% (25.35-59.48) | |
Hazard ratios from multivariable Cox proportional hazard model for progression-free survival (PFS) and overall survival (OS)
| Parameter | Category | Progression-free survival (PFS) | Overall survival (OS) | |||
|---|---|---|---|---|---|---|
| HR (95 % CI) | p-value | HR (95 % CI) | p-value | |||
| Gender | Female | 1 | 0.2167 | 1 | 0.4608 | |
| Male | 0.747 (0.470-1.187) | 0.789 (0.421-1.481) | ||||
| Age | <70 years | 1 | 0.4231 | 1 | 0.0677 | |
| ≥70 years | 1.274 (0.704-2.305) | 2.046 (0.949-4.410) | ||||
| Localization of primary tumour | Left | 1 | 0.1215 | 1 | 0.0941 | |
| Right | 1.549 (0.890-2.695) | 1.841 (0.901-3.761) | ||||
| Synchronous/ metachronous | Synchronous | 1 | 0.1298 | 1 | 0.7900 | |
| metastases | Metachronous | 1.418 (0.902-2.230) | 1.092 (0.571-2.087) | |||
| Type of chemotherapy | FOLFOX | 1 | 0.2233 | 1 | 0.2146 | |
| FOLFIRI | 0.681 (0.367-1.264) | 0.588 (0.254-1.360) | ||||
| CEA | ≤ 3 µg/l | 1 | 0.8426 | 1 | 0.2610 | |
| > 3 µg/l | 0.940 (0.513-1.723) | 0.638 (0.291-1.397) | ||||
| CA 19-9 | ≤ 28 µg/l | 1 | 0.0330 | 1 | 0.0006 | |
| > 28 µg/l | 1.871 (1.052-3.327) | 3.903 (1.789-8.514) | ||||
| TPS | ≤ 90 µg/l | 1 | 0.7177 | 1 | 0.8633 | |
| > 90 µg/l | 0.888 (0.465-1.694) | 1.078 (0.458-2.540) | ||||
| TK | ≤ 8 U/l | 1 | 0.2877 | 1 | 0.9580 | |
| > 8 U/l | 1.315 (0.794-2.178) | 0.982 (0.503-1.916) | ||||
There was not observed any significant association between a RECIST response and baseline serum CEA (p=0.6071), CA 19-9 (p=0.2777), TPS (p=1076) nor TK (p=0.7958).
Discussion
Randomized clinical trials have provided evidence for the efficacy and safety of cetuximab as well as panitumumab in the treatment of patients with mCRC [15-27]. The efficacy of anti-EGFR mAbs was reported to be restricted to patients with tumours harbouring wild-type KRAS gene. Thus, KRAS gene mutations, occurring in 35-45% of cases, became the most important predictive biomarker in patients with mCRC [2-6]. Extended RAS analyses have demonstrated lack of response to anti-EGFR mAbs also in patients with tumours harbouring NRAS gene mutations, occurring in 1-6% of CRC cases [2, 7-11]. However, there is still a large proportion of patients with tumours harbouring wild-type RAS gene, who derive poor benefit from systemic treatment based on anti-EGFR mAbs.
Molecules used as serum tumour markers play a role in several cancer-related processes including cell adhesion, proliferation, and tumour angiogenesis and could be useful as a surrogate marker for molecular characteristics of a tumour. CEA, CA 19-9, TK, and TPS are serum tumour markers widely used for primary diagnostics and also follow-up monitoring of patients with CRC. In the present study we focused on their association with the efficacy of anti-EGFR mAbs containing therapy in patients with mCRC treated in the first line. In order to facilitate the clinical interpretation of the results, we used the upper normal values for all the studied tumour markers as a cut-off.
CEA plays a role in cell-to-cell adhesion and has a dominant effect in blocking cell differentiation and it cooperates with Myc and Bcl-2 in cellular transformation [28, 29]. The prognostic value of CEA in patients with locoregional CRC or those after metastasecomy has been previously clearly reported [30-34]. On the other hand, it seems to be controversial whether it is an independent prognostic parameter in patients with mCRC [35-37]. In the present study, we did not demonstrate any significant difference in PFS or OS between patients with high compared to those with low baseline levels of CEA. Interestingly, in our previous retrospective study, we observed that high baseline levels of CEA were independently associated with shorter PFS in patients with mCRC treated with systemic therapy based on a monoclonal antibody against vascular endothelial growth factor (VEGF), bevacizumab [38]. Similar results have been previously published by Prager et al., who reported the lack of association between baseline CEA levels and the treatment efficacy of cetuximab-based therapy and significant association of baseline CEA levels with shorter PFS for patients treated with bevacizumab-based therapies [39]. The study by Prager et al. showed significant association of baseline CEA levels with OS for patients treated with cetuximab-based treatment and also for those treated with bevacizumab-based treatment [39]. The results of our present and also the previous study did not confirm the association of serum CEA with OS [38]. In comparison with our studies, Prager et al. used different cut-off value (26.8 μg/l), which was obtained as a median value of pretreatment CEA levels. The association of baseline CEA levels with PFS in mCRC patients treated with bevacizumab contrasting with no association in patients treated with anti-EGFR mAbs suggests use of CEA as a surrogate predictive biomarker for targeted treatment in mCRC. This could be explained by several proangiogenic effects of CEA recently described by Bramswig et al., who reported that soluble CEA activates endothelial cells and tumour angiogenesis via paracrine manner and the CEA-induced endothelial cell activation was independent of the VEGF-VEGFR 1/2 system [40].
CA 19-9 is an antigen expressed by the glycosylated extracellular MUC1 protein. It plays an important role in cancer invasion by enhancing cell adhesion and promoting angiogenesis indirectly [41]. In the present study, we observed significantly shorter PFS and OS for patients with high CA 19-9 compared to those with low CA 19-9, and the multivariate Cox proportional hazards model confirmed that high CA 19-9 was independently associated with shorter PFS and OS. In CRC patients, the prognostic role of CA 19-9 remains controversial since it has a lower sensitivity as compared to CEA [42]. Elevated CA 19-9 levels have been reported to be strongly associated with poor prognosis, especially in nodal-positive locoregional CRC treated with adjuvant chemotherapy [43, 44]. A large meta-analysis including seventeen studies has been conducted by Yu et al., recently [45]. The meta-analysis included 6,434 patients and its results show that baseline serum CA 19-9 can be used as a prognostic indicator for both metastatic and locoregional stage of CRC [45]. This is in agreement with our results. Interesting data suggesting possible predictive role of CA 19-9 have been recently provided by Formica et al. and Narita et al. [46, 47]. In observational studies, they found that only patients with high baseline levels of CA 19-9 benefited significantly from the administration of bevacizumab in comparison with chemotherapy alone [46, 47]. To our best knowledge, there are currently no data published on the possible predictive role of baseline CA 19-9 level in patents with mCRC treated with anti-EGFR mAbs. The present study did not include a control group not treated with anti-EGFR mAbs, and, therefore, it cannot be concluded whether serum CA 19-9 could serve as a potential predictive biomarker also for anti-EGFR mAbs containing therapy, or it is a prognostic factor associated with mCRC in general.
TK is an enzyme present in most cells, correlating with their proliferative characteristics. It has a key function in the synthesis of DNA and therefore in cell division, it is expressed during cell division in the G1 and S phase while it is absent in resting cells [48]. In the present study, we did not observe any significant association between PFS or OS and the baseline level of TK, although several authors have reported on the putative role of TK as a prognostic factor [49, 50].
The TPS assay detects the M3 epitope of cytokeratin 18 or of tissue polypeptide antigen. Cytokeratin 18 is an acid-type cytosolic protein expressed in simple epithelial cells and also by tumor cells [51, 52]. TPS has been shown to indicate tumor cell proliferative activity. TPS has been mostly studied as a biomarker for monitoring of treatment response to palliative chemotherapy in patients with gastrointestinal tumors including mCRC. [53-55]. No impact of baseline level of TPS and survival has been detected in our study.
The principal limitations of the present study are its retrospective design and relatively small number of patients. We should also mention the fact, that 31 (30.4%) patients were tested only for KRAS mutation, not for NRAS mutation. However, with respect of low incidence of NRAS mutations in CRC, this could hardly influence the results [2, 11]. Nevertheless, it is the first study published so far to use a comprehensive serum tumour marker panel in patients with mCRC treated with anti-EGFR mAbs containing therapy.
In conclusion, the results of the conducted retrospective study suggest that the baseline level of CA 19-9 was independently associated with PFS and OS in patients with mCRC treated with anti-EGFR mAbs containing therapy in the first line. CA 19-9 is commonly used serum tumour marker which is simple and easy to detect and thus it is feasible for the use in the routine clinical practice. We have not demonstrated association of baseline levels of CEA, TK and TPS with patients' outcome. Prospective studies on the prognostic and predictive role of serum tumour markers should be performed to confirm these results.
Acknowledgements
The authors would like to thank all patients voluntarily taking part in the study. This study was supported by the project “Centrum of clinical and experimental liver surgery”, UNCE/MED/006 and by the National Sustainability Program I (NPU I) Nr. LO1503 provided by the Ministry of Education Youth and Sports of the Czech Republic and by the Charles University Research Fund (Progres Q39).
Conflict of Interest
OF received honoraria from Roche, GSK and Pfizer for consultations and lectures unrelated to this project. TB and AP received lecture honoraria from Novartis, Pfizer, Bayer-Schering and Roche. TB also received research support from Roche and Novartis. JF has received honoraria from Astra Zeneca, Roche and Novartis for consultations and lectures unrelated to this project. PH, OS, VL, RK, OT and MS declare that they have no actual or potential conflict of interest including any financial, personal or other relationships with other people or organizations that could inappropriately influence this work.
References
1. Jemal A, Bray F, Center MM. et al. Global cancer statistics. CA Cancer J Clin. 2011;61:69-90
2. Vaughn CP, Zobell SD, Furtado LV. et al. Frequency of KRAS, BRAF, and NRAS mutations in colorectal cancer. Genes Chromosomes Cancer. 2011;50:307-312
3. Lièvre A, Bachet JB, Le Corre D. et al. KRAS mutation status is predictive of response to cetuximab therapy in colorectal cancer. Cancer Res. 2006;66:3992-3995
4. Lièvre A, Bachet JB, Boige V. et al. KRAS mutations as an independent prognostic factor in patients with advanced colorectal cancer treated with cetuximab. J Clin Oncol. 2008;26:374-379
5. Karapetis CS, Khambata-Ford S, Jonker DJ. et al. K-ras mutations and benefit from cetuximab in advanced colorectal cancer. N Engl J Med. 2008;59:1757-1765
6. Amado RG, Wolf M, Peeters M. et al. Wild-type KRAS is required for panitumumab efficacy in patients with metastatic colorectal cancer. J Clin Oncol. 2008;26:1626-1634
7. Douillard J-Y, Oliner KS, Siena S. et al. Panitumumab-FOLFOX4 treatment and RAS mutations in colorectal cancer. N Engl J Med. 2013;369:1023-1034
8. Ciardiello F, Lenz HJ, Kohne CH. et al. Treatment outcome according to tumor RAS mutation status in CRYSTAL study patients with metastatic colorectal cancer (mCRC) randomized to FOLFIRI with/without cetuximab. J Clin Oncol. 2014;32:3506
9. Bokemeyer C, Kohne CH, Ciardello F. et al. Treatment outcome according to tumor RAS mutation status in OPUS study patients with metastatic colorectal cancer (mCRC) randomized to FOLFOX4 with/without cetuximab. J Clin Oncol. 2014;32:3506
10. Sorich MJ, Wiese MD, Rowland A. et al. Extended RAS mutations and anti-EGFR monoclonal antibody survival benefit in metastatic colorectal cancer: a meta-analysis of randomized, controlled trials. Ann Oncol. 2015;26:13-21
11. Irahara N, Baba Y, Nosho K. et al. NRAS mutations are rare in colorectal cancer. Diagn Mol Pathol. 2010;19:157-63
12. Yamashita K, Watanabe M. Clinical significance of tumor markers and an emerging perspective on colorectal cancer. Cancer Sci. 2009;100:195-199
13. Duffy MJ, Lamerz R, Haglund C. et al. Tumor markers in colorectal cancer, gastric cancer and gastrointestinal stromal cancers: European group on tumor markers 2014 guidelines update. Int J Cancer. 2014;134:2513-2522
14. Therasse P, Arbuck SG, Eisenhauer EA. et al. New guidelines to evaluate the response to treatment in solid tumours. European Organization for Research and Treatment of Cancer, National Cancer Institute of the United States, National Cancer Institute of Canada. J Natl Cancer Inst. 2000;3:205-216
15. Jonker DJ, O'Callaghan CJ, Karapetis CS. et al. Cetuximab for the treatment of colorectal cancer. N Engl J Med. 2007;357:2040-2048
16. van Cutsem E, Peeters M, Siena S. et al. Open-label phase III trial of panitumumab plus best supportive care compared with best supportive care alone in patients with chemotherapy-refractory metastatic colorectal cancer. J Clin Oncol. 2007;25:1658-1664
17. Douillard JY, Siena S, Cassidy J. et al. Randomized, phase III trial of panitumumab with infusional fluorouracil, leucovorin, and oxaliplatin (FOLFOX4) versus FOLFOX4 alone as first-line treatment in patients with previously untreated metastatic colorectal cancer: the PRIME study. J Clin Oncol. 2010;28:4697-4705
18. Bokemeyer C, Van CE, Rougier P. et al. Addition of cetuximab to chemotherapy as first-line treatment for KRAS wild-type metastatic colorectal cancer: pooled analysis of the CRYSTAL and OPUS randomised clinical trials. Eur J Cancer. 2012;48:1466-1475
19. Schwartzberg LS, Rivera F, Karthaus M. et al. PEAK: a randomized, multicenter phase II study of panitumumab plus modified fluorouracil, leucovorin, and oxaliplatin (mFOLFOX6) or bevacizumab plus mFOLFOX6 in patients with previously untreated, unresectable, wild-type KRAS exon 2 metastatic colorectal cancer. J Clin Oncol. 2014;32:2240-2247
20. Heinemann V, von Weikersthal LF, Decker T. et al. FOLFIRI plus cetuximab versus FOLFIRI plus bevacizumab as first-line treatment for patients with metastatic colorectal cancer (FIRE-3): a randomised, open-label, phase 3 trial. Lancet Oncol. 2014;15:1065-1075
21. Seymour MT, Brown SR, Middleton G. et al. Panitumumab and irinotecan versus irinotecan alone for patients with KRAS wild-type, fluorouracil-resistant advanced colorectal cancer (PICCOLO): a prospectively stratified randomised trial. Lancet Oncol. 2013;14:749-759
22. Van Cutsem E, Nowacki M, Lang I. et al. Randomized phase III study of irinotecan and 5-FU/FA with or without cetuximab in the first-line treatment of patients with metastatic colorectal cancer (mCRC): the CRYSTAL trial. J Clin Oncol. 2007;25:4000
23. Peeters M, Price TJ, Cervantes A. et al. Randomized phase III study of panitumumab with fluorouracil, leucovorin, and irinotecan (FOLFIRI) compared with FOLFIRI alone as second-line treatment in patients with metastatic colorectal cancer. J Clin Oncol. 2010;28:4706-4713
24. Bokemeyer C, Bondarenko I, Makhson A. et al. Fluorouracil, leucovorin, and oxaliplatin with and without cetuximab in the first-line treatment of metastatic colorectal cancer. J Clin Oncol. 2009;27:663-671
25. Douillard JY, Siena S, Cassidy J. et al. Randomized, phase III trial of panitumumab with infusional fluorouracil, leucovorin, and oxaliplatin (FOLFOX4) versus FOLFOX4 alone as first-line treatment in patients with previously untreated metastatic colorectal cancer: The PRIME study. J Clin Oncol. 2010;28:4697-4705
26. Cunningham D, Humblet Y, Siena S. et al. Cetuximab monotherapy and cetuximab plus irinotecan in irinotecan-refractory metastatic colorectal cancer. N Engl J Med. 2004;351:337-345
27. Maughan TS, Adams RA, Smith CG. et al. Addition of cetuximab to oxaliplatin-based first-line combination chemotherapy for treatment of advanced colorectal cancer: Results of the randomized phase 3 MRC COIN trial. Lancet. 2011;377:2103-2114
28. Benchimol S, Fuks A, Jothy S. et al. Carcinoembryonic antigen, a human tumor marker, functions as an intercellular adhesion molecule. Cell. 1989;57:327-334
29. Screaton RA, Penn LZ, Stanners CP. et al. Carcinoembryonic antigen, a human tumor marker, cooperates with Myc and Bcl-2 in cellular transformation. J Cell Biol. 1997;137:939-952
30. Huh JW, Oh BR, Kim HR. et al. Preoperative carcinoembryonic antigen level as an independent prognostic factor in potentially curative colon cancer. J Surg Oncol. 2010;101:396-400
31. Sun LC, Chu KS, Cheng SC. et al. Preoperative serum carcinoembryonic antigen, albumin and age are supplementary to UICC staging systems in predicting survival for colorectal cancer patients undergoing surgical treatment. BMC Cancer. 2009 9: 288
32. Park IJ, Choi GS, Lim KH. et al. Serum carcinoembryonic antigen monitoring after curative resection for colorectal cancer: clinical significance of the preoperative level. Ann Surg Oncol. 2009;16:3087-3093
33. Peng Y, Wang L, Gu J. et al. Elevated preoperative carcinoembryonic antigen (CEA) and Ki67 is predictor of decreased survival in IIA stage colon cancer. World J Surg. 2013;37:208-213
34. Harrison LE, Guillem JG, Paty P. et al. Preoperative carcinoembryonic antigen predicts outcomes in node-negative colon cancer patients: a multivariate analysis of 572 patients. J Am Coll Surg. 1997;185:55-59
35. Yuste AL, Aparicio J, Segura A. et al. Analysis of clinical prognostic factors for survival and time to progression in patients with metastatic colorectal cancer treated with 5-fluorouracil-based chemotherapy. Clin Colorectal Cancer. 2003;2:231-234
36. Wang WS, Lin JK, Chiou TJ. et al. CA19-9 as the most significant prognostic indicator of metastatic colorectal cancer. Hepatogastroenterology. 2002 49: 160-164
37. Aggarwal C, Meropol NJ, Punt CJ. et al. Relationship among circulating tumor cells, CEA and overall survival in patients with metastatic colorectal cancer. Ann Oncol. 2013;4:420-428
38. Fiala O, Finek J, Buchler T. et al. The Association of Serum Carcinoembryonic Antigen, Carbohydrate Antigen 19-9, Thymidine Kinase, and Tissue Polypeptide Specific Antigen with Outcomes of Patients with Metastatic Colorectal Cancer Treated with Bevacizumab: a Retrospective Study. Target Oncol. 2015;10:549-555
39. Prager GW, Braemswig KH, Martel A. et al. Baseline carcinoembryonic antigen (CEA) serum levels predict bevacizumab-based treatment response in metastatic colorectal cancer. Cancer Sci. 2014;105:996-1001
40. Bramswig KH, Poettler M, Unseld M. et al. Soluble Carcinoembryonic Antigen Activates Endothelial Cells and Tumor Angiogenesis. Cancer Res. 2013;73:6584-6596
41. Ballehaninna UK, Chamberlain RS. The clinical utility of serum CA 19-9 in the diagnosis, prognosis and management of pancreatic adenocarcinoma: An evidence based appraisal. J Gastrointest Oncol. 2012;3:105-119
42. Galli C, Basso D, Plebani M. CA 19-9: handle with care. Clin Chem Lab Med. 2013;51:1369-1383
43. Reiter W, Stieber P, Reuter C. et al. Multivariate analysis of the prognostic value of CEA and CA 19-9 serum levels in colorectal cancer. Anticancer Res. 2000;20:5195-5198
44. Behbehani AI, Al-Sayer H, Farghaly M. et al. Prognostic significance of CEA and CA 19-9 in colorectal cancer in Kuwait. Int J Biol Markers. 2000;15:51-55
45. Yu Z, Chen Z, Wu J. et al. Prognostic value of pretreatment serum carbohydrate antigen 19-9 level in patients with colorectal cancer: A meta-analysis. PLoS One. 2017;12:e0188139
46. Formica V, Massara MC, Portarena I. et al. Role of CA19-9 in predicting bevacizumab efficacy for metastatic colorectal cancer patients. Cancer Biomark. 2009;5:167-175
47. Narita Y, Taniguchi H, Komori A. et al. CA19-9 level as a prognostic and predictive factor of bevacizumab efficacy in metastatic colorectal cancer patients undergoing oxaliplatin-based chemotherapy. Cancer Chemother Pharmacol. 2014;73:409-416
48. Zhou J, He E, Skog S. The proliferation marker thymidine kinase 1 in clinical use. Mol Clin Oncol. 2013;1:18-28
49. Svobodova S, Topolcan O, Holubec L. et al. Prognostic importance of thymidine kinase in colorectal and breast cancer. Anticancer Res. 2007;27:1907-1909
50. Treska V, Topolcan O, Stanislav K. et al. Preoperative tumor markers as prognostic factors of colorectal liver metastases. Hepatogastroenterology. 2009;56:317-320
51. Rydlander L, Ziegler E, Bergman T. et al. Molecular characterization of a tissue-polypeptide-specific-antigen epitope and its relationship to human cytokeratin 18. Eur J Biochem. 1996;241:309-314
52. Bodenmuller H. The biochemistry of CYFRA 21-1 and other cytokeratin tests. Scand J Clin Lab Invest. 1995;221:60-66
53. Glimelius B, Hoffman K, Einarsson R. et al. Monitoring palliative chemotherapy in advanced gastrointestinal cancer using serial tissue polypeptide specific antigen (TPS) measurements. Acta Oncol. 1996;35:141-148
54. Kornek G, Schenk T, Raderer M. et al. Tissue polypeptide-specific antigen (TPS) in monitoring palliative treatment response of patients with gastrointestinal tumours. Br J Cancer. 1995;71:182-185
55. Berglund A, Molin D, Larsson A. et al. Tumour markers as early predictors of response to chemotherapy in advanced colorectal carcinoma. Ann Oncol. 2002;13:1430-1437
Author contact
![]() Corresponding author: Ondrej Fiala, M.D., Ph.D., Department of Oncology and Radiotherapy, Medical School and University Hospital Pilsen, Charles University Prague, alej Svobody 80, CZ-304 60 Pilsen, Czech Republic. Tel.: +42 0728655488, e-mail: fiala.ocz
Corresponding author: Ondrej Fiala, M.D., Ph.D., Department of Oncology and Radiotherapy, Medical School and University Hospital Pilsen, Charles University Prague, alej Svobody 80, CZ-304 60 Pilsen, Czech Republic. Tel.: +42 0728655488, e-mail: fiala.ocz