Impact Factor ISSN: 1837-9664

 Global reach, higher impact
J Cancer 2018; 9(23):4484-4495. doi:10.7150/jca.26698 This issue Cite
Research Paper
Identification of Five Genes as a Potential Biomarker for Predicting Progress and Prognosis in Adrenocortical Carcinoma
He Xiao1, Deqiang Xu1, Ping Chen1, Guang Zeng1,2, Xinghuan Wang1, Xinhua Zhang1 ![]()
1. Department of Urology, Zhongnan Hospital of Wuhan University, Wuhan 430071, P.R. China
2. Biomedical Engineering, Stony Brook University, New York 11790
Received 2018-4-16; Accepted 2018-9-20; Published 2018-10-31
Abstract
Background: Adrenocortical carcinoma (ACC) is a limited endocrine fatality with a minor diagnosis and rare remedial options. The progressive and predictive meaning of message RNA (mRNA) expression oddity in ACC has been studied extensively in recent years. However, differences in measurement platforms and lab protocols as well as small sample sizes can render gene expression levels incomparable.
Methods: An extensive study of GEO datasets was conducted to define potential mRNA biomarkers for ACC. The study compared the mRNA expression profiles of ACC tissues and neighboring noncancerous adrenal tissues in the pair. The study covered a sum of 165 tumors and 36 benign control samples. Hub genes were identified through a protein-protein interaction (PPI) network and Robust Rank Aggregation method. Then the Cancer Genome Atlas (TCGA) and Oncomine database were used to perform the validation of hub genes. 4 ACC tissues and 4 normal tissues were collected and then Polymerase Chain Reaction (PCR), Western-blot and immunofluorescence were conducted to validate the expression of five hub genes.
Results: We identified five statistically significant genes (TOP2A, NDC80, CEP55, CDKN3, CDK1) corrected with clinical features. The expression of five hub genes in TCGA and Oncomine database were significantly overexpressed in ACC compared with normal ones. Among all the TCGA ACC cases, the strong expression of TOP2A (logrank p=1.4e-04, HR=4.7), NDC80 (logrank p=8.8e-05, HR=4.9), CEP55 (logrank p=5.2e-07, HR=8.6), CDKN3 (log rank p=2.3e-06, HR=7.6) and CDK1 (logrank p=7e-08, HR=11) were correlated with low comprehensive survival, disease free survival (logrank p < 0.001), pathology stage and pathology T stage (FDR < 0.001). PCR results showed that the transcriptional levels of these five genes were significantly higher in ACC tissues than in normal tissues. The western blotting results also showed that the translational level of TOP2A was significantly higher in tumor tissues than in normal tissues. The results of immunofluorescence showed that TOP2A was abundantly observed in the adrenal cortical cell membrane and nucleus and its expression in ACC tissues was significantly higher than that in normal tissues.
Conclusions: The distinguished five genes may be utilized to form a board of progressive and predictive biomarkers for ACC for clinical purpose.
Keywords: adrenocortical carcinoma, robust rank analysis, protein-protein interaction (PPI), biomarker
Introduction
Although adrenocortical carcinoma (ACC) is uncommon, it is a lethal malignancy that accounts for 0.7-2.0 out of one million cases annually [1-3]. Despite of its rarity, it is extremely threatening and the 5-year survival rate reaches merely 10-20%. Therefore, there is an urgent need for the new therapeutic and diagnostic approaches. It requires the understanding of its molecular basis [4-8]. The genetic background and gene combination of adrenocortical tumorigenesis are poorly characterized. However, only a small amount of studies have attempted to identify this process from a molecular perspective [9].
Tumor size is one of the primordial pathological characteristics to indicate cancerous act and positively correlated with malignancy [10, 11]. A full surgical abscission is now the only treatment that is potential to cure the cancerous tumor. Other forms of therapy like chemotherapy or radio have merely a limited influence on the survival of the patient [12]. Consequently, detailed analysis of the relevant pivotal genes is extremely beneficial. The establishment of the cDNA microarray technique provides the possibility to evaluate a huge quantity of genes. This approach compares and analyzes the gene-expression profiles in malignant and benign adrenocortical neoplasms. It also helps with the recognition of tumor suppressor genes and oncogenes related with the occurrence and development of adrenocortical tumors. Results from these studies might make adrenocortical tumorigenesis clear and bring the invention of novel markers for diagnosis, predictions and the identification of new therapeutic treatment.
Consequently, we aimed to carry out a representative and comprehensive study of cancerous and noncancerous adrenocortical tissue samples. Special importance was attached to the assessment of the disparate profiles with affirmative significance for progression and development of cancerous diseases [13], to evaluate the possibilities of gene combinations in forecasting cancerous tumors [4]. Genome-wide gene expression has been used by several investigators profiling. Some potential diagnostic biomarkers of adrenocortical carcinoma and molecular profiles distinguishing malignant from normal adrenocortical neoplasms have been identified [14-17] However, these researches obtained the divergent individual candidate genes. It is probably the result of varying approaches to relevant small sample size and data analysis. Besides, as far as we know, no strict analysis of the progressive and prognostic prediction of the prospective biomarkers in adrenocortical carcinoma has been carried out. Thus, the genome-wide expression analysis of normal samples and ACC was identified to identify candidate biomarkers.
In prevailing study, we used Gene Expression Omnibus (GEO) database to download six different microarray datasets and a solid rank aggregation analysis was applied. After that, we used The Cancer Genome Atlas, The Genotype-Tissue Expression (GTEx) and Oncomine database to validate the hub genes. Furthermore, we collected ACC tissues and normal tissues to verify the results of our previous analysis. We aimed to search and confirm diverse hub genes that is effective in the advance and prediction of ACC.
Materials and methods
Data collection
Gene expression profiles were downloaded from Gene Expression Omnibus (GEO) database (http://www.ncbi.nlm.nih.gov/geo/). Datasets GSE12368, GSE14922, GSE19750, GSE 33371, GSE75415, GSE90713 were used to select disparate expressed genes and establish protein-protein interaction networks. They were also use to conduct robust rank analysis, distinguish hub genes and pathways.
Data processing
Raw microarray data were executed in RMA background correction and log2 transformed then normalized through quantile normalization. The "Affy" R package was applied to sum up the Median-polish probe sets [18]. Finally, sample clustering was used to evaluate the microarray quality following the distance between average linkage and various samples in Pearson's correlation models.
Robust rank aggregation analysis
The extracted mRNAs were classified according to their correlated p values (the significance level was defined as p<0.05) while their fold changes were not reported. All the Robust Rank Aggregation method protocols are accessible at R Archive Network website (http://cran.r-project.org/) and details are obtained from the documentation package (http://cran.rproject.org/web/packages/RobustRankAggreg/RobustRankAggreg.pdf). Each element was assigned with a p value in the aggregated list, which indicates its ranking improvement in comparison with a null model, assuming random ordering [19].
Functional and pathway enrichment analysis
KEGG Orthology Based Annotation System (http://kobas.cbi.pku.edu.cn/index.php), based on multiple databases about pathways, diseases, and gene ontology, was used to execute KEGG pathway enrichment analysis and GO enrichment analysis [20].
PPI network construction
Search Tool for the Retrieval of Interacting Genes (STRING) Database (http://www.string-db.org/) was used to evaluate protein-protein interaction (PPI) data [21]. In addition, the database was also employed to quantify the interrelationships of analyzed differentially expressed genes (DEGs). Results are visualized in Cytoscape software [22]. Confidence score higher than 0.4 was set as significant. It should be noted that hub genes were those that had a connectivity degree over 20 in the PPI network.
Validation of hub genes expression levels
Gene Expression Profiling Interactive Analysis (http://gepia.cancer-pku.cn) and Oncomine (https://www.oncomine.org) were used to carry out validation of expression of the candidate hub genes [23, 24].
Prognostic value of each hub gene in the TCGA dataset
Based on TCGA database, Gene Expression Profiling Interactive Analysis (http://gepia.cancer-pku.cn) was used to investigate the relationship between the expression of each hub gene and overall survival (OS) or disease-free survival (DFS) analysis. Log rank test and the Mantel-Cox test were used for hypothesis test. Cohorts thresholds were adjusted and gene-pairs were used. The survival plots also contained the cox proportional hazard ratio and the p = 0.05 significance level.
Progressive value of each hub gene in the TCGA dataset
According to the TCGA database, the Linked Omics database (http://www.linkedomics.org) was used to investigate the relationship between each hub gene expression and ACC pathology stages and pathology T stages [25].
Human tissues
Four normal samples from young brain-dead men (mean age, 33.1±1.7 years old) undergoing organ donation were obtained as controls and four ACC samples obtained from patients (mean age, 52.7±2.1 years old) undergoing laparoscopic unilateral adrenalectomy. All human samples were obtained after the approval of the Hospital Committee for Investigation in Humans and after receiving written informed consent from all patients or their relatives involved. All tissues were divided into 3 strips and were respectively stored in RNA Sample Protector (Takara Bio. Inc., Otsu, Shiga, Japan) for PCR analysis, 10% neutral buffered formalin for histological examination, liquid nitrogen for Western-Blotting analysis and immunofluorescence. All human study was conducted in accordance with the principles of the Declaration of Helsinki (approval no. 2015029).
Total RNA extraction and real-time RT-PCR
Total RNA was isolated from the frozen tissues using Takara RNAiso Plus (Takara Bio. Inc., Otsu, Shiga, Japan) according to the manufacturer's protocol. Genomic DNA (gDNA) was removed and cDNA was reverse-transcribed by using Takara PrimeScriptTM RT reagent Kit with gDNA Eraser (Takara Bio. Inc., Otsu, Shiga, Japan) in a T100TM Thermal Cycler System (BioRad, USA). The experimental protocol was first gDNA removal (42 °C 2 min), followed by reverse transcription (37 °C 15 min, 85 °C 5 s). Subsequently, all samples were amplified by a 25 μl reaction volume in a CFX96TM Real-time PCR Detection System (BioRad, USA), using SYBR® Premix Ex TaqTM Ⅱ (Takara Bio. Inc., Otsu, Shiga, Japan). All samples were run in triplicate. TOP2A, NDC80, CEP55, CDKN3, CDK1 were investigated. The amplification program was repeated for 40 cycles. Primer sequences are shown in Table 2. For relative quantification, gene expression was normalized to expression of GAPDH housekeeping gene and compared by 2-ΔΔCT method.
Primer sequences used to amplify target genes by real-time RT-PCR.
| Target Gene | Primer Sequence | |
|---|---|---|
| TOP2A | Forward | 5'-GCGGGCTAAAGGAAGGTTCA-3' |
| Reverse | 5'-TGACACTTCCATGGTGACGG-3' | |
| NDC80 | Forward | 5'-ATCAAGGACCCGAGACCACT-3' |
| Reverse | 5'-ATGTATGAGGAGCCCCCACT-3' | |
| CEP55 | Forward | 5'-GGAGGGCAGACCATTTCAGAG-3' |
| Reverse | 5'-AGGCTTCGATCCCCACTTAC-3' | |
| CDKN3 | Forward | 5'-CAGCCTGCGAGACCTAAGAG-3' |
| Reverse | 5'-TGTGCAGCTAATTTGTCCCG-3' | |
| CDK1 | Forward | 5'-TTCTTTCGCGCTCTAGCCAC-3' |
| Reverse | 5'-TCGGGTAGCCCGTAGACTTT-3' | |
| GAPDH | Forward | 5'-AGAAGGCTGGGGCTCATTTG-3' |
| Reverse | 5'-AGGGGCCATCCACAGTCTTC-3' |
Western-Blotting analysis
Proteins were extracted from frozen samples using the Radio Immunoprecipitation Assay Lysis Buffer (Shanghai Beyotime Bio. Co., Shanghai, China). One hundred μg of each sample was electrophoresed on a 10% sodium dodecyl sulfate-polyacrylamide (SDS-PAGE) gel (Wuhan Boster Biological Technology Ltd., Wuhan, China) and transferred to polyvinylidene fluoride (PVDF) membrane (Millipore, Billerica, MA, USA) using a BioRad wet transfer system. The membrane was blocked for 2 h at room temperature with Tris-buffered saline with 0.1% Tween (TBST) containing 5% non-fat dry milk solution. The membrane was incubated overnight with primary TOP2A antibody (Rabbit Polyclonal to TOP2A, A0726, ABclonal) at dilution of 1:1000. After washing several times with PBS, the membranes were incubated with anti-rabbit immunoglobulin G (IgG) linked with horseradish peroxidase at a 1:10,000 dilution (Thermo Scientific Fisher; Rockford, IL, USA) for 1 hour at room temperature. Detection of reaction antigen was performed with an enhanced chemiluminescence (ECL) kit (Thermo Scientific Fisher). A monoclonal mouse antibody against GAPDH (1:5000; Sigma-Aldrich) was used as a control to ascertain equivalent loading. All samples were independently repeated for 3 times.
Immunofluorescence
Tissues were sectioned in 10 μm thick slices and thaw, mounted onto glass slides using a cryostat (Leica CM 1850, Wetzlar, Germany), air-dried, and fixed for 10 min in ice cold acetone. Slides were washed in PBS and incubated for 2 h in a mixture of PBS supplemented with 0.2% Triton X-100 and 0.1% bovine serum albumin, followed by incubation overnight with the primary antibody (1:100). The secondary antibody employed to visualize the localization of TOP2A is Cy3-conjugated goat anti-rabbit IgG (1:1000). DAPI was used for staining the nucleus. Visualization was done with a laser microscope (Olympus, Tokyo, Japan).
Results
DEGs between ACC and healthy control samples
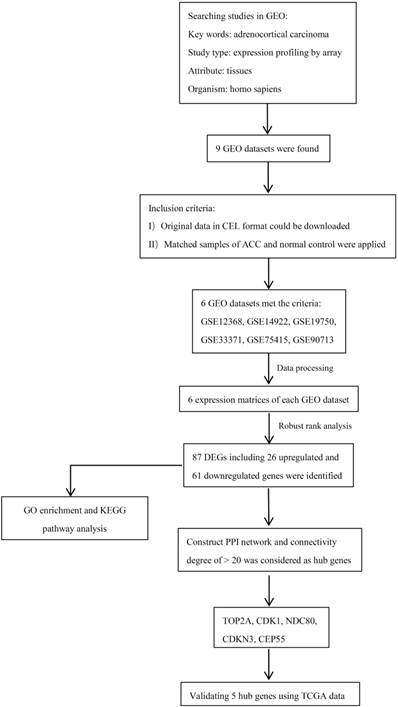
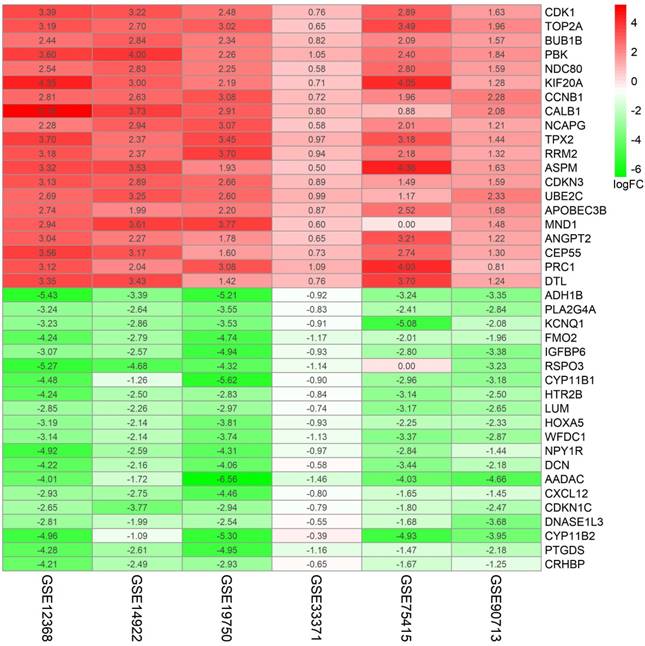
A flowchart of current study schedule was displayed in Figure 1. A sum of 6 GEO datasets were examined and analyzed for further investigation (Table 1). After quality assessment and data preprocessing, the expression matrices were obtained from every GEO dataset. By using a rank aggregation analysis of these six expression matrices, we identified 87 statistically significant genes including 26 up-regulated and 61 down-regulated genes in ACC samples compared with normal adrenal gland tissues. The top 20 down-regulated genes and top 20 up-regulated genes were showed in Figure 2.
Diagram depicting the recognition and selection of microarray from Gene Expression Omnibus (GEO) and the data analysis protocol used in this study.
The detailed information of the six GEO datasets
| Dataset | Number of samples (normal/tumor) | Array types | Experiment type | Origin |
|---|---|---|---|---|
| Soon PS et.al GSE12368 | 6/12 | Affymetrix Human Genome U133 Plus 2.0 Array | mRNA | Endocrine-related cancer 2009/6/1 |
| Szabó PM et.al GSE14922 | 4/4 | Agilent-014850 Whole Human Genome Microarray 4x44K G4112F | mRNA | Endocrine-related cancer 2009/9/16 |
| Demeure MJ et.al GSE19750 | 4/44 | Affymetrix Human Genome U133 Plus 2.0 Array | mRNA | Surgery 2013/6/28 |
| Heaton JH et.al GSE33371 | 10/33 | Affymetrix Human Genome U133 Plus 2.0 Array | mRNA | The American Journal of Pathology 2012/7/15 |
| West AN et.al GSE75415 | 7/15 | Affymetrix Human Genome U133A Array | mRNA | Cancer Research 2007/1/15 |
| Farber JM et.al GSE90713 | 5/57 | Affymetrix Human Gene Expression Array | mRNA | Oncotarget 2017/9/26 |
87 DEGs with p value < 0.05 were selected using the Robust Rank Aggregation method. Top 20 up-regulated and down-regulated genes were showed in the heatmap. Rows in the heatmap stand for dataset. The level of expression of a gene is indicated by the column. The color scale beside the heatmap stands for the log fold change (logFC) from green to red indicating the expression level from low to high.
Functional and pathway enrichment analysis of the 87 DEGs
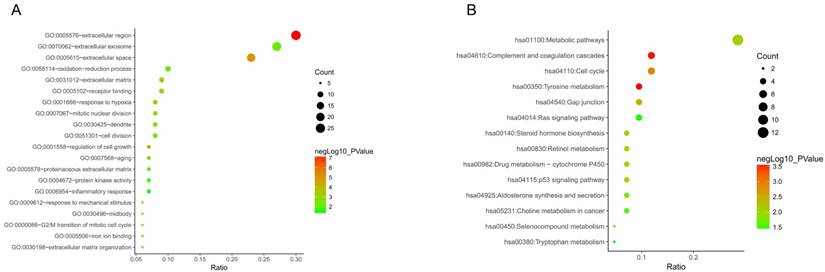
To get deeper understanding of the DEGs function, all DGEs were sent to the KEGG Orthology Based Annotation System (http://kobas.cbi.pku.edu.cn/index.php). The results from GO analysis indicated 20 biological processes enriched (p value < 0.05). Among those, we found that extracellular region, extracellular space, regulation of cell growth, response to hypoxia, response to mechanical stimulus and extracellular matrix were the most significant biological processes (p value < 0.001) (Figure 3A). Furthermore, 14 significant KEGG pathways (p value < 0.05) were enriched out of 87 DEGs, including tyrosine metabolism, complement and coagulation cascades, cell cycle, gap junction, metabolic pathways and steroid hormone biosynthesis (Figure 3B).
Go functional enrichment. (A) GO analysis and (B) KEGG pathway enrichment of 87 DEGs.
PPI network of 87 DEGs
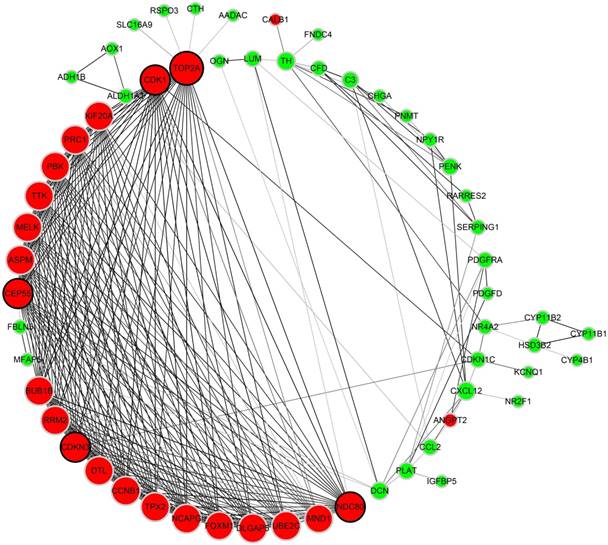
As to the PPI network, under the cutoff of confidence > 0.4 and degree of connectivity >20, five genes (TOP2A, CDK1, NDC80, CDKN3 and CEP55) were regarded as hub genes among 87 DGEs. Then, these five hub genes were chosen for further analysis (Figure 4).
Protein-protein interaction network of 87 DEGs (using STRING). Network nodes stand for proteins (represented with gene names). The color in each node corresponds to the expression of DEGs in comparison to normal adrenal gland samples (red for up-regulation and green for down-regulation). The size of each node and the color intensity in every edge represent the degree of interconnection between network nodes.
Assessment of five hub genes in TCGA and Oncomine database
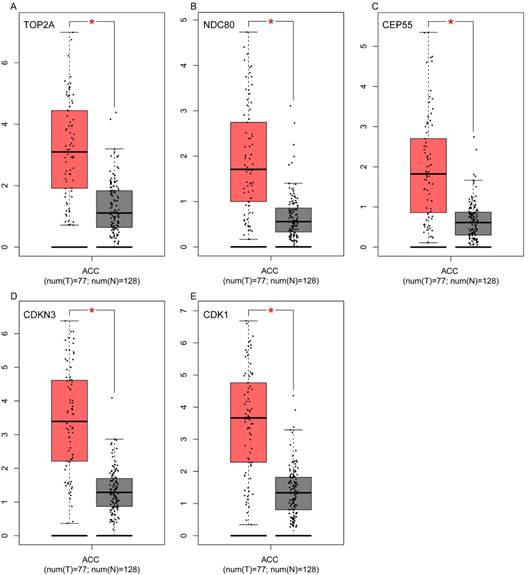
To assess the roles of these five hub genes in ACC, gene expression validations were performed, and all of five hub genes were also upregulated in the TCGA and Oncomine data (Figure 5, 6).
Validation of the five hub genes' expression levels between normal adrenal gland samples and ACC samples based on TCGA and GTEx data in GEPIA. (A) TOP2A, (B) NDC80, (C) CEP55, (D) CDKN3 and (E) CDK1.
Association of five hub genes expression with the prognosis of ACC
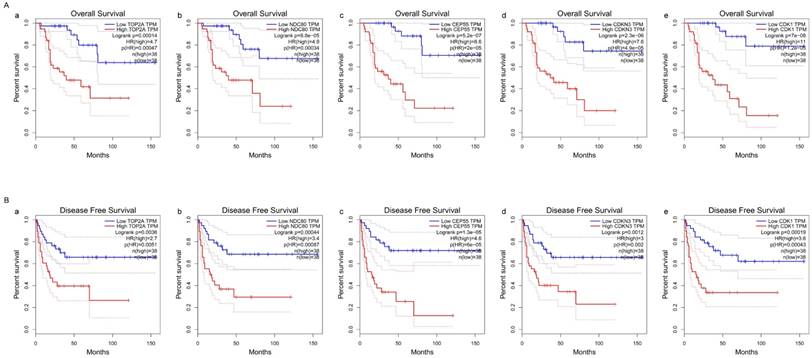
The survival curves were drawn to evaluate the association between five hub genes expression levels and the prognosis of ACC, respectively. ACC prognosis including OS and DFS analysis were conducted. We identified shorter OS duration (Figure 7A) and DSF duration (Figure 7B) in cases of higher expression levels of TOP2A, CDK1, NDC80, CDKN3 and CEP55.
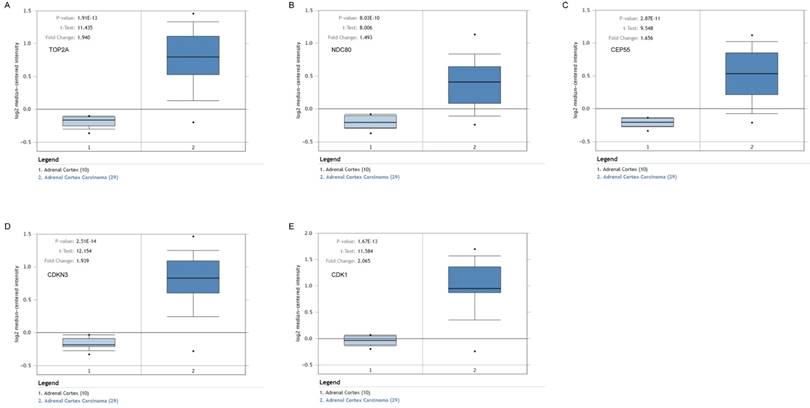
Validation of the five hub genes' expression levels between normal adrenal gland samples and ACC samples based on Oncomine data. (A) TOP2A, (B) NDC80, (C) CEP55, (D) CDKN3 and (E) CDK1.
Survival analysis of five hub genes in ACC (based on TCGA and GTEx data in GEPIA). The red line indicates the samples of genes of high expression and the blue line represents for the samples of genes of low expression. HR stands for hazard ratio. (A) Overall survival analysis. (a) TOP2A, (b) NDC80, (c) CEP55, (d) CDKN3, and (e) CDK1. (B) Disease free survival analysis. (a) TOP2A, (b) NDC80, (c) CEP55, (d) CDKN3, and (e) CDK1.
Association of five hub genes expression with the four pathology stages and pathology T stages of ACC
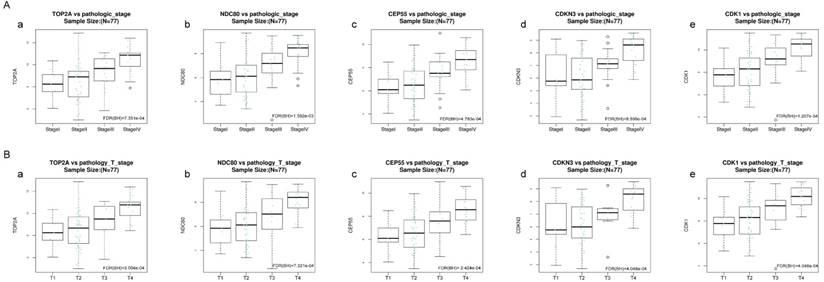
Kruskal-Wallis test was operated to confirm the five hub genes in TCGA database, positive relationship was found between all of five hub genes and ACC progression (pathology stage and pathology T stage, FDR < 0.01) (Figure 8).
Validation of the correlation between the expression levels of five hub genes with the pathologic stage and the pathologic T stage of ACC (based on TCGA data in LinkedOmics). The red line indicates the samples of genes of high expression and the blue line represents for the samples of genes of low expression. FDR (BH) - false discovery rate is calculated by Benjamin-Hochberg (BH) method. (A) Pathology stage. (a) TOP2A, (b) NDC80, (c) CEP55, (d) CDKN3, and (e) CDK1. (B) Pathology T stage. (a) TOP2A, (b) NDC80, (c) CEP55, (d) CDKN3, and (e) CDK1.
The mRNA expression of five hub genes in ACC and normal tissues
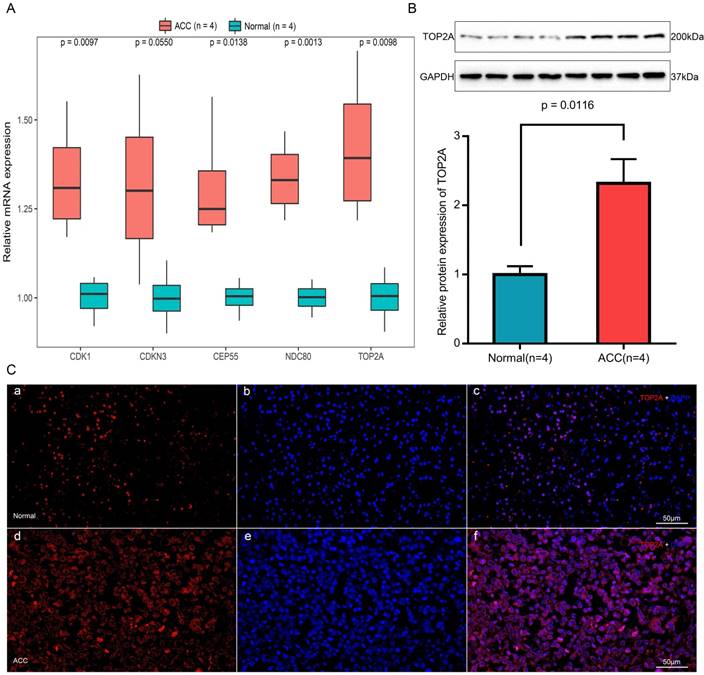
Expression of TOP2A, NDC80, CEP55, CDKN3 and CDK1 mRNA were determined using quantitative real time RT-PCR between ACC samples and normal ones (Figure 9A). TOP2A expression was upregulated by approximately 2-fold at the transcription level (p = 0.0098) in ACC. Real time RT-PCR also showed the rest four genes that CDK1 (p = 0.0097), CEP55 (p = 0.0138) and NDC80 (p = 0.0013) were augmented significantly in ACC samples but with no significant upregulation in the transcription level of CDKN3 (p = 0.0550).
Expression and localization of TOP2A in normal adrenal tissues and adrenocortical carcinoma tissues. (A) Transcriptional levels of five hub genes in ACC tissues and normal ones. (B) Translational levels of TOP2A in ACC tissues and normal ones. (C) Immunofluorescence of TOP2A. (a) Cy3-immunofluorescence (red) indicates TOP2A was observed in normal adrenal cortex. (b) DAPI (blue) indicates nuclear staining in normal adrenal gland tissue. (c) Merged image (magnification × 200). (d) Cy3-immunofluorescence (red) indicates TOP2A was observed in ACC tissue. (e) DAPI (blue) indicates nuclear staining in normal adrenal gland tissue. (f) Merged image (magnification x200).
The translational expression of TOP2A in ACC and normal tissues
The most upregulated gene TOP2A protein was further quantified with Western-blotting analysis (Figure 9B). TOP2A protein bands was detected at a molecular weight of 200 kDa. A significant 2.3-fold increase of TOP2A at translational level was observed between ACC tissues and normal adrenal gland tissues (p = 0.0116).
Immunofluorescence of TOP2A in ACC and normal tissues
As shown in Figure 9C, TOP2A is localized in adrenal cortical cytoplasm and nucleus. In ACC, TOP2A was mainly present in adrenocortical cells nuclei and partly present in the adrenocortical cytoplasm. In normal adrenal gland, the localization is similarly with that in ACC, but in normal adrenal gland, the fluorescence intensity is significantly weaker than that of ACC. That is to say, immunofluorescence also confirms that the expression of TOP2A in ACC is higher than that in normal tissues.
Discussion
The gene expression profiles of neoplasms can be examined comprehensively through microarray technology. It is quickly being used to solve various oncology and pathology issues, such as neoplasms classification [26-31]. It can also serve for the purpose of gene detection [32, 33] to integrate other analogous technologies [34, 35].
The biology knowledge of cancer has been greatly advanced through modern molecular analysis. This method has also emphasized the practical value of these transcriptomic, epigenomic, and genomic biomarkers as candidate indicator to predict and diagnose disease. The comprehensive gene expression profiles methods based on RNA in malignant diseases has been considerably developed [36-38]. Specific gene expression profiles have been identified by many landmark series to distinguish ACCs from the benign adrenal disease [14, 15, 39]. These lay the foundation for the attempt to link these profiles with clinical applications. [24, 39, 40].
In present study, six gene expression matrices of different GEO data sets with a total of 165 ACC samples and 36 normal adrenal gland samples were analyzed and after robust rank analysis, 87 significant genes were chosen for further PPI network. Five hub genes (TOP2A, NDC80, CEP55, CDKN3 and CDK1) with confidence score > 0.4 and degree of connectivity > 20 were then selected for further validation in TCGA, GTEx and Oncomine database. These five hub genes had a very significant statistical distinction with poor prognosis (OS and DFS) and the progression (pathology T stages and pathology stages).
Topoisomerase II Alpha (TOP2A) encoded a DNA topoisomerase, an enzyme that controlled and altered the topologic states of DNA during transcription. Study had demonstrated that TOP2A identified and provided epigenetic basis for the inventive integration of medical treatment for malignant prostate cancer [41]. Moreover, it is possible for use to reveal the predictive power of TOP2A in nasopharyngeal carcinoma and breast cancer [42, 43]. It was reported to be a promising biomarker in progression and prognosis of several kinds of tumor [44-47]. Importantly, Meenu Jain et al demonstrated that the expression of TOP2A is out of control in ACC. TOP2A is responsible for the proliferation and the invasive behavior in ACC cells. It is a desirable goal for ACC treatment. Among the examined TOP2A inhibitors, aclarubicin is a fine potential agent to be assessed in clinical trials for locally aggravated and metastatic ACC in the future [48].
As one of the key elements of outer kinetochore, nuclear division cycle 80 (NDC80) is crucial for the steady development of kinetochore-microtubule anchoring and accurate chromosome separation during mitosis. NDC80 had not reported differentially expressed in ACC compared with normal ones. But several studies found that the mRNA levels of NDC80 which shows strong upregulation escalate significantly in the benign breast tumors in comparison with the healthy breast tissues [49]. What's more, NDC80 was also found upregulated in hepatocellular carcinoma [50].
Centrosomal protein 55 (CEP55), with many aliases such as FLJ10540, C10orf3 and URCC6, is highly expressed many kinds of cancers including human gastric cancer, nasopharyngeal carcinoma, colorectal, cancer and prostate cancer [51-54]. In oral cavity squamous cell carcinoma, CEP55 upregulation is a common abnormality and is linked with tumor development and abbreviated survival. Moreover, the overly expressed CEP55 in malignant oral cancer cells cause the expression of FOXM1 and out of control of MMP-2 which lead to the migration and infiltration of the oral cancer cells [55]. In addition, there may be association between CEP55 and PI3K. CEP55 adjusts the activity of PI3K and lead to cell mutation in hepatocellular carcinoma. The cancer cells may be reverted to their normal condition by the inhibition of CEP55 expression or its other related forms [56].
Cyclin-dependent kinase inhibitor 3 (CDKN3) participate the control of cell cycle. It functions include the regulation of the mitosis through CDK1 signaling pathway [57], the prevention of G1/S transformation by connecting to CDK2 kinase and prohibition of Rb phosphorylation [58, 59]. It also forms compound with p53 and Mdm2 protein, reduces p21 and promotes cell cycle process [60]. Elevation of CDKN3 was also detected in cancers like breast, prostate and renal cancers [61, 62]. What's more, overexpression of CDKN3 linked with high death rate in cervical cancer [63], and highly unrecognizable hepatocellular carcinoma (HCC) [59, 62].
Cyclin dependent kinase 1 (CDK1), or CDC2, belongs to serine/ threonine protein kinase family. It is a catalytical subunit factor that boosts M-phase. As a highly conserved protein kinase complex, it is vital for G1/S and G2/M phase transitions in the process of eukaryotes cell cycle. Glover et al described the upregulation of CDK1 in ACC samples [64]. Based on the meta-analysis of gene expression and extensive genetic assortment ACC profile data, this kinase was also found to be maladjusted in cell cycle pathways [65].
Conclusions
Current study identified five hub genes (TOP2A, NDC80, CEP55, CDKN3 and CDK1) through robust rank analysis and PPI networks. Even with some limitations, such as, the genomic results were based purely on microarray data which does not always reflect gene expression and the sample size used to verify the gene expression is not large enough, our results were in general validated in this large and geographical distinct cohort (from TCGA database). This validation proves the clinical relevance of the identified signatures for ACC patients. Our data further demonstrated the association of these hub genes with the development and limited prediction of ACC. To our knowledge, these genes (NDC80, CEP55 and CDKN3) were first reported to be overexpressed in ACC and were correlated with the development and prediction of ACC. However, further studies are needed before a translation to clinical practice, namely regarding sample collection in this hard to reach population. In general, it was found these five hub genes might play important roles in ACC progress and prognosis.
Abbreviations
ACC: adrenocortical carcinoma; mRNA: message RNA; GEO: Gene Expression Omnibus; TCGA: Then the Cancer Genome Atlas; FDR: false discover rate; PCR: Polymerase Chain Reaction; PPI: protein-protein interaction; GTEx: The Genotype-Tissue Expression; STRING: Search Tool for the Retrieval of Interacting Genes; DEGs: differential expressed genes; OS: overall survival; DFS: disease-free survival; gDNA: genomic DNA; SDS-PAGE: sodium dodecyl sulfate-polyacrylamide; PVDF: transferred to polyvinylidene fluoride; TBST: Tris-buffered saline with Tween; IgG: immunoglobulin G; ECL: enhanced chemiluminescence; TOP2A: Topoisomerase II Alph; NDC80: nuclear division cycle 80; CEP55: Centrosomal protein 55; CDKN3: Cyclin-dependent kinase inhibitor 3; CDK1: Cyclin dependent kinase 1.
Acknowledgements
The excellent technical assistance of Danni Shan and Shanshan Zhang is gratefully acknowledged. We also would like to acknowledge the KEGG database developed by Kanehisa Laboratories. This study was supported in part by National Natural Science Foundation of China (N.81160086, N.81270843 and N.81770757). The funders had no role in study design, data collection and analysis, decision to publish, or preparation of the manuscript.
Availability of data and materials
The present study followed the publication guidelines of Gene Expression Omnibus (GEO) (https://www.ncbi.nlm.nih.gov/geo/info/disclaimer.html) and TCGA Research Network (https://cancergenome.nih.gov/abouttcga/policies/ethicslawpolicy). Thus, no further ethical approvals were required.
Competing Interests
The authors have declared that no competing interest exists.
References
1. Fassnacht M, Libe R, Kroiss M, Allolio B. Adrenocortical carcinoma: a clinician's update. Nat Rev Endocrinol. 2011;7:323-35
2. Fassnacht M, Kroiss M, Allolio B. Update in adrenocortical carcinoma. J Clin Endocrinol Metab. 2013;98:4551-64
3. Icard P, Goudet P, Charpenay C, Andreassian B, Carnaille B, Chapuis Y. et al. Adrenocortical carcinomas: surgical trends and results of a 253-patient series from the French Association of Endocrine Surgeons study group. World J Surg. 2001;25:891-7
4. Wooten MD, King DK. Adrenal cortical carcinoma. Epidemiology and treatment with mitotane and a review of the literature. Cancer. 1993;72:3145-55
5. Luton JP, Cerdas S, Billaud L, Thomas G, Guilhaume B, Bertagna X. et al. Clinical features of adrenocortical carcinoma, prognostic factors, and the effect of mitotane therapy. N Engl J Med. 1990;322:1195-201
6. Soreide JA, Brabrand K, Thoresen SO. Adrenal cortical carcinoma in Norway, 1970-1984. World J Surg. 1992;16:663-7 discussion 8
7. Copeland PM. The incidentally discovered adrenal mass. Ann Intern Med. 1983;98:940-5
8. Lipsett MB, Hertz R, Ross GT. Clinical and Pathophysiologic Aspects of Adrenocortical Carcinoma. Am J Med. 1963;35:374-83
9. Beuschlein F, Reincke M, Karl M, Travis WD, Jaursch-Hancke C, Abdelhamid S. et al. Clonal composition of human adrenocortical neoplasms. Cancer Res. 1994;54:4927-32
10. Boushey RP, Dackiw AP. Adrenal cortical carcinoma. Curr Treat Options Oncol. 2001;2:355-64
11. Kjellman M, Kallioniemi OP, Karhu R, Hoog A, Farnebo LO, Auer G. et al. Genetic aberrations in adrenocortical tumors detected using comparative genomic hybridization correlate with tumor size and malignancy. Cancer Res. 1996;56:4219-23
12. Dackiw AP, Lee JE, Gagel RF, Evans DB. Adrenal cortical carcinoma. World J Surg. 2001;25:914-26
13. Sidhu S, Gicquel C, Bambach CP, Campbell P, Magarey C, Robinson BG. et al. Clinical and molecular aspects of adrenocortical tumourigenesis. ANZ J Surg. 2003;73:727-38
14. Giordano TJ, Thomas DG, Kuick R, Lizyness M, Misek DE, Smith AL. et al. Distinct transcriptional profiles of adrenocortical tumors uncovered by DNA microarray analysis. Am J Pathol. 2003;162:521-31
15. de Fraipont F, El Atifi M, Cherradi N, Le Moigne G, Defaye G, Houlgatte R. et al. Gene expression profiling of human adrenocortical tumors using complementary deoxyribonucleic Acid microarrays identifies several candidate genes as markers of malignancy. J Clin Endocrinol Metab. 2005;90:1819-29
16. Velazquez-Fernandez D, Laurell C, Geli J, Hoog A, Odeberg J, Kjellman M. et al. Expression profiling of adrenocortical neoplasms suggests a molecular signature of malignancy. Surgery. 2005;138:1087-94
17. Slater EP, Diehl SM, Langer P, Samans B, Ramaswamy A, Zielke A. et al. Analysis by cDNA microarrays of gene expression patterns of human adrenocortical tumors. Eur J Endocrinol. 2006;154:587-98
18. Gautier L, Cope L, Bolstad BM, Irizarry RA. affy-analysis of Affymetrix GeneChip data at the probe level. Bioinformatics. 2004;20:307-15
19. Kolde R, Laur S, Adler P, Vilo J. Robust rank aggregation for gene list integration and meta-analysis. Bioinformatics. 2012;28:573-80
20. Xie C, Mao X, Huang J, Ding Y, Wu J, Dong S. et al. KOBAS 2.0: a web server for annotation and identification of enriched pathways and diseases. Nucleic Acids Res. 2011;39:W316-22
21. Szklarczyk D, Franceschini A, Wyder S, Forslund K, Heller D, Huerta-Cepas J. et al. STRING v10: protein-protein interaction networks, integrated over the tree of life. Nucleic Acids Res. 2015;43:D447-52
22. Shannon P, Markiel A, Ozier O, Baliga NS, Wang JT, Ramage D. et al. Cytoscape: a software environment for integrated models of biomolecular interaction networks. Genome Res. 2003;13:2498-504
23. Tang Z, Li C, Kang B, Gao G, Li C, Zhang Z. GEPIA: a web server for cancer and normal gene expression profiling and interactive analyses. Nucleic Acids Res. 2017;45:W98-W102
24. Giordano TJ, Kuick R, Else T, Gauger PG, Vinco M, Bauersfeld J. et al. Molecular classification and prognostication of adrenocortical tumors by transcriptome profiling. Clin Cancer Res. 2009;15:668-76
25. Vasaikar SV, Straub P, Wang J, Zhang B. LinkedOmics: analyzing multi-omics data within and across 32 cancer types. Nucleic Acids Res. 2018;46:D956-D63
26. Giordano TJ, Shedden KA, Schwartz DR, Kuick R, Taylor JM, Lee N. et al. Organ-specific molecular classification of primary lung, colon, and ovarian adenocarcinomas using gene expression profiles. Am J Pathol. 2001;159:1231-8
27. Golub TR, Slonim DK, Tamayo P, Huard C, Gaasenbeek M, Mesirov JP. et al. Molecular classification of cancer: class discovery and class prediction by gene expression monitoring. Science. 1999;286:531-7
28. Lakhani SR, Ashworth A. Microarray and histopathological analysis of tumours: the future and the past? Nat Rev Cancer. 2001;1:151-7
29. Liotta L, Petricoin E. Molecular profiling of human cancer. Nat Rev Genet. 2000;1:48-56
30. Yeang CH, Ramaswamy S, Tamayo P, Mukherjee S, Rifkin RM, Angelo M. et al. Molecular classification of multiple tumor types. Bioinformatics. 2001;17(Suppl 1):S316-22
31. Su AI, Welsh JB, Sapinoso LM, Kern SG, Dimitrov P, Lapp H. et al. Molecular classification of human carcinomas by use of gene expression signatures. Cancer Res. 2001;61:7388-93
32. Ricci MS, el-Deiry WS. Novel strategies for therapeutic design in molecular oncology using gene expression profiles. Curr Opin Mol Ther. 2000;2:682-90
33. Meltzer PS. Spotting the target: microarrays for disease gene discovery. Curr Opin Genet Dev. 2001;11:258-63
34. Green CD, Simons JF, Taillon BE, Lewin DA. Open systems: panoramic views of gene expression. J Immunol Methods. 2001;250:67-79
35. Madden SL, Wang CJ, Landes G. Serial analysis of gene expression: from gene discovery to target identification. Drug Discov Today. 2000;5:415-25
36. Argani P, Rosty C, Reiter RE, Wilentz RE, Murugesan SR, Leach SD. et al. Discovery of new markers of cancer through serial analysis of gene expression: prostate stem cell antigen is overexpressed in pancreatic adenocarcinoma. Cancer Res. 2001;61:4320-4
37. Hough CD, Sherman-Baust CA, Pizer ES, Montz FJ, Im DD, Rosenshein NB. et al. Large-scale serial analysis of gene expression reveals genes differentially expressed in ovarian cancer. Cancer Res. 2000;60:6281-7
38. Nacht M, Ferguson AT, Zhang W, Petroziello JM, Cook BP, Gao YH. et al. Combining serial analysis of gene expression and array technologies to identify genes differentially expressed in breast cancer. Cancer Res. 1999;59:5464-70
39. de Reynies A, Assie G, Rickman DS, Tissier F, Groussin L, Rene-Corail F. et al. Gene expression profiling reveals a new classification of adrenocortical tumors and identifies molecular predictors of malignancy and survival. J Clin Oncol. 2009;27:1108-15
40. Fragoso MC, Almeida MQ, Mazzuco TL, Mariani BM, Brito LP, Goncalves TC. et al. Combined expression of BUB1B, DLGAP5, and PINK1 as predictors of poor outcome in adrenocortical tumors: validation in a Brazilian cohort of adult and pediatric patients. Eur J Endocrinol. 2012;166:61-7
41. Kirk JS, Schaarschuch K, Dalimov Z, Lasorsa E, Ku S, Ramakrishnan S. et al. Top2a identifies and provides epigenetic rationale for novel combination therapeutic strategies for aggressive prostate cancer. Oncotarget. 2015;6:3136-46
42. Lan J, Huang HY, Lee SW, Chen TJ, Tai HC, Hsu HP. et al. TOP2A overexpression as a poor prognostic factor in patients with nasopharyngeal carcinoma. Tumour Biol. 2014;35:179-87
43. Xu YC, Zhang FC, Li JJ, Dai JQ, Liu Q, Tang L. et al. RRM1, TUBB3, TOP2A, CYP19A1, CYP2D6: Difference between mRNA and protein expression in predicting prognosis of breast cancer patients. Oncol Rep. 2015;34:1883-94
44. Zhang Z, Liu P, Wang J, Gong T, Zhang F, Ma J. et al. Ubiquitin-conjugating enzyme E2C regulates apoptosis-dependent tumor progression of non-small cell lung cancer via ERK pathway. Med Oncol. 2015;32:149
45. Morikawa T, Kawai T, Abe H, Kume H, Homma Y, Fukayama M. UBE2C is a marker of unfavorable prognosis in bladder cancer after radical cystectomy. Int J Clin Exp Pathol. 2013;6:1367-74
46. Psyrri A, Kalogeras KT, Kronenwett R, Wirtz RM, Batistatou A, Bournakis E. et al. Prognostic significance of UBE2C mRNA expression in high-risk early breast cancer. A Hellenic Cooperative Oncology Group (HeCOG) Study. Ann Oncol. 2012;23:1422-7
47. Loussouarn D, Campion L, Leclair F, Campone M, Charbonnel C, Ricolleau G. et al. Validation of UBE2C protein as a prognostic marker in node-positive breast cancer. Br J Cancer. 2009;101:166-73
48. Jain M, Zhang L, He M, Zhang YQ, Shen M, Kebebew E. TOP2A is overexpressed and is a therapeutic target for adrenocortical carcinoma. Endocr Relat Cancer. 2013;20:361-70
49. Bieche I, Vacher S, Lallemand F, Tozlu-Kara S, Bennani H, Beuzelin M. et al. Expression analysis of mitotic spindle checkpoint genes in breast carcinoma: role of NDC80/HEC1 in early breast tumorigenicity, and a two-gene signature for aneuploidy. Mol Cancer. 2011;10:23
50. Zhu P, Jin J, Liao Y, Li J, Yu XZ, Liao W. et al. A novel prognostic biomarker SPC24 up-regulated in hepatocellular carcinoma. Oncotarget. 2015;6:41383-97
51. Tao J, Zhi X, Tian Y, Li Z, Zhu Y, Wang W. et al. CEP55 contributes to human gastric carcinoma by regulating cell proliferation. Tumour Biol. 2014;35:4389-99
52. Chen CH, Shiu LY, Su LJ, Huang CY, Huang SC, Huang CC. et al. FLJ10540 is associated with tumor progression in nasopharyngeal carcinomas and contributes to nasopharyngeal cell proliferation, and metastasis via osteopontin/CD44 pathway. J Transl Med. 2012;10:93
53. Inoda S, Morita R, Hirohashi Y, Torigoe T, Asanuma H, Nakazawa E. et al. The feasibility of Cep55/c10orf3 derived peptide vaccine therapy for colorectal carcinoma. Exp Mol Pathol. 2011;90:55-60
54. Shiraishi T, Terada N, Zeng Y, Suyama T, Luo J, Trock B. et al. Cancer/Testis Antigens as potential predictors of biochemical recurrence of prostate cancer following radical prostatectomy. J Transl Med. 2011;9:153
55. Chen CH, Chien CY, Huang CC, Hwang CF, Chuang HC, Fang FM. et al. Expression of FLJ10540 is correlated with aggressiveness of oral cavity squamous cell carcinoma by stimulating cell migration and invasion through increased FOXM1 and MMP-2 activity. Oncogene. 2009;28:2723-37
56. Chen CH, Lu PJ, Chen YC, Fu SL, Wu KJ, Tsou AP. et al. FLJ10540-elicited cell transformation is through the activation of PI3-kinase/AKT pathway. Oncogene. 2007;26:4272-83
57. Nalepa G, Barnholtz-Sloan J, Enzor R, Dey D, He Y, Gehlhausen JR. et al. The tumor suppressor CDKN3 controls mitosis. J Cell Biol. 2013;201:997-1012
58. Gyuris J, Golemis E, Chertkov H, Brent R. Cdi1, a human G1 and S phase protein phosphatase that associates with Cdk2. Cell. 1993;75:791-803
59. Xing C, Xie H, Zhou L, Zhou W, Zhang W, Ding S. et al. Cyclin-dependent kinase inhibitor 3 is overexpressed in hepatocellular carcinoma and promotes tumor cell proliferation. Biochem Biophys Res Commun. 2012;420:29-35
60. Okamoto K, Kitabayashi I, Taya Y. KAP1 dictates p53 response induced by chemotherapeutic agents via Mdm2 interaction. Biochem Biophys Res Commun. 2006;351:216-22
61. Lee SW, Reimer CL, Fang L, Iruela-Arispe ML, Aaronson SA. Overexpression of kinase-associated phosphatase (KAP) in breast and prostate cancer and inhibition of the transformed phenotype by antisense KAP expression. Mol Cell Biol. 2000;20:1723-32
62. Lai MW, Chen TC, Pang ST, Yeh CT. Overexpression of cyclin-dependent kinase-associated protein phosphatase enhances cell proliferation in renal cancer cells. Urol Oncol. 2012;30:871-8
63. Espinosa AM, Alfaro A, Roman-Basaure E, Guardado-Estrada M, Palma I, Serralde C. et al. Mitosis is a source of potential markers for screening and survival and therapeutic targets in cervical cancer. PLoS One. 2013;8:e55975
64. Glover AR, Zhao JT, Gill AJ, Weiss J, Mugridge N, Kim E. et al. MicroRNA-7 as a tumor suppressor and novel therapeutic for adrenocortical carcinoma. Oncotarget. 2015;6:36675-88
65. Szabo PM, Tamasi V, Molnar V, Andrasfalvy M, Tombol Z, Farkas R. et al. Meta-analysis of adrenocortical tumour genomics data: novel pathogenic pathways revealed. Oncogene. 2010;29:3163-72
Author contact
![]() Corresponding author: Dr Xinhua Zhang, Department of Urology, Zhongnan Hospital of Wuhan University, Donghu Road 169, Wuhan, Hubei 430071, P.R. China. Email: zhangxinhuadcom
Corresponding author: Dr Xinhua Zhang, Department of Urology, Zhongnan Hospital of Wuhan University, Donghu Road 169, Wuhan, Hubei 430071, P.R. China. Email: zhangxinhuadcom