Impact Factor ISSN: 1837-9664

 Global reach, higher impact
J Cancer 2018; 9(23):4503-4509. doi:10.7150/jca.27437 This issue Cite
Research Paper
Ribonucleotide Reductase Inhibitor 3-AP Induces Oncogenic Virus Infected Cell Death and Represses Tumor Growth
Lu Dai1,2,3 ![]() , Jungang Chen3, Yueyu Cao2, Luis Del Valle4, Zhiqiang Qin1,2,3
, Jungang Chen3, Yueyu Cao2, Luis Del Valle4, Zhiqiang Qin1,2,3 ![]()
1. Department of Pediatrics, East Hospital, Tongji University School of Medicine, Shanghai 200120, China
2. Research Center for Translational Medicine and Key Laboratory of Arrhythmias, East Hospital, Tongji University School of Medicine, Shanghai 200120, China
3. Departments of Genetics, Louisiana State University Health Sciences Center, Louisiana Cancer Research Center, 1700 Tulane Ave., New Orleans, LA 70112, USA
4. Departments of Pathology, Louisiana State University Health Sciences Center, Louisiana Cancer Research Center, 1700 Tulane Ave., New Orleans, LA 70112, USA
Received 2018-5-23; Accepted 2018-9-9; Published 2018-10-31
Abstract
Kaposi's Sarcoma-associated Herpesvirus (KSHV) is the etiologic agent of several human malignancies, particularly Kaposi's Sarcoma (KS), which preferentially arise in immunocompromised patients such as HIV+ subpopulation while still lacking of effective therapeutic options. We recently found that the ribonucleotide reductase (RR) subunit M2 is potentially regulated by the key oncogenic HGF/c-MET pathway in KSHV-related lymphoma cells. One of RR inhibitor, 3-aminopyridine-2-carboxaldehyde thiosemicarbazone (3-AP) effectively induced apoptosis of KSHV+ lymphomas and suppressed tumor progression in vivo. In the current study, we found that 3-AP treatment selectively inhibited the proliferation of KSHV-infected endothelial cells, the major cellular components of KS, through inducing DNA damage, reducing the levels of intracellular iron and reactive oxygen species (ROS) and increasing viral lytic gene expression. By using a KS-like nude mouse model, we found that 3-AP treatment significantly suppressed KSHV induced tumorigenesis in vivo. Taken together, our data demonstrate targeting RR by 3-AP may represent a promising strategy for improving the treatment of KS in future.
Keywords: KSHV, Kaposi's Sarcoma, Ribonucleotide reductase, 3-AP
Introduction
Kaposi sarcoma-associated herpesvirus (KSHV) represents a principal causative agent of cancers arising in immunocompromised patients, particularly Kaposi's Sarcoma (KS) [1]. In some AIDS pandemic counties of Africa, KS has become one of the common cancers affecting adults and children with significant morbidity and mortality [2-4]. Although the incidence of AIDS-associated KS (AIDS-KS) in the Western world has declined since the widespread implementation of combined antiretroviral treatment (cART), up to 50% of patients with AIDS-KS never achieve total remission [5]. In addition, the issues of KS in the context of immune reconstitution inflammatory syndrome (IRIS) and its impact on cART rollout initiatives have become increasingly apparent recently [6, 7]. Furthermore, although treatments for KS exist, none is curative, which therefore requiring to develop more effective therapeutic strategies.
We have recently shown that the signaling pathway of Hepatocyte Growth Factor (HGF)/c-MET is highly activated in KSHV+ Primary Effusion Lymphoma (PEL), another type of human cancer caused by KSHV infection [8]. One of the selective c-MET inhibitors, PF-2341066, can significantly induce apoptosis in PEL cells and effectively suppress tumor progression in vivo [8]. Our transcriptome analysis shows that the ribonucleotide reductase subunit M2 (RRM2) is tightly regulated by the HGF/c-MET signaling in PEL. Ribonucleotide reductase (RR) is a potential target for developing anticancer agents because of its unique role in DNA synthesis, tumor growth, metastasis, and chemoresistance [9]. The human RR is composed of two subunits, α subunits (RRM1) and β subunits (RRM2). The α subunits contain one catalytic site and 2 binding sites for those varied enzyme regulators, while the β subunits (RRM2) can recruit a binuclear iron cofactor and generate a stable tyrosyl radical for the catalysis reactions [10]. We recently reported that one of RR inhibitor, 3-aminopyridine-2-carboxaldehyde thiosemicarbazone (3-AP) effectively induced caspase-dependent apoptosis of PEL cells and suppressed tumor progression in vivo [8, 11]. In the current study, we are exploring the effects of 3-AP treatment on KSHV-infected endothelial cells (which representing the major cellular components of KS) as well as the underlying mechanisms. We are also evaluating the anticancer efficacy of 3-AP in a recently established KS-like xenograft model.
Materials and Methods
Cell culture and reagents
Telomerase-immortalized human umbilical vein endothelial (TIVE) and KSHV long-term-infected TIVE cells (TIVE-LTC) were cultured as previously described [12]. All cells were incubated at 37°C in 5% CO2. All experiments were carried out using cells harvested at low (<20) passages. 3-aminopyridine-2-carboxaldehyde thiosemicarbazone (3-AP) and iron chelator Deferasirox were purchased from Sigma.
Cell proliferation and apoptosis assays
Cell proliferation was measured by using the WST-1 assays (Roche) according to the manufacturers' instructions. Briefly, after the period of treatment, 10 μL/well of cell proliferation reagent WST-1 was added into 96-well microplate and incubated for 3 h at 37°C in 5% CO2. The absorbance of samples was measured by using a microplate reader at 450 nm. Flow cytometry was used for quantitative assessment of apoptosis using the FITC-Annexin V/propidium iodide (PI) Apoptosis Detection Kit I (BD Pharmingen).
Immunoblotting
Total cell lysates (20μg) were resolved by 10% SDS-PAGE, transferred to nitrocellulose membranes, and immunoblotted with antibodies for p-H2A.X/ t-H2A.X, Transferrin receptor, Ferroportin, Rac1, p22phox (Cell Signaling), RRM2 (Santa Cruz), Nox1 (Abcam), K8.1 (ABI) and β-Actin (Sigma) for loading controls. Immunoreactive bands were identified using an enhanced chemiluminescence reaction (Perkin-Elmer), and visualized by autoradiography.
CometAssay
The DNA damage was evaluated by using the Reagent Kit for Single Cell Gel Electrophoresis Assay/CometAssay (Trevigen) as previously described [8]. The slides were viewed by using epifluorescence microscopy. The tail moment was calculated from 100 cells collected per single measurement by utilizing specialized comet software included in the Automated CometAssay System (Loats Associates Inc).
Iron detection
The concentrations of intracellular iron were quantified using a commercial iron-detection kit (Abcam), according to the manufacturer's instructions.
ROS measurement
Cells were loaded with 10 μM of the ROS dye c-H2DCFDA (Invitrogen) for 30 min at 37°C in Hanks' Balanced Salt Solution (HBSS) containing calcium and magnesium (HBSS/Ca/Mg). Cells were washed once with HBSS/Ca/Mg to remove dye, resuspended in HBSS/Ca/Mg and subjected to flow cytometry analyses as described elsewhere [13].
NADPH oxidase activities assays
The chemiluminescence-based NADPH oxidase activities assays were performed as described previously [14]. After drug-treatment, cells were centrifuged at 500 g for 10 min at 4°C. The cell pellet was resuspended with 35 μL ice-cold lysis buffer and kept on ice for 20 min. To a final 200 μL of HBSS/ Ca/Mg buffer containing NADPH (1 μM, Sigma) and lucigenin (20 μM, Sigma), 5 μL of cell lysates was added to initiate the reaction for 5 min at 37°C. Chemiluminescence was measured immediately using a Synergy HT microplate reader (BioTek Instruments).
qRT-PCR
Total RNA was isolated using the RNeasy Mini kit (Qiagen), and cDNA was synthesized from equivalent total RNA using a SuperScript III First-Strand Synthesis SuperMix Kit (Invitrogen) according to the manufacturer's instructions. Primers used for amplification of target genes are listed in Table 1. Amplification was carried out using an iCycler IQ Real-Time PCR Detection System, and cycle threshold (Ct) values were tabulated in duplicate for each gene of interest in each experiment. “No template” (water) controls were used to ensure minimal background contamination. Using mean Ct values tabulated for each gene, and paired Ct values for β-actin as a loading control, fold changes for experimental groups relative to assigned controls were calculated using automated iQ5 2.0 software (Bio-rad).
Primer sequences for qRT-PCR in this study.
| Gene | Sequences (5'→3') |
|---|---|
| Rta | sense TAATGTCAGCGTCCACTCC |
| antisense TTCTGGCACGGTCAAAGC | |
| vGpcr | sense CATCCGCTGCACTGTTAA |
| antisense GCTTTGTCCTCCTCACCA | |
| K8.1 | sense CACCACAGAACTGACCGATG |
| antisense TGGCACACGGTTACTAGCAC | |
| Orf57 | sense GGGTGGTTTGATGAGAAGGA |
| antisense CGCTACCAAATATGCCACCT | |
| β-actin | sense GGAAATCGTGCGTGACATT |
| antisense GACTCGTCATACTCCTGCTTG |
Nude mouse xenograft model and immunohistochemistry
Cells were counted and washed once in ice-cold PBS, and 1×10⁶ cells in 50 µL PBS plus 50 µL growth factor-depleted Matrigel (BD Biosciences) were injected subcutaneously into the flanks of nude mice, 6-8 week-old, male (Jackson Laboratory). When tumors reach ~10 mm in diameter for about one week, mice were randomly divided into groups (4 mice per group) and received in situ subcutaneous injection with either vehicle or 3-AP (20 mg/kg), 3 days/week. The mice were observed and measured every 2~3 d for the presence of palpable tumors. At the end of experiment, the tumors were excised for subsequent immunohistochemistry staining analysis. Immunohistochemistry was performed using the Avidin-Biotin-Peroxidase complex system, according to the manufacturer's instructions (Vectastain Elite ABC Peroxidase Kit; Vector Laboratories). In our modified protocol, sections were deparaffinized in xylene and re-hydrated through a descending alcohol gradient. For non-enzymatic antigen retrieval, slides were heated in 0.01 M sodium citrate buffer (pH 6.0) to 95ºC under vacuum for 40 min and allowed to cool for 30 min at room temperature, then rinsed with PBS and incubated in MeOH/3% H2O2 for 20 min to quench endogenous peroxidase. Slides were then washed with PBS and blocked with 5% normal goat serum in 0.1% PBS/BSA for 2 h at room temperature, then incubated overnight with indicated antibody at 1:200-1:400 dilution in 0.1% PBS/BSA. The following day, slides were incubated with appropriate secondary antibody at room temperature for 1 h, followed by avidin-biotin peroxidase complexes for 1 h at room temperature. Finally, slides were developed using a diaminobenzidine substrate, counterstained with hematoxylin, dehydrated through an ascending alcohol gradient, cleared in xylene, and coverslipped with Permount. Images were collected using an Olympus BX61 microscope equipped with a high resolution DP72 camera and CellSense image capture software. All protocols were approved by the LSUHSC Animal Care and Use Committee in accordance with national guidelines.
Statistical analyses
Significance for differences between experimental and control groups was determined using the two-tailed Student's t-test (Excel 2016), and p values < 0.05 or < 0.01 were considered significant or highly significant, respectively.
Results and Discussion
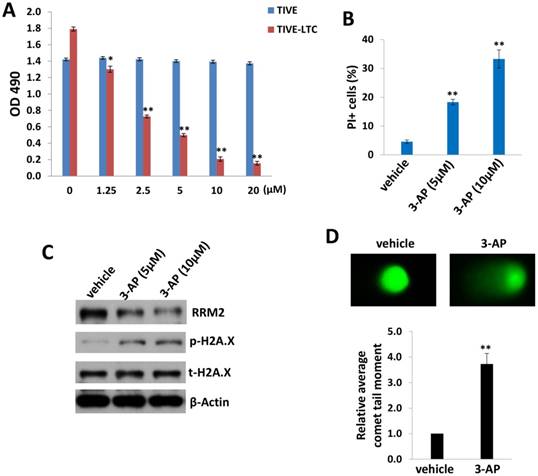
We first tested and compared the effects of 3-AP treatment between KSHV long-term-infected telomerase-immortalized human umbilical vein endothelial (TIVE-LTC) and non-infected parental TIVE cells [12], using the WST-1 cell proliferation assays. We found that 3-AP treatment effectively reduced TIVE-LTC proliferation in a dose-dependent manner, whereas it almost had no effects on non-infected TIVE proliferation at the same dose range (Fig. 1A). Additionally, the flow cytometry data confirmed that 3-AP treatment significantly induced TIVE-LTC cell death (PI+) (Fig. 1B) but not for TIVE cells (data not shown). Interestingly, we did not detect any increased Annexin V+ cells in these samples whenever collected at either early time points (10-120 min) or late time points (24-48 h), implying apoptosis is not the major reason to cause TIVE-LTC cell death in these situations (data not shown). To further understand how 3-AP causing cell death of TIVE-LTC, we found that 3-AP treatment greatly reduced RRM2 expression while increasing the expression of one DNA damage marker, phosphor-H2A.X, in TIVE-LTC as demonstrated by immunoblots (Fig. 1C). 3-AP caused DNA damage was further demonstrated by using CometAssay: the obvious comet tail moment in 3-AP-treated TIVE-LTC when compared to vehicle-treated cells (Fig. 1D).
3-AP treatment represses KSHV-infected endothelial cell proliferation and induces DNA damage. (A) TIVE-LTC and TIVE were incubated with indicated concentrations of 3-AP for 72 h, then cell proliferation was measured using the WST-1 assays. (B-D) TIVE-LTC were incubated with indicated concentrations of 3-AP for 48 h and cell viability was measured by using flow cytometry as described in the Methods. Protein expression and DNA damage were measured by using immunoblots and CometAssay, respectively. Error bars represent the S.D. for 3 independent experiments. *= p<0.05; **= p<0.01.
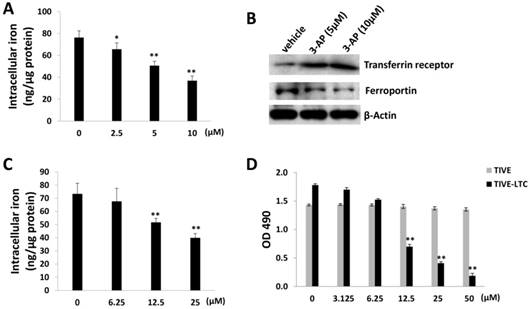
As a RR inhibitor, 3-AP has also been found with iron chelator function [15]. Interestingly, recent epidemiological data suggest that iron may be one of the cofactors involved in the pathogenesis of KS, for example, soil exposure and percutaneous penetration of ferromagnetic particles have been found as a risk factor for KS [16]. Amazingly, a high iron load is expected to be found in the different epidemiological forms of KS [17]. The addition of iron salts to KS-derived cells can stimulate their growth [18]. Here we found that 3-AP treatment significantly reduced the levels of intracellular iron from TIVE-LTC by using a commercial iron-detection kit as described in the Methods (Fig. 2A). We next checked the affecting of the expression of major proteins responsible for iron uptake (e.g., Transferrin receptor) or export (e.g., Ferroportin) [19] by 3-AP. Our data showed that 3-AP treatment obviously increased Transferrin receptor but redfigucing Ferroportin expression from TIVE-LTC (Fig. 2B), due to a cell striving to maintain cellular iron levels through upregulation of iron uptake and downregulation of iron export. As a control, our data showed that one of iron chelators, Deferasirox, also effectively reduced the levels of intracellular iron from TIVE-LTC and inhibited cell growth (Fig. 2C-D).
3-AP treatment reduces intracellular iron levels from TIVE-LTC. (A) TIVE-LTC were incubated with indicated concentrations of 3-AP for 48 h, then intracellular iron concentrations were quantified as described in the Methods. The results were normalized with total protein concentrations. (B) Protein expression was measured by immunoblots. (C-D) TIVE-LTC were incubated with indicated concentrations of Deferasirox for 72 h, then intracellular iron concentrations and cell proliferation were measured as described previously. Error bars represent the S.D. for 3 independent experiments. *= p<0.05; **= p<0.01.
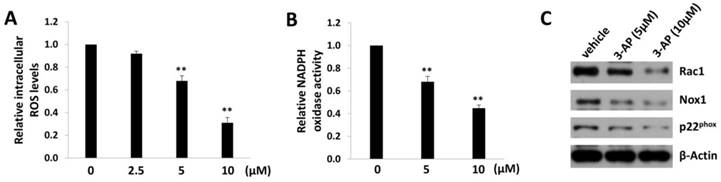
In fact, iron can create reactive oxygen species (ROS) by participating in Fenton reaction where hydroxyl radical is produced [20]. Therefore, we measured the intracellular ROS levels by using a ROS-specific dye, 5-(and-6)-chloromethyl-2',7'-dichlorodihydrofluorescein diacetate, acetyl ester (CM-H2DCFDA) [13]. We found that 3-AP treatment significantly reduced the levels of intracellular ROS from TIVE-LTC in a dose-dependent manner (Fig. 3A). As we know, ROS production requires the activities of NADPH oxidase complex, which contains various NADPH oxidases and cytosolic components depending on the stimulus signals and cell types [21]. Here we confirmed that 3-AP treatment significantly repressed the activities of NADPH oxidases within TIVE-LTC (Fig. 3B), using a luminescence-based biochemical assay as described previously [14]. Our additional data demonstrated that 3-AP treatment mainly downregulated the expression of Rac1/Nox1/ p22phox axis in NADPH oxidases complex (Fig. 3C).
3-AP treatment reduces intracellular ROS levels from TIVE-LTC. (A) TIVE-LTC were incubated with indicated concentrations of 3-AP for 48 h, then the levels of intracellular reactive oxygen species (ROS) were quantified using the ROS-specific dye CM-H2DCFDA and flow cytometry analysis, and normalized to ROS levels for the vehicle-incubated cells. (B-C) NADPH oxidases activities were measured as described in Methods and protein expression was measured by immunoblots. Error bars represent the S.D. for 3 independent experiments. **= p<0.01.
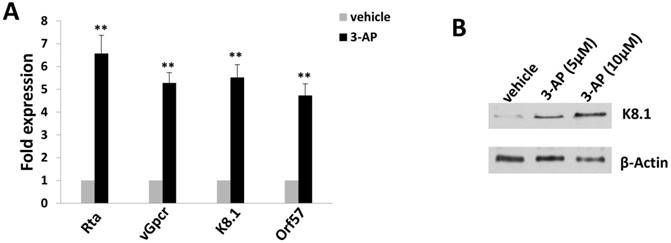
Since TIVE-LTC is a KSHV long-term-infected cell line, we also checked whether 3-AP treatment affected viral gene expression using qRT-PCR. We found that 3-AP treatment significantly induced the expression of viral lytic genes (e.g., Rta, vGpcr, K8.1, Orf57) from TIVE-LTC (Fig. 4A). Immunoblots analysis confirmed the elevated expression of representative lytic protein, K8.1, within TIVE-LTC by 3-AP (Fig. 4B). These data indicate that the increasing of viral lytic gene expression may represent another mechanism for 3-AP induced KSHV-infected cell death.
3-AP treatment increases KSHV lytic gene expression from TIVE-LTC. (A-B) TIVE-LTC were incubated with indicated concentrations of 3-AP for 72 h, then qRT-PCR was used to quantify viral transcripts representing lytic genes (Rta, vGpcr, K8.1 and Orf57). Data were normalized to vehicle-treated cells, and using β-actin as a loading control. Protein expression was measured using immunoblots. Error bars represent the S.D. for 3 independent experiments. **= p<0.01.
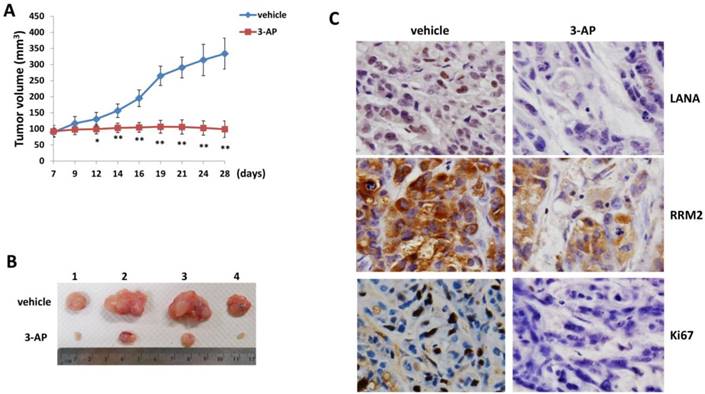
By using an established KS-like nude mice model with TIVE-LTC [22], we tested the effects of 3-AP treatment on KSHV induced tumorigenesis in vivo. We injected TIVE-LTC (1 x 10⁶ cells 1:1 with growth factor-depleted Matrigel) subcutaneously into the flanks of nude mice. When tumors reached ~10 mm in diameter, mice received in situ subcutaneous injection with either vehicle or 3-AP (20 mg/kg of body weight), 3 days/week. The mice were observed every 2~3 d and palpable tumors were measured for additional 3 weeks. Our results indicated that 3-AP treatment significantly repressed tumor growth in these mice while vehicle treatment had no inhibitory effects (Fig. 5A). 3-AP treated mice formed significantly smaller tumors than those from vehicle treated mice after 3-week treatment (Fig. 5B). Immunohistochemistry analyses demonstrated the reduced expression of LANA (a KSHV-encoded major latent protein as the marker for virus latency) [23], RRM2 protein and cellular proliferation indicator Ki67 in tumor tissues isolated from representative 3-AP treated mice when compared to those from vehicle treated mice (Fig. 5C). Taken together, our data indicate that targeting RR by 3-AP may represent a promising strategy for improving the treatment of KS. Interestingly, iron chelators have been shown to overcome chemoresistance and enhance the efficacy of standard chemotherapeutic agents. For instance, both Deferoxamine and Deferasirox are able to overcome cisplatin resistance in oesophageal adenocarcinoma cell lines [24]. Deferasirox has been found to overcome imatinib resistance of chronic myeloid leukemia cells [25]. In the future studies, we will determine whether the combination of 3-AP with other therapies (e.g., chemotherapeutic agents or antioxidant agents) may have the synergistic anti-KS effect in vivo.
3-AP treatment significantly represses KSHV induced tumorigenesis in vivo. (A-B) TIVE-LTC (1 x 10⁶ cells 1:1 with growth factor-depleted Matrigel) were injected subcutaneously into the flanks of nude mice (4 mice per group). When tumors reach ~10 mm in diameter for about one week, mice were received in situ subcutaneous injection with either vehicle or 3-AP (20 mg/kg), 3 days/week. The mice were observed and measured every 2~3 days for the size of palpable tumors for additional 3 weeks. At the end of experiment, the tumors were excised from the site of injection for subsequent analysis. The number 1-4 represents different mice from the same group. Error bars represent the S.D. from one of 2 independent experiments. *=p<0.05, **=p<0.01. (C) Protein expression in tumor tissues from representative mice was measured by using the immunohistochemistry staining as described in the Methods.
Acknowledgements
This work was supported by grants from NIH/NCI 1R01CA228166-01, a DOD Career Development Award (CA140437), a LSU LIFT2 funding as well as the awards from National Natural Science Foundation of China (81472547, 81672924 and 81772930) and the Fundamental Research Funds for the Central Universities (22120180335). Funding sources had no role in study design, data collection and analysis, decision to publish, or preparation of the manuscript.
Competing Interests
The authors have declared that no competing interest exists.
References
1. Chang Y, Cesarman E, Pessin MS, Lee F, Culpepper J, Knowles DM. et al. Identification of herpesvirus-like DNA sequences in AIDS-associated Kaposi's sarcoma. Science. 1994;266:1865-9
2. Wabinga HR, Nambooze S, Amulen PM, Okello C, Mbus L, Parkin DM. Trends in the incidence of cancer in Kampala, Uganda 1991-2010. Int J Cancer. 2014;135:432-9
3. Chokunonga E, Borok MZ, Chirenje ZM, Nyakabau AM, Parkin DM. Trends in the incidence of cancer in the black population of Harare, Zimbabwe 1991-2010. Int J Cancer. 2013;133:721-9
4. Davidson A, Wainwright RD, Stones DK, Kruger M, Hendricks M, Geel J. et al. Malignancies in South African children with HIV. J Pediatr Hematol Oncol. 2014;36:111-7
5. Robey RC, Bower M. Facing up to the ongoing challenge of Kaposi's sarcoma. Curr Opin Infect Dis. 2015;28:31-40
6. Letang E, Lewis JJ, Bower M, Mosam A, Borok M, Campbell TB. et al. Immune reconstitution inflammatory syndrome associated with Kaposi sarcoma: higher incidence and mortality in Africa than in the UK. AIDS. 2013;27:1603-13
7. Cox CM, El-Mallawany NK, Kabue M, Kovarik C, Schutze GE, Kazembe PN. et al. Clinical characteristics and outcomes of HIV-infected children diagnosed with Kaposi sarcoma in Malawi and Botswana. Pediatr Blood Cancer. 2013;60:1274-80
8. Dai L, Trillo-Tinoco J, Cao Y, Bonstaff K, Doyle L, Del Valle L. et al. Targeting HGF/c-MET induces cell cycle arrest, DNA damage, and apoptosis for primary effusion lymphoma. Blood. 2015;126:2821-31
9. Zhou B, Su L, Hu S, Hu W, Yip ML, Wu J. et al. A small-molecule blocking ribonucleotide reductase holoenzyme formation inhibits cancer cell growth and overcomes drug resistance. Cancer Res. 2013;73:6484-93
10. Fan H, Villegas C, Huang A, Wright JA. The mammalian ribonucleotide reductase R2 component cooperates with a variety of oncogenes in mechanisms of cellular transformation. Cancer Res. 1998;58:1650-3
11. Dai L, Lin Z, Qiao J, Chen Y, Flemington EK, Qin Z. Ribonucleotide reductase represents a novel therapeutic target in primary effusion lymphoma. Oncogene. 2017;36:5068-74
12. An FQ, Folarin HM, Compitello N, Roth J, Gerson SL, McCrae KR. et al. Long-term-infected telomerase-immortalized endothelial cells: a model for Kaposi's sarcoma-associated herpesvirus latency in vitro and in vivo. J Virol. 2006;80:4833-46
13. Li X, Feng J, Sun R. Oxidative stress induces reactivation of Kaposi's sarcoma-associated herpesvirus and death of primary effusion lymphoma cells. J Virol. 2011;85:715-24
14. Lee JM, Kim SS, Cho YS. The Role of PPARgamma in Helicobacter pylori Infection and Gastric Carcinogenesis. PPAR Res. 2012;2012:687570
15. Yu Y, Gutierrez E, Kovacevic Z, Saletta F, Obeidy P, Suryo Rahmanto Y. et al. Iron chelators for the treatment of cancer. Curr Med Chem. 2012;19:2689-702
16. Ziegler JL. Endemic Kaposi's sarcoma in Africa and local volcanic soils. Lancet. 1993;342:1348-51
17. Boelaert JR, Weinberg GA, Weinberg ED. Altered iron metabolism in HIV infection: mechanisms, possible consequences, and proposals for management. Infect Agents Dis. 1996;5:36-46
18. Simonart T, Noel JC, Andrei G, Parent D, Van Vooren JP, Hermans P. et al. Iron as a potential co-factor in the pathogenesis of Kaposi's sarcoma? Int J Cancer. 1998;78:720-6
19. Straud S, Zubovych I, De Brabander JK, Roth MG. Inhibition of iron uptake is responsible for differential sensitivity to V-ATPase inhibitors in several cancer cell lines. PLoS One. 2010;5:e11629
20. Kazan HH, Urfali-Mamatoglu C, Gunduz U. Iron metabolism and drug resistance in cancer. Biometals. 2017;30:629-41
21. Lambeth JD. NOX enzymes and the biology of reactive oxygen. Nat Rev Immunol. 2004;4:181-9
22. Dai L, Trillo-Tinoco J, Chen Y, Bonstaff K, Del Valle L, Parsons C. et al. CD147 and downstream ADAMTSs promote the tumorigenicity of Kaposi's sarcoma-associated herpesvirus infected endothelial cells. Oncotarget. 2016;7:3806-18
23. Renne R, Barry C, Dittmer D, Compitello N, Brown PO, Ganem D. Modulation of cellular and viral gene expression by the latency-associated nuclear antigen of Kaposi's sarcoma-associated herpesvirus. J Virol. 2001;75:458-68
24. Ford SJ, Obeidy P, Lovejoy DB, Bedford M, Nichols L, Chadwick C. et al. Deferasirox (ICL670A) effectively inhibits oesophageal cancer growth in vitro and in vivo. Br J Pharmacol. 2013;168:1316-28
25. Kim DS, Na YJ, Kang MH, Yoon SY, Choi CW. Use of deferasirox, an iron chelator, to overcome imatinib resistance of chronic myeloid leukemia cells. Korean J Intern Med. 2016;31:357-66
Author contact
![]() Corresponding authors: Mailing address: Suite 902, Louisiana Cancer Research Center, 1700 Tulane Ave., New Orleans, LA 70112, USA. Phone: (504)-210-3327. E-mail: ldaiedu (Dr. Lu Dai) or zqinedu (Dr. Zhiqiang Qin).
Corresponding authors: Mailing address: Suite 902, Louisiana Cancer Research Center, 1700 Tulane Ave., New Orleans, LA 70112, USA. Phone: (504)-210-3327. E-mail: ldaiedu (Dr. Lu Dai) or zqinedu (Dr. Zhiqiang Qin).