Impact Factor ISSN: 1837-9664

 Global reach, higher impact
J Cancer 2018; 9(24):4650-4658. doi:10.7150/jca.27560 This issue Cite
Research Paper
Proteomic Identification of Plasma Biomarkers in Children and Adolescents with Recurrent Hodgkin Lymphoma
Ombretta Repetto1, Lara Mussolin2, Caterina Elia3, Lia Martina4, Maurizio Bianchi5, Salvatore Buffardi6, Alessandra Sala7, Roberta Burnelli8, Maurizio Mascarin9, Valli De Re10 ![]()
1. Facility of Bio-Proteomics, Immunopathology and Cancer Biomarkers, Centro di Riferimento Oncologico di Aviano (CRO), IRCCS, 33081 Aviano, Italy;
2. Clinic of Pediatric Haemato-Oncology, Department of Women's and Children's Health, University of Padua, Padua, Institute of Paediatric Research - Fondazione Città della Speranza, Padua, Italy;
3. Pediatric Radioterapy Unit, Centro di Riferimento Oncologico di Aviano (CRO), IRCCS, 33081 Aviano, Italy;
4. Facility of Bio-Proteomics, Immunopathology and Cancer Biomarkers, Centro di Riferimento Oncologico di Aviano (CRO), IRCCS, 33081 Aviano, Italy;
5. Pediatric Onco-Hematology and Stem Cell Transplant Division, City of Health and Science, Regina Margherita Children's Hospital, Turin, Italy;
6. Paediatric Haemato-Oncology department, Santobono-Pausilipon Children's Hospital, Napoli, Italy;
7. Department of Paediatrics, Ospedale San Gerardo, University of Milano-Bicocca, Fondazione MBBM, Monza, Italy;
8. Pediatric Oncology University Hospital, Sant'Anna Hospital, Ferrara, Italy;
9. Pediatric Radioterapy Unit, Centro di Riferimento Oncologico di Aviano (CRO), IRCCS, 33081 Aviano, Italy;
10. Facility of Bio-Proteomics, Immunopathology and Cancer Biomarkers, Centro di Riferimento Oncologico di Aviano (CRO), IRCCS, 33081 Aviano, Italy.
Received 2018-5-30; Accepted 2018-8-26; Published 2018-11-24
Abstract
The treatment of paediatric Hodgkin lymphoma (HL) has steadily improved over the years, so that 10- years survival exceed 80%. The purpose of this study was to identify prognostic markers for relapsed HL that might contribute to optimize therapeutic approaches. To this aim we retrospectively analysed differential protein expression profiles obtained from plasma of children/adolescents with HL (age ranging from 10 to 18 years) collected at diagnosis. We examined the protein profiles of 15 HL relapsed (R) patients compared with 14 HL not relapsed (NR) patients treated with the same LH-2004 protocol. Two dimensional difference in gel electrophoresis (2D-DIGE) revealed significant differences (fold change > 1.5; Student's T-test p<0.01) between R and NR patients in 10 proteins: α-1-antitrypsin chain a, apolipoprotein A-IV precursor; inter-α-trypsin inhibitor heavy chain; antithrombin-III; vitronectin; fibrinogen α, β and γ chains, complement C3, and ceruloplasmin. An up-regulation of fibrinogen α (spots 78, 196, 230, 234, 239) and β (spots 98, 291, 296, 300) chains together with a lower level of α-1-antitrypsin (spots 255, 264, 266, 272, 273) were found in R patients, and this difference was validated by immunoblotting. The functional role(s) of these proteins in the coagulation and inflammation associated with paediatric/adolescent HL progression and relapse deserves further investigations.
Keywords: paediatric Hodgkin lymphoma, DIGE, biomarkers, relapse, plasma proteins
Introduction
Over the past decade, the prognosis of paediatric HL has significantly improved with progressive-relapsing disease occurring in less than 20% of patients [1]. At present, the current stage-based risk assignment of HL cannot provide satisfactory prediction of patients at risk for relapse [2].
Improvements in the understanding of HL pathogenesis have led to the development of a number of different therapeutic approaches aimed at identifying the optimal balance between maintaining overall survival and the avoidance of long-term morbidity of therapy, particularly for paediatric HL where long term survival is expected [3]. For this reason, the strategies adopted in paediatric HL are often quite different from those used in adult HL [3], and the establishment of a "standard of care" approach to disease management is complicated by the absence of an adequately defined prognostic criteria. In this context, Farruggia et al. [4] have proposed the use of 4 biological and inflammatory markers (e.g. stage IV, high level of platelets, ferritin and eosinophils) to classify paediatric patients with HL into subgroups with different outcomes. Qi et al. [2], by using a SELDI-TOF mass spectrometry-based strategy, showed that the α-1-antitrypsin protein well discriminated different stages of HL in childhood. While, Kamper et al. [5], showed an association between the expression of the immune suppressive galectin-1 lectin and an adverse HL outcome.
The aim of this study was to search for prognostic markers of relapse in paediatric /adolescent HL patients treated with the LH2004 protocol [4] and with a median follow-up of 4.5 years using a comparative proteomic approach based on difference in gel electrophoresis (2D-DIGE).
Materials and Methods
Patients and plasma sample collection
A total of 29 paediatric/adolescent patients with HL were recruited from a multicenter clinical LH-2004 trial [4]. Plasma specimens of patients were collected at HL diagnosis. Pathological and guidelines criteria to assess the relapses were drafted and discussed by the AIEOP Organization [4].
Clinicopathological characteristics of the 'explorative' cohort of HL patients are reported in Table 1 and are detailed in Table S1. In this cohort, plasma were obtained from 9 males and 7 females with a mean age of 14 years (9 to 18 years). HL clinical stages were stage II (NR: 3; R: 4), III (NR: 1; R: 1), and IV (NR: 4; R: 3), while the HL histology mostly included nuclear sclerosis. Clinicopathological characteristics of the patients included in the 'validation' cohort, are reported in Table 1 and are detailed in Table S2. In this cohort, plasma were obtained from 9 males and 4 females with a mean age of 14 years (11 to 18 years). HL clinical stages were stage II (NR: 2; R: 3), III (NR: 3; R: 1), and IV (NR: 1; R: 3), while the HL histology mostly included nuclear sclerosis and mixed cellularity.
Clinicopathological characteristics of the 'explorative' cohort of patients affected by Hodgkin Lymphoma and showing either a favourable ('NR', not relapsing; nr=8) or an unfavourable ('R', relapsing; nr=8) response after treatment with the LH-2004 clinical trial [4].
| Characteristic | Classification | Explorative cohort | Validation cohort | |||
|---|---|---|---|---|---|---|
| NR(d) | R(d) | NR(d) | R(d) | |||
| Sex | ||||||
| Male | 4 | 5 | 2 | 7 | ||
| Female | 4 | 3 | 4 | 0 | ||
| Age (mean) | 14,1 | 13,6 | 14 | 14,4 | ||
| Histology(a) | ||||||
| Nodular sclerosis | 7 | 5 | 2 | 4 | ||
| Mixed cellularity | 0 | 1 | 2 | 2 | ||
| Not classified | 1 | 2 | 2 | 1 | ||
| Stage(b) | ||||||
| 4 | 4 | 3 | 1 | 3 | ||
| 3 | 1 | 1 | 3 | 1 | ||
| 2 | 3 | 4 | 2 | 3 | ||
| Symptoms(c) | ||||||
| A | 4 | 6 | 1 | 4 | ||
| B | 4 | 2 | 5 | 3 | ||
Pathological and guidelines criteria to assess the relapse were drafted and discussed by AIEOP Organization [4].
(a)histology according to [42]; (b)stage according to [43]; (c)A, absence of systemic symptoms; B, presence of systemic symptoms, according to [43]; (d)NR, absence of HL relapse within 3 years; R, relapsed HL within 3 years.
Design of the study
Based on the clinical follow-up, participants were randomly divided into 2 sets: (i) an 'explorative' set of 8 NR and 8 R patients, and (ii) a 'validation' set of 6 NR and 7 R. Detailed characteristics of patients are listed in Table 1 and Tables S1-S2. The main steps of the study were: (1) the characterization of the plasma proteomic profiles differentially associated with either NR or R patients in the explorative sample set, (2) the validation of selected differential spots in the independent validation sample set, (3) the identification of the proteins present in theses spots, and (4) the validation of selected proteins by immunoblotting.
Protein extractions
The subjects were divided into two groups: 'NR', patients without relapses (8 and 6 patients for the 'explorative' and 'validation' cohorts, respectively) and 'R', patients with relapses (8 and 7 patients for the 'explorative' and 'validation' cohorts, respectively). For each patient, 200 and 100 μl of plasma were analysed for the 'explorative' and 'validation' cohort of patients, respectively. After an initial enrichment of low abundant proteins through the saturation of the highly abundant ones with high affinity ligands of ProteoMiner Kit (BioRad Laboratories, Hercules, CA, USA), protein eluates were subjected to 2-D Clean-Up Kit (GE Healthcare, Uppsala, Sweden). Protein concentrations were measured with 2D Quant Kit (GE Healthcare).
Two dimensional difference in gel electrophoresis (2D-DIGE)
Protein extracts were separated by two dimensional electrophoresis (2DE) [6]. The entire 'difference in gel electrophoresis' (DIGE) project consisted of 15 analytical gels (8 and 7 for the 'explorative' and 'validation' cohorts, respectively), each gel containing two protein extracts (25 µg per extract) each labeled with Cy3 or Cy5 cyanine dyes (CyDye DIGE Fluor minimal dyes; GE Healthcare) with the internal standard (Cy2) representative of the all samples analysed. For both the 'explorative' and the 'validation' cohorts, protein extracts were first separated by isoelectrofocusing (IEF) on 11 cm pH gradient dry strips (IPG, GE Healthcare) with a nonlinear (NL) pH 3-10 gradient for 30 KVh in Protean® IEF Cells (BioRad), and secondly on 8-16 % Criterion TGX precast midi protein gels (Bio-Rad). Two additional gels were performed as technical replicates of four R and NR samples to assess the quality of protein labelling and subsequent DIGE steps.
Image analysis
After image gel acquisition (Amersham Typhoon; GE Healthcare), differential image analysis was performed with DeCyder software (version 6.5; GE Healthcare). Gel images were processed by the Differential In-gel Analysis module to co-detect and differentially quantify the protein spots in the images. The internal standard was used as a reference to normalize the data, so the rest of the normalized spot maps could be compared among them. While the Biological Variation Analysis module allowed to perform a gel-to-gel matching of spots across multiple gels, allowing quantitative comparison of protein expression. The Extended Data Analysis module was used for multivariate analysis of protein expression data, derived from the BVA module. The protein filter criteria adopted for the calculation of differential expression analysis between R and NR groups individuated a set of differential spots, and they were: (i) 1.5 as fold change for 'average ratio' (+1.5, up-regulation; -1.5, down-regulation); (ii) 70 as value for '% of spot maps where protein is present'; (iii) p<0.01 as 'Student's T-test value. Principal component analysis (PCA) and hierarchical cluster analysis were then performed on this set of proteins extracted from the differential expression analysis. In particular, PCA compared proteins versus spot maps to get an overview of the protein data and find possible relationships between the two groupings R versus NR. While the hierarchical cluster analysis clustered the proteins in the data set based on the protein expression from the spot maps, so that proteins with similar expression profiles clustered together. In the only 'explorative' cohort, in order to evidence a higher number of differential spots, another less stringent set of filter criteria was adopted accordingly to: (i) 1.5 as fold change for 'average ratio' (+1.5, up-regulation; -1.5, down-regulation); (ii) 50 as value for '% of spot maps where protein is present'; (iii) p<0.05 as 'Student's T-test value'. Differential spots were then analysed with PCA and clustering, as above described. These criteria were also adopted for the comparative analyses of the 'validation' cohort of HL patients because of the inferior amount of starting plasma samples.
Protein identification by mass spectrometry (MS)
Differential spots of interest were excised from a blue-stained preparative gel (300 µg of unlabelled proteins) with Screen Picker (Proteomics Consult, Kampenhout, Belgium). Excised spots were washed with NH4HCO3, dehydrated, trypsin digested and processed for LC-MS/MS analyses using a LTQ XL-Orbitrap ETD equipped with a HPLC NanoEasy-PROXEON (Thermo Fisher Scientific, Waltham, Massachusetts, USA). Database searches were done with the MASCOT search engine version 2.3 against the National Centre for Biotechnology Information non-redundant protein database (NCBInr) and SwissProt database selected for human taxonomy.
Immunoblotting
The differential abundance of some differentially expressed proteins of interest was validated by immunoblot analyses on 3 pools of proteins from either R or NR experimental group, each containing 3 samples. Ten µg of proteins were fractionated on 12% Criterion TGX Stain-Free gels and, after gel image acquisition with the Chemidoc system (BIO-RAD), electrotransferred onto nitrocellulose membranes. Membranes were incubated with the monoclonal antibodies anti-fibrinogen β chain [1F9] (1:500; GeneTex) and anti-fibrinogen α chain [EPR2918] (1/2000; Abcam). Antibody-bound proteins were detected by enhanced chemiluminescence using the Chemidoc system after incubation with ECL HRP-conjugated secondary antibodies (1:25000 dilution, GE Heathcare) and reaction with ECL Prime Western Blotting detection reagent (GE Healthcare). The image of the gel acquired before its transfer was used as control for equal protein loading among samples. Analyses were performed in triplicate and repeated three times with similar results.
Results
Figure 1 shows a characteristic proteome map of HL plasma, containing 300 µg of pooled proteins extracted from all the patients included in the study. In the 'explorative' cohort, a total of 20 spots resulted highly significantly differentially expressed (p<0.01), and, in particular, 9 spots were up-regulated and 11 spots were down-regulated in the NR experimental group compared with the R one (Figure 1; Table 2). Another set of additional 16 spots was found (0.01<p<0.05) as differential between R and NR patients (9 up-regulated and 7 down-regulated spots in NR versus R patients) (Figure S1, A, B). In the 'validation' cohort, where a lower plasma volume was analysed, a lower number of differentially expressed spots was found (2 'up-' and 7 'down-regulated' spots in R versus NR patients) (Table S3).
Representative two-dimensional proteome map of Hodgkin Lymphoma plasma samples of the 'explorative' cohort. Proteins were resolved on immobilized pH 3-10 gradient, followed by SDS-PAGE (8-16%). The numbers indicate the differentially expressed spots between 'relapsing' and 'not relapsing' patient groups in the 'explorative' cohort (70% of spot maps, Student's T-test p<0.01).

List of differentially expressed proteins of relapsing versus not-relapsing plasma collected from patients of the 'explorative' cohort affected by Hodgkin lymphoma.
| Spot nr. a) | MW(Da)/pI | Database | Accession | Protein annotation | Score | Matches | Seq.b) | Seq. cov. % c) | Fold △ | p-value | |
|---|---|---|---|---|---|---|---|---|---|---|---|
| (a) up-regulated spots (nr=9) in 'not relapsing, NR' patients | |||||||||||
| 273 | 44305/5.37 | NCBInr | 1::gi|196049621 | Chain A, Crystal Structure Of Alpha-1-Antitrypsin, Crystal Form A | 1397 | 252 | 30 | 50 | -6.79 | 4.29E-04 | |
| 272 | 44305/5.37 | NCBInr | 1::gi|196049621 | Chain A, Crystal Structure Of Alpha-1-Antitrypsin, Crystal Form A | 2011 | 337 | 29 | 49 | -6.14 | 2.68E-04 | |
| 266 | 45344/5.28 | NCBInr | 1::gi|71773110 | Apolipoprotein A-IV precursor | 873 | 65 | 35 | 62 | -5.83 | 1.77E-03 | |
| 44305/5.37 | NCBInr | 1::gi|196049621 | Chain A, Crystal Structure Of Alpha-1-Antitrypsin, Crystal Form A | 594 | 59 | 23 | 40 | ||||
| 264 | 44305/5.37 | NCBInr | 1::gi|196049621 | Chain A, Crystal Structure Of Alpha-1-Antitrypsin, Crystal Form A | 1416 | 152 | 28 | 54 | -4.85 | 2.07E-04 | |
| 267 | 103521/6.51 | SwissProt | 2::ITIH4_HUMAN | Inter-alpha-trypsin inhibitor heavy chain H4 OS=Homo sapiens GN=ITIH4 PE=1 SV=4 | 505 | 31 | 17 | 14 | -4.76 | 3.09E-04 | |
| 45371/5.28 | SwissProt | 2::APOA4_HUMAN | Apolipoprotein A-IV OS=Homo sapiens GN=APOA4 PE=1 SV=3 | 462 | 40 | 27 | 48 | ||||
| 255 | 44305/5.37 | NCBInr | 1::gi|196049621 | Chain A, Crystal Structure Of Alpha-1-Antitrypsin, Crystal Form A | 536 | 63 | 24 | 40 | -3.12 | 2.52E-03 | |
| 258 | 46823/5.54 | NCBInr | 1::gi|223170 | Fibrinogen gamma | 430 | 34 | 16 | 29 | -3.02 | 3.50E-03 | |
| 103521/6.51 | SwissProt | 2::ITIH4_HUMAN | Inter-alpha-trypsin inhibitor heavy chain | 358 | 20 | 15 | 14 | ||||
| 259 | 103521/6.51 | SwissProt | 2::ITIH4_HUMAN | Inter-alpha-trypsin inhibitor heavy chain H4 OS=Homo sapiens GN=ITIH4 PE=1 SV=4 | 486 | 34 | 18 | 15 | -2.94 | 6.71E-05 | |
| 53025/6.32 | SwissProt | 2::ANT3_HUMAN | Antithrombin-III OS=Homo sapiens GN=SERPINC1 PE=1 SV=1 | 375 | 30 | 19 | 27 | ||||
| 233 | 55069/5.55 | SwissProt | 2::VTNC_HUMAN | Vitronectin OS=Homo sapiens GN=VTN PE=1 SV=1 | 603 | 33 | 14 | 20 | -2.06 | 9.99E-03 | |
| (b) up-regulated spots (nr=11) in 'relapsing, R' patients | |||||||||||
| 230 | 95656/5.70 | SwissProt | 2::FIBA_HUMAN | Fibrinogen alpha chain OS=Homo sapiens GN=FGA PE=1 SV=2 | 5271 | 374 | 53 | 39 | 3.41 | 1.44E-05 | |
| 234 | 95656/5.70 | SwissProt | 2::FIBA_HUMAN | Fibrinogen alpha chain OS=Homo sapiens GN=FGA PE=1 SV=2 | 5862 | 403 | 51 | 37 | 2.5 | 1.09E-03 | |
| 196 | 95656/5.70 | SwissProt | 2::FIBA_HUMAN | Fibrinogen alpha chain OS=Homo sapiens GN=FGA PE=1 SV=2 | 3643 | 250 | 41 | 34 | 2.41 | 2.08E-04 | |
| 239 | 61305/7.31 | NCBInr | 1::gi|237823914 | Chain A, Crystal Structure Of Human Fibrinogen | 13094 | 731 | 43 | 55 | 2.23 | 2.84E-03 | |
| 300 | 52908/7.14 | NCBInr | 1::gi|237823915 | Chain B, Crystal Structure Of Human Fibrinogen | 14481 | 655 | 34 | 62 | 2.16 | 7.70E-03 | |
| 291 | 52908/7.14 | NCBInr | 1::gi|237823915 | Chain B, Crystal Structure Of Human Fibrinogen | 20618 | 826 | 40 | 80 | 2.08 | 1.89E-03 | |
| 296 | 52908/7.14 | NCBInr | 1::gi|237823915 | Chain B, Crystal Structure Of Human Fibrinogen | 15220 | 755 | 38 | 67 | 2.05 | 6.22E-03 | |
| 78 | 61305/7.31 | NCBInr | 1::gi|237823914 | Chain A, Crystal Structure Of Human Fibrinogen | 509 | 25 | 13 | 32 | 2.01 | 3.17E-03 | |
| 188569/6.02 | SwissProt | 2::CO3_HUMAN | Complement C3 OS=Homo sapiens GN=C3 PE=1 SV=2 | 402 | 38 | 22 | 11 | ||||
| 77 | 188569/6.02 | SwissProt | 2::CO3_HUMAN | Complement C3 OS=Homo sapiens GN=C3 PE=1 SV=2 | 537 | 33 | 29 | 12 | 1.90 | 3.41E-04 | |
| 46823/5.54 | NCBInr | 1::gi|223170 | Fibrinogen gamma | 534 | 52 | 19 | 33 | ||||
| 98 | 52908/7.14 | NCBInr | 1::gi|237823915 | Chain B, Crystal Structure Of Human Fibrinogen | 2461 | 164 | 28 | 51 | 1.82 | 6.01E-03 | |
| 67 | 122983/5.44 | SwissProt | 2::CERU_HUMAN | Ceruloplasmin OS=Homo sapiens GN=CP PE=1 SV=1 | 785 | 29 | 21 | 18 | 1.58 | 4.19E-03 | |
a)spot nr., spot numbers refer to Figure 1; b)Seq., sequences; c)Seq. cov. %, percentage of sequence coverage.
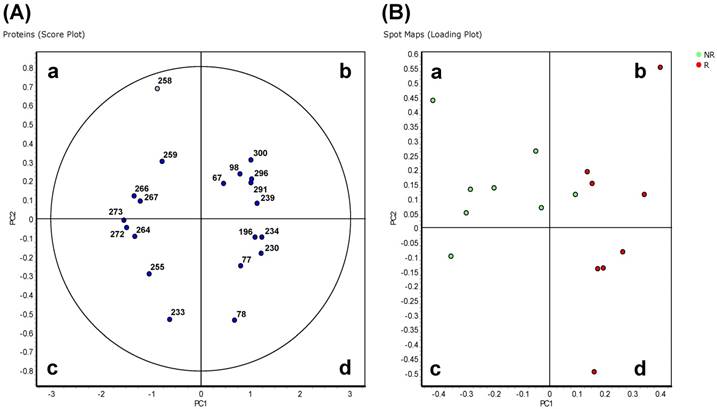
In the 'explorative' cohort, the PCA analysis on Proteins (Score Plot) showed that the 20 spots highly differentially varying at p<0.01 entered the 95% significance level graphically visualized by the ellipse (Figure 2A). The R and NR patients were distinct and separated from each other (Spots Maps, Loading Plot analyses; Figure 2B). Proteins in quadrants 'b' and 'd' in Figure 2A were found to be up-regulated in spot maps in quadrants 'b' and 'd' in Figure 2B, and down-regulated in the spot maps in quadrants 'a' and 'c' in Figure 2B. Proteome maps with the same samples located close to each other after PCA analysis (data not shown). A good separation between R and NR patients was also found in the 'validation' cohort (Figure S2).
Principal component analysis of Hodgkin Lymphoma plasma samples of the 'explorative' cohort. Depending on the setting of the performed calculation, differential protein spots (p<0.01) and spot maps are shown in the score plot (A) and spot maps (B). In (A) each circle represents a differential spot. In (B) each circle represents a spot map corresponding to a single patient.
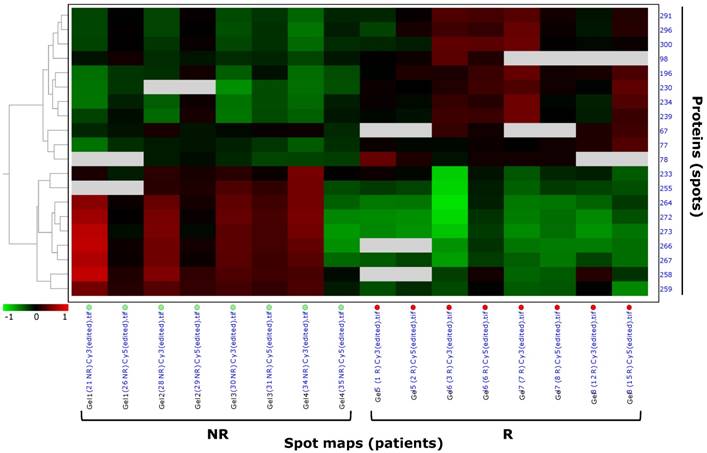
In the 'explorative' cohort, pattern analysis by hierarchical clustering clustered the 20 highly differentially expressed spots (p<0.01) of the filtered data set based on the protein expression from the spot maps, and confirmed the different spot profiles between NR and R patients (Figure 3). Spots with similar expression profiles over the maps (i.e. 'up-' or 'down-regulated' spots) were clustered together. Data were ordered by a dendogram so that similar data were displayed next to each other. Spots maps with similar overall protein expression were grouped together, so that the two experimental groups (R, relapsing; NR, not relapsing), having different spot profiles, were visually separated from each other. Hierarchical pattern analysis based on the 26 differential spots at p<0.05 separated the NR and R patient groups to a lesser extent then what observed with the only 20 differential spots at p<0.01 (Figure S1, C). Therefore, further analyses focussed on the most stringent set of the 20 highly differentially expressed spots at p<0.01.
Pattern analysis by hierarchical clustering of Hodgkin Lymphoma plasma samples of the 'explorative' cohort. Hierarchical clustering performed as 'Proteins - Spot maps' clustered the 20 proteins of the selected data set based on their expression from the spot maps (as explained in §'Materials and methods'). Proteins with similar expression profiles (i.e. similar expression over the spot maps) were clustered together. The dendogram on the left ordered the data so that similar data were displayed next to each other. Proteins with similar expression profiles were grouped together and spot maps/experimental groups (R, relapsing; NR, not relapsing) with similar overall protein expression were grouped together.
Proteins from all these 20 differentially expressed spots were identified by mass spectrometry as 10 distinct proteins since a same protein(s) (i.e. α-1-antitrypsin, inter-α-trypsin inhibitor heavy chain, complement C3, fibrinogen α and β chains) was found to be present in more than one spot (Table 2). Five proteins were 'up-regulated' in NR versus R patients: chain a, crystal structure of α-1-antitrypsin, crystal form A; apolipoprotein A-IV precursor; inter-α-trypsin inhibitor heavy chain; antithrombin-III; vitronectin; and 4 were 'down-regulated': fibrinogen α chain; fibrinogen β chain; complement C3; ceruloplasmin. Several spots (e.i. spots 266, 267, 258, 259) contained more than one protein. The decrease in content of fibrinogen β and α chains (spots 403 and 244, respectively), and the increase of α-1-antitrypsin (spot 435) in NR patients compared with R were also confirmed by 2D-DIGE analysis using the 'validation' cohort of patients (Table S3).
By 2D-DIGE analysis performed on samples of the 'explorative' cohort, we individuated two spots (312 and 314, Figure S2) as 'up-regulated' (average ratio: 1.68spot 312 and 1.60 spot 314 ; Student's T-test p-value: 0.035spot 312 and 0.050spot 314) in R versus NR patients (70% of spot maps, Student's T-test p<0.05), which were identified as fibrinogen γ chain (Mascot score: 6852spot 312 and 10017spot 314; coverage %: 45spot 312 and 72spot 314), but that were not confirmed as differentially expressed in the second series of 'validation' cohort of patients, where on the contrary spots identified as fibrinogen γ chain increased in content in NR patients. So, we excluded fibrinogen γ chain as a potential prognostic factor from our work.
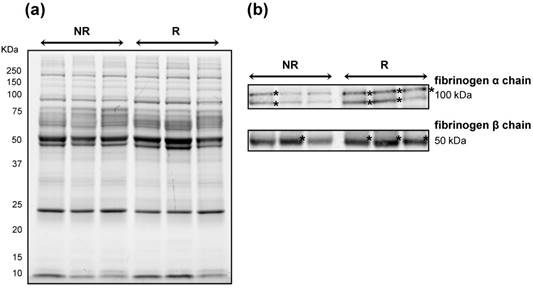
To further corroborate the increase in content of fibrinogen β and α chains in NR patients, we performed immunoblotting using a same quantity of the same pooled protein extracts used for 2D-DIGE analysis (Figure 4A). A lower content of fibrinogen α and β chains as bands of ~100 and 50 kDa, respectively, was confirmed in NR samples than in R ones (Figure 4B).
Immunoblotting validation of fibrinogen β and α chain expression in Hodgkin Lymphoma plasma samples. Three pools of proteins belonging to the 'not relapsing' group (NR) were compared with those belonging to the relapsing (R) groups. (A) Image of the 1DE gel acquired with Chemidoc before its transfer to nitrocellulose membrane. (B) Signals of proteins cross-reacting with antibodies directed against fibrinogen β- and α-chains. Asterisk indicates the most intense signals of cross-reacting bands at around 100 and 50 kDa for the fibrinogen α and β chains, respectively.
Discussion
In paediatric HL, a great interest relies on markers for the prediction of relapse and/or progression for both an optimization of the therapeutic approaches and the improvement of the understanding of HL pathology.
In this study, from AIEOP LH-2004 multicenter protocol, we explored by comparative proteomics the plasma samples of patients relapsed and not-relapsed during the follow-up (median follow-up 4.5 years) to identify at diagnosis putative predictive biomarkers of relapse in paediatric/adolescent HL.
As technology to decrease the highly abundant plasma proteins we adopted ProteoMiner since it has been reported to significantly increase the sensitivity of DIGE-based proteomics analyses [7-8].
In our 'explorative' cohort of plasma from HL patients (equally represented by stages II and IV), 10 proteins were identified that were associated most significantly with HL relapse and/or progression. Most proteins occurred in several spots found as differentially expressed among NR and R patients, thus suggesting that these proteins were present in multiple isoforms, including post-translational and proteolytic modifications.
An increase in content of α-1-antitrypsin (spots 255, 264, 266, 272, 273), apolipoprotein A-IV (266, 267), an heavy chain of an inter-α-trypsin inhibitor (spots 258, 259, 267), antithrombin-II (spot 259) and vitronectin (spot 233) was associated with NR in the 'explorative' cohort of paediatric/adolescent HL patients. Among these proteins, the increase in α-1-antitrypsin (AAT), also validated in the second cohort of HL patients, was previously found to correlate with disease severity in serum samples of 22 paediatric HL discriminating between high grade (III/IV) and low grade (II) HL stages [2]. The α-1-antitrypsin (AAT) is a highly polymorphic glycoprotein (53 kD), also called SERine Proteinase INhibitor A1 (SERPINA1), it is synthesized in hepatocytes and subsequently secreted into the plasma. It is also produced in smaller quantities by alveolar macrophages, circulating monocytes and lung-derived epithelial cells [9]. Elastase is its primary target, but a moderate affinity being also described for thrombin and plasmin, both of which are known to play a key role in haemostasis as well as in inflammatory pathways, besides cancerogenesis [10]. Of note, in NR an increase in an antithrombin-II (spot 259), a plasma cofactor that inactivates several coagulation factors, was also observed. The most noticeable activity of AAT is to limit inflammatory tissue damage, but accumulating evidences suggested new roles in tissue-protection such as in the improvement of mitochondrial membrane stability, inhibition of proinflammatory cytokine production, promotion of anti-tumor agents [11-12]. Untreated individuals with genetic AAT deficiency are associated with elevated rates of liver malignancies [13], lung [14] and gastrointestinal [15] cancers, suggesting a protective role of AAT to cancer [16]. An hypothesis reported by Nagpal et al. [17] in HL was that the neutrophil elastase inhibitory function of AAT by decreasing tissue damage could result in a decrease in tumorigenesis, invasion, and metastasis [17]. However at today it remains arguable to propose an association between the low AAT concentration found at diagnosis and the relapse of HL patients, and further studies are necessary to sustain a functional role of AAT in HL response.
In R patients, we also found an increase in content of fibrinogen α (spots 78, 196, 230, 234, 239) and β (spots 98, 291, 296, 300) chains, complement C3 (spots 77, 78) and ceruloplasmin (spot 67). Among these proteins, the increase in fibrinogen α- and β- chains was further validated by immunoblotting, and it was also found over-expressed in the 'validation' cohort of HL patients.
Fibrinogen is a 340 kDa plasma glycoprotein composed of three non identical disulfide cross-linked polypeptide chains (α, β, and γ) synthesized primarily by hepatocytes under the control of three distinct genes [18-19]. Fibrinogen levels rise in any inflammatory and tissue damage conditions [20], as in metastasis and tumor progression [21]. In malignancies, in general, the presence of fibrin(ogen) has been proposed to affect tumor cell development and metastasis by binding tumor growth factor, potentiating endothelial cell proliferation and platelet adhesion to circulating tumor cells and, thus, facilitating metastatic spread [18, 22, 23]. Since 1961, hyperfibrinogenemia has been found associated with rapidly growing tumors, carcinomas, sarcomas, and HL [24]. Brugarolas et al. [24] and different studies indicate fibrinogen concentration as a useful prognostic factor in several solid cancers (e.g. thyroid, colorectal, ovarian, gastric cancers, and others) [25-29]. Additionally to a role in cancer development and prognosis, fibrinogen is also reported as a coagulation factor playing a key role in clot formation and wound healing. Thus, elevated plasma fibrinogen levels in lymphoproliferative disorders may reflect a thrombophilic state that arises from the capacity of tumour cells to release coagulant molecules [10, 30-34]. In conclusion, the exact role of fibrinogen in HL remains elusive and poorly investigated, and it requires additional experimental and functional studies. Interestingly, at diagnosis in a large population of 769 children affected by HL, Ferruggia et al. [4] demonstrated that higher level of platelets was associated with a worse outcome. Another marker associated with a coagulatory/ inflammatory environment that we found up-regulated in R patients was galectin-1. In accordance with our results, Kamper and coll. found that galectin-1 was up-regulated before the treatment with an expression that was found related with the relapse and survival of patients with HL [35]. Thus, overall, our results reinforce the worse prognostic value of high fibrinogen level in paediatric HL. Furthermore, our study like others highlighted that single fibrinogen subunits are more informative than the entire proteins to distinguish patients with cancer (e.g. fibrinogen β chain for gastric and bladder cancers [36-37]; fibrinogen α and γ chains for central nervous system lymphomas [38] as well as response to treatment (e.g. fragment D of fibrinogen β chain in rectal cancer patients receiving neoadjuvant chemo-radiotherapy [39]). Indeed, in our series we specifically observed an increase in fibrinogen α and β chains, rather than the entire fibrinogen, in patients with relapsed HL.
Moreover, we also found an higher level of ceruloplasmin (spot 67) as associated with R compared with NR patients. Ceruloplasmin is a serum glycoprotein composed of 1046 aminoacids (MW 135 kDa) with a ferroxidase activity oxidizing Fe2+ to Fe3+ without releasing radical oxygen species. Ceruloplasmin is also involved in iron transport across the cell membrane, and, in particular, it has been demonstrated to influence intestinal absorption of Fe(II)[40]. An increase of ceruloplasmin in HL have been previously documented and its expression highly correlated with the stage of the clinical disease and hypercupremia of the patient [41]. Iron homeostasis can be affected in HL development: ferritin was found to be elevated at diagnosis in HL-affected children and it was proposed as an independent prognostic factor together with stage, absolute eosinophil count and platelet count [4].
Globally, our plasma differential proteins associated with paediatric/adolescent HL disease relapse represented abundant proteins playing roles in inflammation and haemostasis, thus low abundant proteins being under-represented. In order to better define biomarker signatures in paediatric/adolescent HL, further studies will be performed including a prospective cohort of patients.
Conclusion
In conclusion, by using patient's plasma at diagnosis, our study highlighted an association between high level of fibrinogen α- and β- chains and ceruloplasmin and low level of α-1-antitrypsin with the increased risk for paediatric/adolescent HL-relapse. The hypothesized functional role(s) of these proteins in relapsed HL deserves further investigations.
Supplementary Material
Supplementary figures and tables.
Acknowledgements
The authors the patients and the families for their participation, BCC Foundation of Pordenone and 5x mille CRO intramural for providing the financing for this project. The authors also thank Italian Association of Pediatric Hematology and Oncology and Hodgkin; Paola Muggeo (Department of Paediatric Hemato-Oncology, University of Bari, Bari, Italy), Marta Pillon (Clinic of Paediatric Hemato-Oncology, Department of Women's and Children's Health, University of Padova, Padova, Italy), Elena Facchini (Clinic of Pediatric Hematology Oncology, Policlinico S. Orsola-Malpighi, Bologna, Italy); Luciana Vinti (Department of Paediatric Hemato-Oncology, IRCCS Ospedale Bambino Gesù, Roma, Italy), Caterina Consarino (Pediatric Hemato-oncology Unit, Dipartimento di Onco-Ematologia, Catanzaro Hospital, Catanzaro, Italy), Alberto Garaventa (Department of Paediatric Haemato-Oncology, IRCCS I. G. Gaslini, Genova, Italy), and Patrizia Bertolini (Pediatric Hematology Oncology, Azienda Ospedaliera Universitaria di Parma, Parma, Italy).
Competing Interests
The authors have declared that no competing interest exists.
References
1. Castellino SM, Geiger AM, Mertens AC. et al. Morbidity and mortality in long-term survivors of Hodgkin lymphoma: a report from the Childhood Cancer Survivor Study. Blood. 2011;117:1806-16
2. Qi L, Cazares L, Johnson C. et al. Serum protein expression profiling in pediatric Hodgkin lymphoma: a report from the Children's Oncology Group. Pediatr Blood Cancer. 2008;51:216-21
3. Kelly KM. Hodgkin lymphoma in children and adolescents: improving the therapeutic index. Blood. 2015;126:2452-8
4. Farruggia P, Puccio G, Sala A. et al. The prognostic value of biological markers in paediatric Hodgkin lymphoma. Eur J Cancer Oxf Engl. 2016;52:33-40
5. Kamper P, Ludvigsen M, Bendix K. et al. Proteomic analysis identifies galectin-1 as a predictive biomarker for relapsed/refractory disease in classical Hodgkin lymphoma. Blood. 2011;117:6638-49
6. Repetto O, Zanussi S, Casarotto M. et al. Differential proteomics of Helicobacter pylori associated with autoimmune atrophic gastritis. Mol Med. 2013;20:57-71
7. Murphy S, Dowling P. DIGE Analysis of ProteoMinerTM Fractionated Serum/Plasma Samples. Methods Mol Biol. 2018;1664:109-14
8. Li L. Dynamic range compression with ProteoMiner™: principles and examples. Methods Mol Biol. 2015;1295:99-107
9. Topic A, Juranic Z, Jelic S. et al. Polymorphism of alpha-1-antitrypsin in hematological malignancies. Genet Mol Biol. 2009;32:716-9
10. Repetto O, De Re V. Coagulation and fibrinolysis in gastric cancer. Ann N Y Acad Sci. 2017;1404:27-48
11. Berger M, Liu M, Uknis ME. et al. Alpha-1-antitrypsin in cell and organ transplantation. Am J Transplant. 2018;18:1589-95
12. Guttman O, Freixo-Lima GS, Kaner Z. et al. Context-specific and immune cell-dependent antitumor activities of α1-antitrypsin. Front Immunol. 2016;7:559
13. Eriksson S, Carlson J, Velez R. Risk of cirrhosis and primary liver cancer in alpha 1-antitrypsin deficiency. N Engl J Med. 1986;314:736-39
14. Yang P, Sun Z, Krowka MJ. et al. Alpha1-antitrypsin deficiency carriers, tobacco smoke, chronic obstructive pulmonary disease, and lung cancer risk. Arch Intern Med. 2008;168:1097-103
15. Yang P, Cunningham JM, Halling KC. et al. Higher risk of mismatch repair-deficient colorectal cancer in alpha(1)-antitrypsin deficiency carriers and cigarette smokers. Mol Genet Metab. 2000;71:639-645
16. Sun Z, Yang P. Role of imbalance between neutrophil elastase and alpha 1-antitrypsin in cancer development and progression. Lancet Oncol. 2004;5:182-90
17. Nagpal P, Akl MR, Ayoub NM. et al. Paediatric Hodgkin lymphoma: biomarkers, drugs, and clinical trials for translational science and medicine. Oncotarget. 2016;7:67551-73
18. Mosesson MW. Fibrinogen and fibrin structure and functions. J Thromb Haemost. 2005;3:1894-1904
19. Lisman T, Weeterings C, de Groot PG. Platelet aggregation: involvement of thrombin and fibrin(ogen). Front Biosci J Virtual Libr. 2005;10:2504-17
20. Davalos D, Akassoglou K. Fibrinogen as a key regulator of inflammation in disease. Semin Immunopathol. 2012;34:43-62
21. Kołodziejczyk J, Ponczek MB. The role of fibrinogen, fibrin and fibrin(ogen) degradation products (FDPs) in tumor progression. Contemp Oncol Pozn Pol. 2013;17:113-9
22. Simpson-Haidaris PJ, Rybarczyk B. Tumors and fibrinogen. The role of fibrinogen as an extracellular matrix protein. Ann N Y Acad. Sci. 2001;936:406-25
23. Palumbo JS, Kombrinck KW, Drew AF. et al. Fibrinogen is an important determinant of the metastatic potential of circulating tumor cells. Blood. 2000;96:3302-09
24. Brugarolas A, Elias EG. Incidence of hyperfibrinogenemia in 1961 patients with cancer. J Surg Oncol. 1973;5:359-64
25. Perisanidis C, Psyrri A, Cohen EE. et al. Prognostic role of pretreatment plasma fibrinogen in patients with solid tumors: A systematic review and meta-analysis. Cancer Treat Rev. 2015;41:960-70
26. Jianyong L, Zhihui L, Rixiang G, Jingqiang Z. Using a nomogram based on preoperative serum fibrinogen levels to predict recurrence of papillary thyroid carcinoma. BMC Cancer. 2018;18:390
27. Lee S, Huh SJ, Oh SY. et al. Clinical significance of coagulation factors in operable colorectal cancer. Oncol Lett. 2017;13:4669-74
28. Luo Y, Kim HS, Kim M. et al. Elevated plasma fibrinogen levels and prognosis of epithelial ovarian cancer: a cohort study and meta-analysis. J Gynecol Oncol. 2017;28:e36
29. Yu X, Hu F, Yao Q. et al. Serum fibrinogen levels are positively correlated with advanced tumor stage and poor survival in patients with gastric cancer undergoing gastrectomy: a large cohort retrospective study. BMC Cancer. 2016;16:480
30. Samuelson Bannow BT, Konkle BA. 2018. Laboratory biomarkers for venous thromboembolism risk in patients with hematologic malignancies: A review. Thromb Res. 2018;163:138-45
31. Troppan KT, Melchardt T, Wenzl K. et al. The clinical significance of fibrinogen plasma levels in patients with diffuse large B cell lymphoma. J Clin Pathol. 2016;69:326-30
32. Schönning A, Karlén J, Frisk T. et al. Venous thrombosis in children and adolescents with Hodgkin lymphoma in Sweden. Thromb Res. 2017;152:64-8
33. Kakkar AK, Levine M, Pinedo HM. et al. Venous thrombosis in cancer patients: insights from the FRONTLINE survey. Oncologist. 2003;8:381-8
34. Muslimani AA, Spiro TP, Chaudhry AA. et al. Venous thromboembolism in lymphoma: how effectively are we treating patients? Am J Clin Oncol. 2009;32:521-3
35. Kamper P, Ludvigsen M, Bendix K. et al. 2011. Proteomic analysis identifies galectin-1 as a predictive biomarker for relapsed/refractory disease in classical Hodgkin lymphoma. Blood. 2011;117:6638-49
36. Repetto O, Maiero S, Magris R. et al. Quantitative proteomic approach targeted to fibrinogen β chain in tissue gastric carcinoma. Int J Mol Sci. 2018:19
37. Lindén M, Segersten U, Runeson M. et al. Tumour expression of bladder cancer-associated urinary proteins. BJU Int. 2013;112:407-15
38. Roy S, Josephson SA, Fridlyand J. et al. Protein biomarker identification in the CSF of patients with CNS lymphoma. J Clin Oncol. 2008;26:96-105
39. Repetto O, De Re V, De Paoli A. et al. Identification of protein clusters predictive of tumor response in rectal cancer patients receiving neoadjuvant chemo-radiotherapy. Oncotarget. 2017;8:28328-41
40. Zerounian NR, Linder MC. Effects of copper and ceruloplasmin on iron transport in the Caco 2 cell intestinal model. J Nutr Biochem. 2002;13:138-48
41. Casamassima A, Addabbo L, Caporusso L. et al. Serum levels of ceruloplasmin, properdin factor B and copper in lymphoma patients. Int J Biol Markers. 1991;6:183-7
42. Campo E, Swerdlow SH, Harris NL. et al. The 2008 WHO classification of lymphoid neoplasms and beyond: evolving concepts and practical applications. Blood. 2011;117:5019-32
43. Carbone PP, Kaplan HS, Musshoff K. et al. Report of the Committee on Hodgkin's disease staging classification. Cancer Res. 1971;31:1860-1
Author contact
![]() Corresponding author: vdereit; Tel.: +39-0434-659672
Corresponding author: vdereit; Tel.: +39-0434-659672