Impact Factor ISSN: 1837-9664

 Global reach, higher impact
J Cancer 2019; 10(2):397-407. doi:10.7150/jca.28127 This issue Cite
Research Paper
High Expression Levels of AGGF1 and MFAP4 Predict Primary Platinum-Based Chemoresistance and are Associated with Adverse Prognosis in Patients with Serous Ovarian Cancer
Haiyue Zhao1, Qian Sun2, Lisong Li3, Jinhua Zhou3, Cong Zhang2, Ting Hu2, Xuemei Zhou4, Long Zhang2, Baiyu Wang5, Bo Li6, Tao Zhu2 ![]() , Hong Li1
, Hong Li1 ![]()
1. Center of Reproduction and Genetics, The Affiliated Suzhou Hospital of Nanjing Medical University, Suzhou Municipal Hospital, Suzhou, 215002, China
2. Cancer Biology Research Center (Key laboratory of the ministry of education), Tongji Hospital, Tongji Medical College, Huazhong University of Science and Technology, Wuhan 430030, China.
3. Department of Orthopedic Surgery, The First Affiliated Hospital of Soochow University, Suzhou 215006, China.
4. Department of Obstetrics and Gynecology, Xiaogan First Hospital, Xiaogan 432000, China.
5. Department of Obstetrics and Gynecology, Yangxin County People's Hospital, Huangshi, 435200, China.
6. Department of Obstetrics and Gynecology, Suizhou Central Hospital, Suizhou 441300, China.
Received 2018-6-26; Accepted 2018-10-27; Published 2019-1-1
Abstract
Primary platinum-based chemoresistance occurs in approximately one-third of patients with serous ovarian cancer (SOC); however, traditional clinical indicators are poor predictors of chemoresistance. So we aimed to identify novel genes as predictors of primary platinum-based chemoresistance. Gene expression microarray analyses were performed to identify the genes related to primary platinum resistance in SOC on two discovery datasets (GSE51373, GSE63885) and one validation dataset (TCGA). Univariate and multivariate analyses with logistic regression were performed to evaluate the predictive values of the genes for platinum resistance. Machine learning algorithms (linear kernel support vector machine and artificial neural network) were applied to build prediction models. Univariate and multivariate analyses with Cox proportional hazards regression and log-rank tests were used to assess the effects of these gene signatures for platinum resistance on prognosis in two independent datasets (GSE9891, GSE32062). AGGF1 and MFAP4 were found highly expressed in patients with platinum-resistant SOC and independently predicted platinum resistance. Platinum resistance prediction models based on these targets had robust predictive power (highest AUC: 0.8056, 95% CI: 0.6338-0.9773; lowest AUC: 0.7245, 95% CI: 0.6052-0.8438). An AGGF1- and MFAP4-centered protein interaction network was built, and hypothetical regulatory pathways were identified. Enrichment analysis indicated that aberrations of extracellular matrix may play important roles in platinum resistance in SOC. High AGGF1 and MFAP4 expression levels were also related to shorter recurrence-free and overall survival in patients with SOC after adjustment for other clinical variables. Therefore, AGGF1 and MFAP4 are potential predictive biomarkers for response to platinum-based chemotherapy and survival outcomes in SOC.
Keywords: AGGF1, MFAP4, serous ovarian cancer, platinum resistance
Introduction
Ovarian cancer (OC) has the highest mortality among all gynecologic malignancies in the United States of America, with approximately 22,440 new cases and 14,080 deaths in 2017 [1] . Due to the insidious onset of the disease and the lack of effective screening methods, more than 70% of patients are diagnosed at an advanced stage and have extensive abdominal metastases upon diagnosis [2]. Although some new and promising chemotherapeutic agents have been developed in recent years, cytoreductive surgery followed by platinum-based chemotherapy remains the standard therapy for the treatment of patients with OC [3]. Despite major research efforts, the prognosis of OC is still unsatisfactory, and the 5-year survival rate remains around 30% [4].
Although a high rate of remission is achieved following first-line therapy, approximately 20-30% of patients with OC exhibit intrinsic resistance to platinum-based chemotherapy within 6 months after their standard treatment [5]. These patients only showed short-lived benefits from chemotherapy, highlighting the greatest challenge in the treatment of OC. If chemotherapy resistance in certain patients can be reliably recognized in advance, individualized treatment principles, which may have additional benefits, can be implemented. However, classic clinical indicators have poor predictive power for platinum resistance. There is a general consensus that OC is a histologically, clinically, and molecularly heterogeneous disease [6]. Serous OC (SOC) is the most common and aggressive histological type of OC, accounting for more than 70% of OC cases [7]. Previous studies have reported some biomarkers associated with response to platinum-based chemotherapy in patients with OC [8-13]. However, no molecular signatures for prediction of response to platinum-based chemotherapy in SOC have been implemented in clinical practice. Therefore, in this study, we aimed to identify novel genes as predictors of primary platinum-based chemoresistance in SOC.
Materials and Methods
Preparation of SOC datasets
In order to excavate gene signatures for predicting primary platinum resistance in patients with SOC, we searched the National Center for Biotechnology Information Gene Expression Omnibus database (GEO; https://www.ncbi.nlm.nih.gov/geo/) for OC expression microarray datasets. After an initial quality check, two datasets were enrolled in our study: GSE63885 [14] and GSE51373 [15], and the OC microarray dataset [16] from The Cancer Genome Atlas database (TCGA; http:// cancergenome.nih.gov/) was also included. Subsequently, individuals in these three datasets who were not fulfilling the following criteria were removed in our study: (1) patients belong to serous histological type; (2) patients treated with platinum-based chemotherapy; and (3) patients with clinically well-defined response to chemotherapies. The detailed clinical features of patients in these three datasets are listed in Table 1.
General information of involved 3 datasets for developing gene signatures of predicting platinum resistance.
| Characteristic | GSE63885 | GSE51373 | TCGA |
|---|---|---|---|
| Platform | HG-U133_Plus_2 | HG-U133_Plus_2 | HT_HG-U133A |
| Total sample number | 101 | 28 | 578 |
| Enrolled samples* | 70 | 28 | 454 |
| Age | |||
| median (range) | / | 54 (47 - 79) | 58 (26 - 89) |
| Chemotherapeutic response | |||
| sensitive | 38 | 18 | 318 |
| resistance | 32 | 10 | 136 |
| Tumor grade | |||
| 1/2/3/4/unknown | 0/9/46/15/0 | high grade | 5/55/383/1/10 |
| Tumor stage | |||
| I/II/III/IV/unknown | 0/2/59/9/0 | 0/5/19/3/1 | 13/21/350/68/2 |
| Debulking | |||
| optimal | 14 | / | 301 |
| suboptimal | 56 | / | 111 |
| unknown | 0 | / | 42 |
* samples are screened according to the criteria mentioned in the method section: serous histologic subtype and chemotherapeutic response information available. The following clinical features are summarized for screened samples.
/: The dataset lacks information on this clinical feature.
Additionally, validation of the prognostic significance of genes associated with primary platinum resistance was performed on independent external datasets. For this purpose, we employed two other OC microarray datasets with survival information from the GEO database (GSE32062 [17] and GSE9891 [18]). We filtered out cases that did not belong to serous histological type and without information on recurrence-free survival (RFS) and overall survival (OS) in these two datasets. The detailed clinical characteristics of the patients in these two datasets for survival analysis are summarized in Table S1.
Acquisition and processing of all expression profiles
The raw data (.CEL files) of four datasets (GSE63885, GSE51373, GSE9891, and GSE32062) were downloaded from the GEO database, uniformly processed, and normalized using the Robust Multichip Average algorithm [19] by Bioconductor package 'affy'. The standardized gene expression profile data and corresponding clinical information of SOC patients in TCGA were extracted from the Bioconductor package 'curatedOvarianData' [20]. We corrected the batch effects with the ComBat method [21].
Screening and validation of platinum resistance-related genes
GSE63885 and GSE51373 were defined as the discovery sets to explore gene signatures with high efficiency to distinguish platinum-resistant and platinum-sensitive patients, and TCGA SOC dataset (hereinafter inferred as TCGA) was analyzed as the validation dataset. The gene expression profiles for the platinum-resistant group and platinum-sensitive group in two discovery datasets were compared, and the differentially expressed genes (DEGs) were identified using two-tailed t-tests. Genes with p values of less than or equal to 0.05 were considered as statistically significant. The intersected genes of two lists of DEGs identified from two discovery datasets were subsequently tested in TCGA using two-tailed t-tests. After verification, AGGF1 and MFAP4 were defined as primary platinum resistance-associated genes and were used in further analyses.
We then set the AGGF1 and MFAP4 mRNA expression cutoff values in TCGA to define binary expression status according to the MinPvalue criterion from the R package 'OptimalCutpoints' [22], and the established cutoff values were then applied to all samples in three datasets (GSE63885, GSE51373, TCGA), finally, AGGF1 and MFAP4 mRNA expression statuses were categorized as “low(-)” and “high(+)”. Univariate and multivariate analyses with logistic regression (wald's test) were conducted to evaluate the predictive values of these two genes and other clinical characteristics for primary platinum resistance in each dataset. Using chi-square tests, we also explored the correlations of AGGF1 and MFAP4 mRNA expression status with other clinical characteristics in three SOC datasets (GSE63885, GSE51373, TCGA).
Possible mechanisms related to AGGF1 and MFAP4 mRNA expression values
We extracted copy number variation (CNV) and methylation data from cBioportal [23], and patients without corresponding AGGF1 and MFAP4 CNV or methylation data available were excluded from analysis in this section. We calculated differences in the expression levels of AGGF1 and MFAP4 mRNAs among different CNV levels from a null distribution which was constructed by asymptotic K-sample permutation tests. Furthermore, using Fisher's exact test, we estimated the CNV distribution differences in AGGF1 and MFAP4 between platinum-resistant and platinum-sensitive patients. Linear regression analyses of AGGF1 and MFAP4 mRNA expression values with their respective methylation values were also conducted. Subsequently, using two-tailed t-tests, AGGF1 and MFAP4 methylation values were compared between platinum-resistant and platinum-sensitive patients.
Construction and validation of platinum resistance prediction models
Through R package 'caret' [24], we built prediction models for primary platinum resistance based on the combination of AGGF1 and MFAP4 mRNA expression values by applying two popular machine learning algorithms involving linear kernel support vector machine (svmLinear) and artificial neural network (nnet). Training prediction models were constructed through five-repeats of ten-fold cross validations combined with internal parameter debugging in TCGA, and the best model for each machine learning algorithm was then selected. Subsequently, the best models were enrolled for further verification in GSE63885 and GSE51373. The receiver operating characteristic curve (ROC) was plotted using the 'pROC' package of R [25]. The area under the ROC curve (AUC) was used to measure the prediction performances of these models.
AGGF1 and MFAP4 protein-centered interaction network
To explore the potential regulation modes of AGGF1 and MFAP4 genes, with k nearest neighbors (k = 1), we constructed the minimal undirected protein interaction network that connected AGGF1 and MFAP4 proteins derived from the STRING database (combined score ≥ 600) [26]. We investigated the functional modules in this network by adopting a fast greedy searching community detection algorithm. Subsequently, using hypergeometric tests with Kyoto Encyclopedia of Genes and Genomes (KEGG) pathways, REACTOME, and Gene Ontology (GO) databases, functional enrichment analysis was performed for this network. Using the whole human genome as a background, GO, REACTOME, and KEGG terms with adjusted p values of less than or equal to 0.05 were considered as significantly enriched.
Survival analysis of AGGF1 and MFAP4
According to the established cutoffs mentioned above, AGGF1 and MFAP4 expression statuses were also classified into low- and high-expression groups in two independent datasets (GSE9891, GSE32062). Using R package 'survminer' [27], Kaplan-Meier plots were applied to establish survival curves for RFS and OS in univariate gene expression data and multiple genes combined expression data. Using chi-square tests, we also explored the associations of AGGF1 and MFAP4 mRNA expression statuses with various clinical characteristics available in these two datasets. Univariate analysis with Cox proportional hazards regression model was used to evaluate the correlations of AGGF1 and MFAP4 expression statuses with RFS and OS, and multivariate analysis with Cox proportional hazards regression model was applied to test the independent predictive ability of these two gene signatures for RFS and OS after adjusting for various clinical characteristics.
In this study, all statistical analyses and data mining procedures were performed with R software (version: 3.3.1) and Bioconductor (version: 3.6) [28].
Results
High expression levels of AGGF1 and MFAP4 mRNA were correlated with primary platinum resistance
We included two SOC patient cohorts (GSE63885, GSE51373) with clinically well-defined responses to platinum-based chemotherapy as the discovery datasets to identify gene expression alterations related to primary platinum resistance. GSE63885 included 32 patients with platinum resistance and 38 patients with platinum sensitivity, and GSE51373 consisted of 10 patients with platinum resistance and 18 patients with platinum sensitivity. We analyzed the gene expression profiles of GSE51373 and identified 867 DEGs (467 upregulated genes and 400 downregulated genes) between platinum-resistant and platinum-sensitive cases (p ≤ 0.05); in GSE63885, we found 492 DEGs (230 upregulated and 262 downregulated). As shown in Figure 1A, the intersecting part of two DEG lists derived from two datasets contained seven upregulated and eight downregulated genes; details are listed in Table S2. The two complete DEGs lists from GSE51373 and GSE63885 are shown in Table S3 and Table S4, respectively.
Identification of DEGs between platinum-sensitive and platinum-resistant patients. (A) Venn diagrams of the overlapping parts of DEGs derived from GSE51373 and GSE63885. Seven upregulated and eight downregulated genes were common to all DEG lists. (B-D) Box plots of AGGF1 and MFAP4 mRNA expressions between platinum-sensitive and platinum-resistant patients in the discovery datasets (GSE63885, GSE51373) and validation dataset (TCGA). The red dots represent platinum-resistant patients, whereas the blue dots represent platinum-sensitive patients.
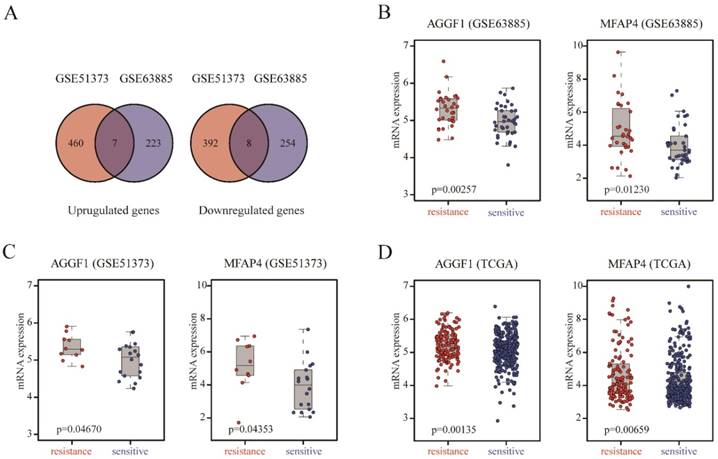
To demonstrate the robustness and reproducibility of the 15 intersecting DEGs derived from the two discovery datasets, we further verified the altered expression levels of these genes using an independent dataset (TCGA), which was generated from a different platform. TCGA included 318 patients with platinum resistance and 136 patients with platinum sensitivity. As shown in Table S2, AGGF (p = 0.0014) and MFAP4 (p = 0.0066) were also differentially expressed between platinum-resistant and platinum-sensitive patients in TCGA, consistent with the discovery datasets. AGGF and MFAP4 expression levels were markedly elevated in platinum-resistant patients in three datasets (Figure 1B-1D). Therefore, high expression of AGGF1 and MFAP4 was significantly correlated with primary platinum resistance in patients with SOC.
AGGF and MFAP4 were independent predictors of primary platinum resistance
AGGF and MFAP4 mRNA expression levels in patients in GSE63885 and GSE51373 were divided into “high” (+) and “low” (-) groups according to their respective cutoffs derived from TCGA (AGGF: 4.577, MFAP4: 4.932). We performed statistical analysis for the correlations of mRNA expression statuses of the two genes with various clinical characteristics available in the three datasets. We found that AGGF1 expression status had a negative relationship with age at diagnosis (p = 0.0137) in patients in GSE51373. Additionally, high expression of MFAP4 was significantly correlated with higher tumor stage (p = 0.0052) and older age at diagnosis (p = 0.02427) in TCGA. There were no other significant relationships between the mRNA expression statuses of the two genes and clinical characteristics (Table S5). As shown in Table 2, we conducted univariate logistic regression analysis to further evaluate the predictive performances of these two genes and other clinical factors available in each dataset. The results showed that high expression levels of both AGGF1 and MFAP4 (p ≤ 0.05) predicted poor response to platinum-based chemotherapy in patients with SOC in the three datasets. Surgery information is only available in TCGA, and we found that patients who received suboptimal debulking surgery showed higher rates of platinum resistance than those who received optimal debulking surgery (odds ratio [OR] = 3.36, 95% confidence interval [CI] = 2.13-5.3, p < 0.001). However, no significant associations were found between platinum resistance and age, tumor stage, or tumor grade in each dataset. Multivariate logistic regression analysis revealed that higher expression of AGGF1 and MFAP4 (p ≤ 0.05) was significantly independently associated with the higher probability of platinum resistance in patients with SOC after adjusting for other clinical factors in the three datasets.
Univariable and multivariable logistic regression models for platinum resistance in the discovery and validation datasets.
| Datasets and clinical factors | Univariate analysis | Multivariate analysis | |||||
|---|---|---|---|---|---|---|---|
| OR | 95%CI | p value | OR | 95%CI | p value | ||
| GSE63885 | |||||||
| Tumor stage | II | 1 (reference) | 1 (reference) | ||||
| III | 13205836.02 | 0 - Inf | 0.99 | 3537708.16 | 0 - Inf | 0.99 | |
| IV | 19564201.51 | 0 - Inf | 0.99 | 4665494.34 | 0 - Inf | 0.99 | |
| Tumor grade | G2 | 1 (reference) | 1 (reference) | ||||
| G3 | 2.94 | 0.55 - 15.7 | 0.20 | 1.87 | 0.27 - 12.9 | 0.52 | |
| G4 | 5.25 | 0.8 - 34.43 | 0.08 | 3.05 | 0.36 - 26.11 | 0.30 | |
| AGGF1 | high vs. low | 3.71 | 1.33 - 10.32 | 0.01 | 3.32 | 1.07 - 10.28 | 0.03 |
| MFAP4 | high vs. low | 4.67 | 1.69 - 12.9 | 0.003 | 3.64 | 1.18 - 11.22 | 0.02 |
| GSE51373 | |||||||
| Tumor stage | II | 1 (reference) | 1 (reference) | ||||
| III | 2.33 | 0.22 - 25.24 | 0.48 | 0.64 | 0 - 139.25 | 0.87 | |
| IV | 8 | 0.31 - 206.37 | 0.21 | 0.52 | 0 - 279.37 | 0.83 | |
| Age | >=60 vs. <60 | 0.13 | 0.01 - 1.22 | 0.07 | 0.11 | 0 - 3.02 | 0.19 |
| AGGF1 | high vs. low | 14.14 | 1.46 - 137.3 | 0.02 | 18.51 | 0.93 - 369.88 | 0.05 |
| MFAP4 | high vs. low | 10.4 | 1.62 - 66.9 | 0.01 | 15.22 | 1.11 - 207.9 | 0.04 |
| TCGA | |||||||
| Tumor stage | Ⅰ | 1 (reference) | 1 (reference) | ||||
| II | 0.28 | 0.02 - 3.39 | 0.31 | 0 | 0 - Inf | 0.98 | |
| III | 2.39 | 0.52 - 10.97 | 0.26 | 1.02 | 0.2 - 5.06 | 0.98 | |
| IV | 3.2 | 0.66 -15.61 | 0.15 | 1.64 | 0.31 - 8.72 | 0.56 | |
| Tumor grade | G1 | 1 (reference) | 1 (reference) | ||||
| G2 | 1.95 | 0.2 - 18.7 | 0.56 | 1.5 | 0.13 - 16.7 | 0.74 | |
| G3 | 1.72 | 0.19 - 15.52 | 0.63 | 1.15 | 0.11 - 11.81 | 0.90 | |
| G4 | 0 | 0 - Inf | 0.98 | 0 | 0 - Inf | 0.99 | |
| Age | >=60 vs. <60 | 1.08 | 0.72 - 1.62 | 0.71 | 0.99 | 0.62 - 1.59 | 0.98 |
| Surgery | Suboptimal vs. Optimal | 3.36 | 2.13 - 5.3 | < 0.001 | 3.16 | 1.93 - 5.16 | < 0.001 |
| AGGF1 | high vs. low | 2.24 | 1.47 - 3.41 | < 0.001 | 2.54 | 1.58 - 4.08 | < 0.001 |
| MFAP4 | high vs low | 1.81 | 1.21 - 2.72 | 0.004 | 1.64 | 1.03 - 2.62 | 0.03 |
Abbreviations: OR odds ratio, 95% CI 95%confidential interval
Bold text denotes p ≤ 0.05
CNV status and methylation of AGGF1 and MFAP4 did not contribute to their different mRNA expression levels in patients with platinum-resistant and platinum-sensitive SOC
To detect possible regulatory mechanisms associated with AGGF1 and MFAP4 expression values, we measured the correlations of AGGF1 and MFAP4 mRNA expression with their respective CNVs and methylation values in TCGA. CNVs were classified as homozygous deletion, single-copy deletion, diploid normal copy, gain, and amplification. AGGF1 CNV status was significantly positively correlated with its mRNA expression (p < 2.2e-16). However, no significant relationship was observed between MFAP4 mRNA expression values and CNV status (p = 0.8464; Figure 2A). As shown in Figure 2B, both AGGF1 and MFAP4 showed significant negative correlations between their DNA methylation values and mRNA expression values (p = 7.472e-4 and p < 2.2e-16, respectively). Therefore, we further investigated whether CNV status and methylation values of AGGF1 and MFAP4 accounted for significant differences in their mRNA expression between platinum-resistant and platinum-sensitive patients.
Possible mechanisms modulating AGGF1 and MFAP4 mRNA expression. (A) Correlations of AGGF1 and MFAP4 mRNA expression with CNV status. For CNV status, Deep del = homozygous deletion, Shallow del = single-copy deletion, Diploid = diploid normal copy. The total significance was estimated from the null distribution constructed by the asymptotic K-sample permutation test, and the p values were adjusted with the BH method. (B) Correlations of AGGF1 and MFAP4 mRNA expression with methylation values. The blue lines represent the linear regression between the expression values and methylation values. (C) Bar charts of AGGF1 and MFAP4 CNV status between platinum-resistant and platinum-sensitive patients. The red bars represent platinum-resistant patients, whereas the blue bars represent platinum-sensitive patients. (D) Box plots of AGGF1 and MFAP4 methylation values between platinum-resistant and platinum-sensitive patients. The red dots represent platinum-resistant patients, whereas the blue dots represent platinum-sensitive patients.
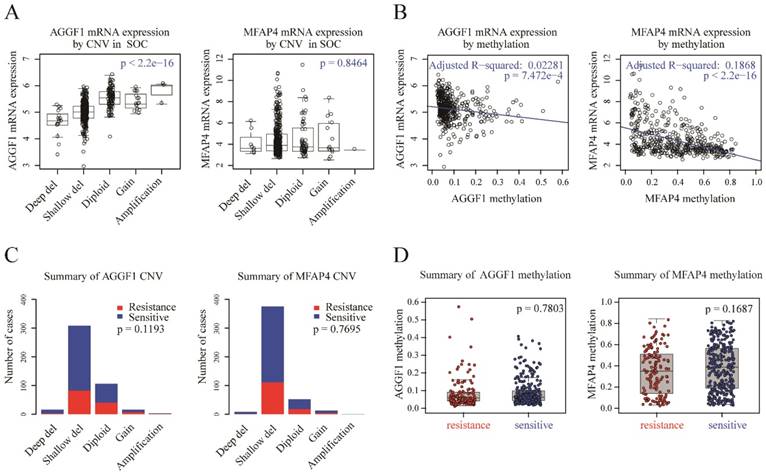
We found that there were no significant differences in AGGF1 and MFAP4 CNV statuses between platinum-resistant and platinum-sensitive patients (Figure 2C, p = 0.1193 and p = 0.7695, respectively). Additionally, methylation values of AGGF1 and MFAP4 also did not show any differences between the two groups (Figure 2D, p = 0.7803 and p = 0.1687, respectively). In general, although CNV status and methylation values of AGGF1 were significantly correlated with mRNA expression values, and MFAP4 methylation was also related to MFAP4 mRNA expression, neither CNV status nor methylation values of AGGF1 or MFAP4 facilitated their different mRNA expression levels between platinum resistant and platinum sensitive SOC patients.
Platinum resistance prediction model based on the combination of AGGF1 and MFAP4 had robust prediction power
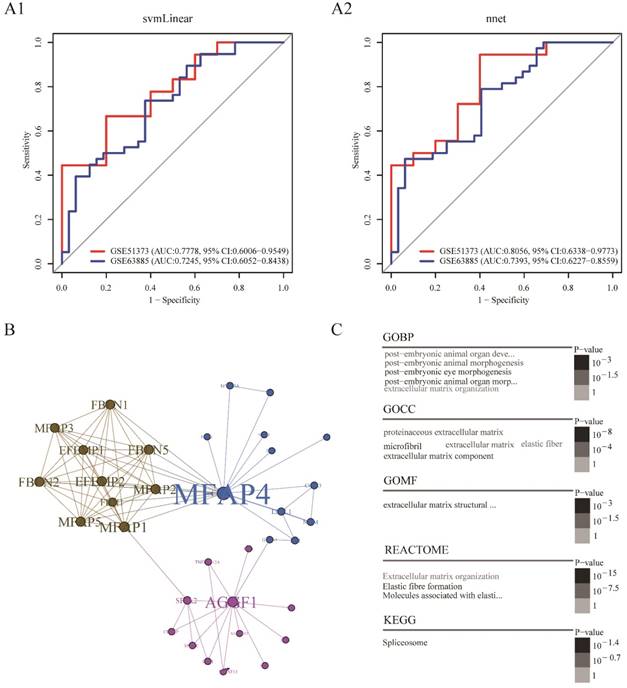
In order to build a clinically applicable primary platinum resistance prediction model, we used two machine learning algorithms: svmLinear and nnet, prediction models based on combination of AGGF1 and MFAP4 mRNA expression values were built in the TCGA dataset and subsequently tested in two other datasets (GSE51373, GSE63885). As shown in Figure 3A1-A2, these two models showed good performance in two datasets (highest AUC: 0.8056, 95% CI: 0.6338-0.9773; lowest AUC: 0.7245, 95% CI: 0.6052-0.8438). Among these two prediction models, the model built by nnet seemed to be slightly better (GSE51373: AUC: 0.8056, 95% CI: 0.6338-0.9773; GSE63885: AUC: 0.7393, 95% CI: 0.6227-0.8559). Moreover, regardless of which machine learning algorithm was adopted, models based on the combination of AGGF1 and MFAP4 had robust prediction power for primary platinum resistance. These results further indicated that the two-gene signature was able to distinguish among patients with SOC having a high or low risk of platinum resistance.
Platinum resistance prediction model and potential regulation patterns for AGGF1 and MFAP4. (A1) Platinum resistance prediction model based on the combination of AGGF1 and MFAP4 by applying linear kernel support vector machine algorithm. (A2) Platinum resistance prediction model based on the combination of AGGF1 and MFAP4 by applying artificial neural network. (B) The minimal AGGF1- and MFAP4-centered undirected protein interaction network from the STRING database. Nodes represent proteins, and the node size was proportional to the connectivity degree of the protein with the other proteins. Edges represent the interactions between proteins. Three communities are represented by three different colors. (C) Word cloud plots of GOBP, GOCC, GOMF, REACTOME, and KEGG enriched terms on the network (adjusted p ≤ 0.05). The significance is shown with different font sizes and gray scale.
Potential regulatory patterns between AGGF1 and MFAP4
To further explore the possible interactions between AGGF1 and MFAP4 in patients with SOC, we extracted the minimal AGGF1- and MFAP4-centered undirected protein interaction network from STRING database (Figure 3B). The network contained three distinct communities with 34 nodes and 85 edges. AGGF1 and MFAP4 belonged to different communities and had the highest degree of connectivity in their respective communities. We found that MFAP4 was the most widely connected with other proteins in the whole network. Furthermore, we explored the shortest path between AGGF1 and MFAP4 in this network. AGGF1 and MFAP4 were connected by two other proteins, FLII and GATA1. Therefore, the shortest path was determined, namely, the AGGF1/FLII/GATA1/MFAP4 axis. Four proteins in this axis belonged to two communities. MFAP4, FLII, and GATA1 were in same community, and AGGF1 belonged to another community. This axis may represent the potential regulatory pathway between AGGF1 and MFAP4.
To gain insight into the biological roles of the AGGF1- and MFAP4-centered protein interaction network, we performed GO, REACTOME, and KEGG enrichment analysis. As shown in Figure 3C, of the five enriched GO biological process (GOBP) terms, there were four enriched terms participating in regulating postembryonic morphogenesis, and the remaining enriched term was extracellular matrix organization. In terms of GO cellular component (GOCC), the enriched GO terms were mainly related to the extracellular matrix and fiber. There was only one enriched term for GO molecular function (GOMF), i.e., extracellular matrix structural constituent. Additionally, REACTOME pathway analysis indicated that the significantly enriched pathways were related to elastic fiber formation and extracellular matrix organization. The enriched KEGG pathway was the spliceosome pathway.
AGGF1 and MFAP4 were independent indicators for prognosis in patients with SOC
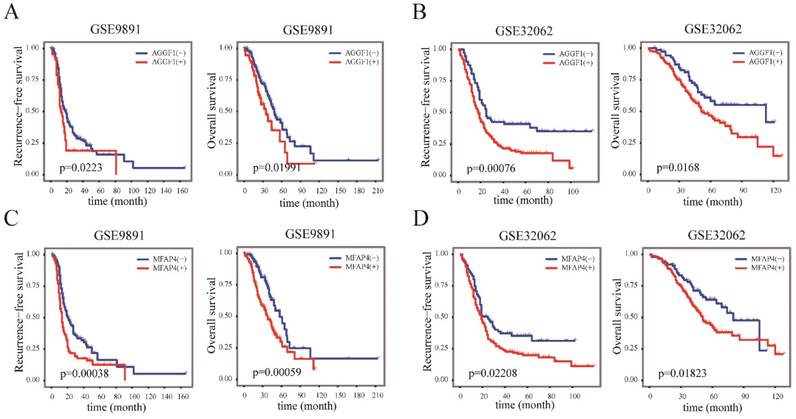
We next examined whether the elevated mRNA expression of AGGF1 and MFAP4 affected the survival of patients with SOC using two independent datasets (GSE9891 and GSE32062); in total, 517 patients with SOC were included in this part of our study. According to the cut-off values established in TCGA, AGGF1 and MFAP4 expression levels were classified into “high”(+) and “low”(-) in GSE9891 and GSE32062. Kaplan-Meier curves revealed that the high expression groups for both AGGF1 and MFAP4 had significantly poorer RFS and OS in GSE9891 (p ≤ 0.05; Figure 4A-4D). These results emphasized the relationships between the expression statuses of these two genes and the prognosis of patients with SOC. By combining AGGF1 and MFAP4 expression statuses, patients in GSE32062 and GSE9891 were respectively divided into four crossed groups, i.e., AGGF1(-) MFAP4(-), AGGF1(+)MFAP4(-), AGGF1(-)MFAP4 (+), and AGGF1(+)MFAP4(+).
The prognostic significance of AGGF1 and MFAP4 expression statuses in patients with SOC. (A) Kaplan-Meier plots of RFS and OS with different AGGF expression statuses in GSE9891. (B) Kaplan-Meier plots of RFS and OS with different AGGF1 expression statuses in GSE32062. (C) Kaplan-Meier plots of RFS and OS with different MFAP4 expression statuses in GSE9891. (D) Kaplan-Meier plots of RFS and OS with different MFAP4 expression statuses in GSE32062. For both AGGF1 and MFAP4, (-) represents lower expression status, and (+) represents higher expression status.
Univariate and multivariate Cox regression analysis for recurrence free survival in GSE9891 and GSE32062.
| Datasets and clinical factors | Univariate analysis | Multivariate analysis | |||||
|---|---|---|---|---|---|---|---|
| HR | 95%CI | p value | HR | 95%CI | p value | ||
| GSE9891 | |||||||
| Age | ≥60y vs. <60y | 1.282 | 0.954 -1.724 | 0.10 | 1.479 | 1.056 - 2.071 | 0.023 |
| Tumor stage | I | 1 (reference) | 1 (reference) | ||||
| II | 2.603 | 0.477 - 14.22 | 0.269 | 2.972 | 0.540 - 16.377 | 0.211 | |
| III | 9.774 | 2.418 - 39.51 | 0.001 | 7.966 | 1.941 - 32.692 | 0.004 | |
| IV | 14.809 | 3.452 - 63.52 | 2.86e-04 | 10.498 | 2.314 - 47.623 | 0.002 | |
| Tumor grade | G1 | 1 (reference) | 1 (reference) | ||||
| G2 | 3.116 | 1.252 - 7.755 | 0.015 | 1.711 | 0.604 - 4.845 | 0.312 | |
| G3 | 2.723 | 1.109 - 6.684 | 0.029 | 1.406 | 0.502 - 3.936 | 0.517 | |
| Surgery | Suboptimal vs. optimal | 2.058 | 1.489 - 2.844 | 1.218e-05 | 1.704 | 1.203 - 2.413 | 0.003 |
| AGGF1 | high vs. low | 1.532 | 1.071 - 2.192 | 0.020 | 1.578 | 1.069 - 2.330 | 0.022 |
| MFAP4 | high vs. low | 1.708 | 1.260 - 2.315 | 5.595e-04 | 1.418 | 1.003 - 2.006 | 0.048 |
| GSE32062 | |||||||
| Tumor stage | III | 1 (reference) | 1 (reference) | ||||
| IV | 1.515 | 1.088 - 2.109 | 0.014 | 1.327 | 0.948 - 1.858 | 0.099 | |
| Tumor grade | G2 | 1 (reference) | 1 (reference) | ||||
| G3 | 1.151 | 0.868 - 1.527 | 0.330 | 1.121 | 0.840 - 1.498 | 0.438 | |
| Surgery | Suboptimal vs. optimal | 1.772 | 1.315 - 2.387 | 1.683e-04 | 1.667 | 1.234 - 2.250 | 0.001 |
| AGGF1 | high vs. low | 1.777 | 1.263 - 2.5 | 9.666e-04 | 1.757 | 1.246 - 2.476 | 0.001 |
| MFAP4 | high vs. low | 1.494 | 1.096 - 2.037 | 0.011 | 1.417 | 1.039 - 1.933 | 0.028 |
Abbreviations: HR hazard ratio, 95% CI 95%confidential interval. Bold text denotes p ≤ 0.05
Univariate and multivariate Cox regression analysis for overall survival in GSE9891 and GSE32062.
| Datasets and clinical factors | Univariate analysis | Multivariate analysis | |||||
|---|---|---|---|---|---|---|---|
| HR | 95%CI | p value | HR | 95%CI | p value | ||
| GSE9891 | |||||||
| Age | ≥60y vs <60y | 1.458 | 1.001 - 2.122 | 0.049 | 1.729 | 1.125 - 2.655 | 0.012 |
| Tumor stage | I | 1 (reference) | 1 (reference) | ||||
| II | 0.483 | 0.044 - 5.347 | 0.553 | 0.705 | 0.062 - 7.947 | 0.777 | |
| III | 3.672 | 0.903 - 14.935 | 0.069 | 3.103 | 0.740 - 13.020 | 0.122 | |
| IV | 5.739 | 1.301 - 25.319 | 0.021 | 4.929 | 1.035 - 23.483 | 0.045 | |
| Tumor grade | G1 | 1 (reference) | 1 (reference) | ||||
| G2 | 3.070 | 0.937 - 10.06 | 0.064 | 1.343 | 0.387 - 4.663 | 0.642 | |
| G3 | 3.181 | 0.999 - 10.13 | 0.0502 | 1.534 | 0.453 - 5.192 | 0.491 | |
| Surgery | Suboptimal vs optimal | 1.662 | 1.117 - 2.471 | 0.012 | 1.309 | 0.850 - 2.014 | 0.221 |
| AGGF1 | high vs. low | 1.662 | 1.081 - 2.555 | 0.021 | 2.014 | 1.240 - 3.270 | 0.005 |
| MFAP4 | high vs. low | 1.98 | 1.33 - 2.947 | 0.001 | 1.660 | 1.065 - 2.586 | 0.025 |
| GSE32062 | |||||||
| Tumor stage | III | 1 (reference) | 1 (reference) | ||||
| IV | 1.466 | 0.981 - 2.189 | 0.062 | 1.323 | 0.881 - 1.986 | 0.177 | |
| Tumor grade | G2 | 1 (reference) | 1 (reference) | ||||
| G3 | 0.978 | 0.684 - 1.399 | 0.904 | 0.926 | 0.645 - 1.328 | 0.675 | |
| Surgery | Suboptimal vs optimal | 2.013 | 1.363 - 2.972 | 4.347e-04 | 1.909 | 1.291 - 2.822 | 0.001 |
| AGGF1 | high vs. low | 1.678 | 1.091 - 2.579 | 0.018 | 1.543 | 1.001 - 2.376 | 0.049 |
| MFAP4 | high vs. low | 1.622 | 1.081 - 2.436 | 0.020 | 1.581 | 1.053 - 2.374 | 0.027 |
Abbreviations: HR hazard ratio, 95% CI 95%confidential interval. Bold text denotes p ≤ 0.05
With the exception of RFS in patients in GSE9891, we found that slightly more significant differences in prognosis were observed among these four groups (Figure S1), suggesting that the combination of two genes had slightly better prognostic ability for survival than either single gene alone. Additionally, we found that AGGF1 expression status was not significantly correlated with clinical characteristics in GSE32062 and GSE9891, whereas high expression of MFAP4 was related to higher tumor stage (p = 7.335e-05) and suboptimal surgery rate (p = 0.0042) in GSE9891 (Table S6).
We performed univariate Cox proportional hazard regression analysis with AGGF1 and MFAP4 and other clinical factors available in GSE9891 and GSE32062, and found that the expression statuses of both AGGF1 and MFAP4 (p ≤ 0.05) were significantly correlated with unfavorable RFS and OS in patients in the two datasets. Then, to further evaluate the predictive abilities of these two genes for survival in patients with SOC, we conducted multivariate Cox proportional hazard regression analysis. The results showed that both AGGF1 and MFAP4 statuses still maintained significantly correlated with RFS and OS after adjustment for other clinical variables (p ≤ 0.05). We also found that in addition to AGGF1 and MFAP4 expression statuses, in univariate analysis, suboptimal surgery (p ≤ 0.05) was significantly associated with poorer RFS and OS in patients in the two datasets; however, in multivariate analysis, patients who received suboptimal surgery did not show obvious shorter OS than optimally debulked patients in GSE9891. From the above results, we deduced that AGGF1 and MFAP4 could be used as independent prognostic factors predicting survival in patients with SOC and could be more effective predictors than traditional clinical features.
Discussion
Chemotherapy resistance is the main factor affecting survival and prognosis in patients with SOC [29]. Accordingly, identification of molecular signatures that are capable of predicting response to platinum-based chemotherapy after standard treatment may facilitate the identification of patients with SOC who may not be suitable for platinum-based chemotherapy and could therefore benefit from alternative strategies and avoid side effects of platinum-based compounds.
The AGGF1 gene, previously known as VG5Q, was first characterized as a susceptibility gene for the congenital vascular disease Klippel-Trenaunay syndrome [30]. Several studies have reported the roles of AGGF1 in tumors, although the conclusions have not been consistent. For example, in patients with hepatocellular carcinoma and gastric cancer, overexpression of AGGF1 protein is an independent predictor of poor prognosis [31, 32]. Moreover, AGGF1 mRNA and protein are highly expressed in malignant pleural mesothelioma [33]. However, overexpression of AGGF1 mRNA is associated with favorable survival outcomes in group 3 medulloblastoma [34].
MFAP4 was initially identified as a gene generally deleted in patients with Smith-Magenis syndrome [35]. One study showed that MFAP4 has the potential to serve as a promising biomarker for noninvasive assessment of various conditions, such as chronic obstructive pulmonary disease [36, 37], hepatic cirrhosis [38, 39], diabetic neuropathy [40], and cardiovascular complications [41]. However, the biological functions of MFAP4 in tumors remain largely unknown. Notably, a recent study reported that high expression of MFAP4 mRNA is significantly related with lower overall survival rates in patients with neuroblastoma [42].
In this study, a comprehensive analysis of gene expression profiles in patients with SOC from GSE63885 and GSE51373 was conducted. 15 intersected genes related to platinum resistance were identified from these two datasets. Additionally, two of these 15 genes, namely, AGGF1 and MFAP4, were confirmed to be related to platinum resistance in an independent dataset (TCGA). The increased mRNA expression levels of AGGF1 and MFAP4 were associated with a high probability of resistance in the three datasets. Multivariable logistic regression analysis revealed that the predictive values of both AGGF1 and MFAP4 for platinum resistance were independent of other clinicopathological factors. Furthermore, we found that regardless of which machine learning algorithm was adopted, prediction models based on the combination of AGGF1 and MFAP4 mRNA expression values had robust prediction power for primary platinum resistance. These results further indicated that the two gene signatures could be applied to update the current prognostic model and contribute to the stratification of patients with SOC in future clinical trials. We also delineated an AGGF1- and MFAP4-centered protein network that may account for the involvement of these proteins in the development of platinum resistance in SOC and extracted the shortest pathway between AGGF1 and MFAP4, which may be related to the regulation of these targets. To improve our understanding of the roles of AGGF1 and MFAP4 in platinum resistance in patients with SOC, the underlying regulatory mechanisms need to be explored further. We also found that neither CNV status nor methylation values of AGGF1 and MFAP4 contributed to the differential mRNA expression levels between platinum-resistant and platinum-sensitive patients with SOC; hence, the mechanisms leading to increased AGGF1 and MFAP4 mRNA levels in platinum-resistant patients compared with those in platinum-sensitive patients should be further investigated in experimental studies. Finally, high expression levels AGGF1 and MFAP4 were also shown to be associated with poor prognosis independent of other clinical factors in the two other independent external SOC datasets (GSE9891, GSE32062). With a few exceptions, in general, AGGF1 and MFAP4 were not significantly associated with clinical features in all datasets analyzed in our study (GSE51373, GSE63885, TCGA, GSE9891, GSE32062).
A recent study demonstrated that downregulation of MFAP4 resulted in reduced cell proliferation and increased cell apoptosis, leading to tumor growth arrest [42]. Additionally, Zhang et al reported that melanoma tumor growth and angiogenesis were significantly decreased in heterozygous AGGF1-knockout mice [43]. Therefore, we speculate that modulation of AGGF1 and MFAP4 expression may represent a novel therapeutic strategy for overcoming primary platinum-based chemoresistance in SOC.
This study had some limitations. First, owing to the restricted availability of datasets with clinically well-defined responses to chemotherapies, only three datasets were evaluated in our study to explore and validate the gene signatures of platinum resistance; consequently, the robustness of these two gene signatures should be further investigated in clinical trials. Second, although the biological functions of AGGF1 and MFAP4 have been inferred by functional enrichment analysis, the mechanisms related to the predictive roles of these two gene signatures in response to platinum-based chemotherapy in SOC are still not clear and need to be further explored in experimental studies.
In this study, we identified AGGF1 and MFAP4 as potential predictive biomarkers for response to platinum-based chemotherapy and survival outcomes in patients with SOC, providing a molecular basis for the development of targeted strategies for overcoming platinum resistance in SOC and potentially facilitating clinical decision-making and disease surveillance. The underlying mechanisms mediating the upregulation of AGGF1 and MFAP4 in patients with platinum-resistant SOC also remain unclear and should be evaluated in future studies.
Abbreviations
OC: ovarian cancer; SOC: serous ovarian cancer; GEO: Gene Expression Omnibus database; TCGA: The Cancer Genome Atlas database; RFS: recurrence free survival; OS: overall survival; DEGs: differentially expressed genes; CNV: copy number variation; svmLinear: linear kernel support vector machine; nnet: neural network; ROC: receiver operating characteristic curves; AUC: area under the ROC curve values; KEGG: Kyoto Encyclopedia of Genes and Genomes; GO: Gene Ontology; GOBP: Gene Ontology biological processes; GOCC: Gene Ontology cellular component; GOMF: Gene Ontology molecular function; OR: Odds ratio; 95% CI: 95 confidence intervals; HR: Hazard ratio.
Supplementary Material
Supplementary figure and tables.
Acknowledgements
This work was generously supported by the National Natural Science Foundation of China (81601992, 81472783, 81772773, 81302275), Natural Science Foundation of Jiangsu Province (BK20160343).
Competing Interests
The authors have declared that no competing interest exists.
References
1. Siegel RL, Miller KD, Jemal A. Cancer Statistics, 2017. CA Cancer J Clin. 2017;67:7-30
2. Barnholtz-Sloan JS, Schwartz AG, Qureshi F. et al. Ovarian cancer: changes in patterns at diagnosis and relative survival over the last three decades. Am J Obstet Gynecol. 2003;189:1120-7
3. Staropoli N, Ciliberto D, Chiellino S. et al. Is ovarian cancer a targetable disease? A systematic review and meta-analysis and genomic data investigation. Oncotarget. 2016;7:82741-56
4. Kurman RJ, Shih Ie M. The origin and pathogenesis of epithelial ovarian cancer: a proposed unifying theory. Am J Surg Pathol. 2010;34:433-43
5. Friedlander ML, Stockler MR, Butow P. et al. Clinical trials of palliative chemotherapy in platinum-resistant or -refractory ovarian cancer: time to think differently? J Clin Oncol. 2013;31:2362
6. Prat J. New insights into ovarian cancer pathology. Ann Oncol. 2012;23(Suppl 10):x111-7
7. Lengyel E. Ovarian cancer development and metastasis. Am J Pathol. 2010;177:1053-64
8. Ryner L, Guan Y, Firestein R. et al. Upregulation of Periostin and Reactive Stroma Is Associated with Primary Chemoresistance and Predicts Clinical Outcomes in Epithelial Ovarian Cancer. Clin Cancer Res. 2015;21:2941-51
9. Ishibashi M, Nakayama K, Yeasmin S. et al. A BTB/POZ gene, NAC-1, a tumor recurrence-associated gene, as a potential target for Taxol resistance in ovarian cancer. Clin Cancer Res. 2008;14:3149-55
10. Choi JH, Sheu JJ, Guan B. et al. Functional analysis of 11q13.5 amplicon identifies Rsf-1 (HBXAP) as a gene involved in paclitaxel resistance in ovarian cancer. Cancer Res. 2009;69:1407-15
11. Yang YI, Ahn JH, Lee KT. et al. RSF1 is a positive regulator of NF-kappaB-induced gene expression required for ovarian cancer chemoresistance. Cancer Res. 2014;74:2258-69
12. Jazaeri AA, Awtrey CS, Chandramouli GV. et al. Gene expression profiles associated with response to chemotherapy in epithelial ovarian cancers. Clin Cancer Res. 2005;11:6300-10
13. Helleman J, Jansen MP, Span PN. et al. Molecular profiling of platinum resistant ovarian cancer. Int J Cancer. 2006;118:1963-71
14. Lisowska KM, Olbryt M, Dudaladava V. et al. Gene expression analysis in ovarian cancer - faults and hints from DNA microarray study. Front Oncol. 2014;4:6
15. Koti M, Gooding RJ, Nuin P. et al. Identification of the IGF1/PI3K/NF kappaB/ERK gene signalling networks associated with chemotherapy resistance and treatment response in high-grade serous epithelial ovarian cancer. BMC Cancer. 2013;13:549
16. Cancer Genome Atlas Research N. Integrated genomic analyses of ovarian carcinoma. Nature. 2011;474:609-15
17. Yoshihara K, Tsunoda T, Shigemizu D. et al. High-risk ovarian cancer based on 126-gene expression signature is uniquely characterized by downregulation of antigen presentation pathway. Clin Cancer Res. 2012;18:1374-85
18. Tothill RW, Tinker AV, George J. et al. Novel molecular subtypes of serous and endometrioid ovarian cancer linked to clinical outcome. Clin Cancer Res. 2008;14:5198-208
19. Irizarry RA, Hobbs B, Collin F. et al. Exploration, normalization, and summaries of high density oligonucleotide array probe level data. Biostatistics. 2003;4:249-64
20. Ganzfried BF, Riester M, Haibe-Kains B. et al. curatedOvarianData: clinically annotated data for the ovarian cancer transcriptome. Database (Oxford). 2013;2013:bat013
21. Leek JT, Johnson WE, Parker HS. et al. sva: Surrogate Variable Analysis. R package version 3.26.0. 2017
22. López-Ratón M, Rodríguez-Álvarez MX, Cadarso-Suárez C. et al. OptimalCutpoints: An R Package for Selecting Optimal Cutpoints in Diagnostic Tests. Journal of Statistical Software. 2014;61:1-36
23. Cerami E, Gao J, Dogrusoz U. et al. The cBio cancer genomics portal: an open platform for exploring multidimensional cancer genomics data. Cancer Discov. 2012;2:401-4
24. Kuhn M. caret: Classification and Regression Training. R package version 6.0-79. 2018
25. Robin X, Turck N, Hainard A. et al. pROC: an open-source package for R and S+ to analyze and compare ROC curves. BMC Bioinformatics. 2011;12:77
26. Szklarczyk D, Franceschini A, Wyder S. et al. STRING v10: protein-protein interaction networks, integrated over the tree of life. Nucleic Acids Res. 2015;43:D447-52
27. Kassambara A, Kosinski M. survminer: Drawing Survival Curves using 'ggplot2'. R package version 0.4.2. 2018
28. Gentleman RC, Carey VJ, Bates DM. et al. Bioconductor: open software development for computational biology and bioinformatics. Genome Biol. 2004;5:R80
29. Markman M. Antineoplastic agents in the management of ovarian cancer: current status and emerging therapeutic strategies. Trends Pharmacol Sci. 2008;29:515-9
30. Tian XL, Kadaba R, You SA. et al. Identification of an angiogenic factor that when mutated causes susceptibility to Klippel-Trenaunay syndrome. Nature. 2004;427:640-5
31. Wang W, Li GY, Zhu JY. et al. Overexpression of AGGF1 is correlated with angiogenesis and poor prognosis of hepatocellular carcinoma. Med Oncol. 2015;32:131
32. Yao HH, Wang BJ, Wu Y. et al. High Expression of Angiogenic Factor with G-Patch and FHA Domain1 (AGGF1) Predicts Poor Prognosis in Gastric Cancer. Med Sci Monit. 2017;23:1286-94
33. Roe OD, Anderssen E, Sandeck H. et al. Malignant pleural mesothelioma: genome-wide expression patterns reflecting general resistance mechanisms and a proposal of novel targets. Lung Cancer. 2010;67:57-68
34. Thompson EM, Keir ST, Venkatraman T. et al. The role of angiogenesis in Group 3 medulloblastoma pathogenesis and survival. Neuro Oncol. 2017;19:1217-27
35. Zhao Z, Lee CC, Jiralerspong S. et al. The gene for a human microfibril-associated glycoprotein is commonly deleted in Smith-Magenis syndrome patients. Hum Mol Genet. 1995;4:589-97
36. Brandsma CA, van den Berge M, Postma DS. et al. A large lung gene expression study identifying fibulin-5 as a novel player in tissue repair in COPD. Thorax. 2015;70:21-32
37. Johansson SL, Roberts NB, Schlosser A. et al. Microfibrillar-associated protein 4: a potential biomarker of chronic obstructive pulmonary disease. Respir Med. 2014;108:1336-44
38. Molleken C, Sitek B, Henkel C. et al. Detection of novel biomarkers of liver cirrhosis by proteomic analysis. Hepatology. 2009;49:1257-66
39. Bracht T, Schweinsberg V, Trippler M. et al. Analysis of disease-associated protein expression using quantitative proteomics-fibulin-5 is expressed in association with hepatic fibrosis. J Proteome Res. 2015;14:2278-86
40. Blindbaek SL, Schlosser A, Green A. et al. Association between microfibrillar-associated protein 4 (MFAP4) and micro- and macrovascular complications in long-term type 1 diabetes mellitus. Acta Diabetol. 2017;54:367-72
41. Wulf-Johansson H, Lock Johansson S, Schlosser A. et al. Localization of microfibrillar-associated protein 4 (MFAP4) in human tissues: clinical evaluation of serum MFAP4 and its association with various cardiovascular conditions. PLoS One. 2013;8:e82243
42. Zhao Z, Ma X, Sung D. et al. microRNA-449a functions as a tumor suppressor in neuroblastoma through inducing cell differentiation and cell cycle arrest. RNA Biol. 2015;12:538-54
43. Zhang T, Yao Y, Wang J. et al. Haploinsufficiency of Klippel-Trenaunay syndrome gene Aggf1 inhibits developmental and pathological angiogenesis by inactivating PI3K and AKT and disrupts vascular integrity by activating VE-cadherin. Hum Mol Genet. 2016;25:5094-110
Author contact
![]() Corresponding authors: Hong Li, E-mail: hongliszivfcom; Tao Zhu, E-mail: zhutaotjmu.edu.cn.
Corresponding authors: Hong Li, E-mail: hongliszivfcom; Tao Zhu, E-mail: zhutaotjmu.edu.cn.