Impact Factor ISSN: 1837-9664

 Global reach, higher impact
J Cancer 2019; 10(6):1398-1408. doi:10.7150/jca.29571 This issue Cite
Research Paper
The Identification of Potential Biomarkers and Biological Pathways in Prostate Cancer
Zhengshuai Song1,2*, Yu Huang1*, Ye Zhao3,*, Hailong Ruan1, Hongmei Yang4, Qi Cao1, Di Liu1, Xiaoping Zhang1 ![]() , Ke Chen1
, Ke Chen1 ![]()
1. Department of Urology, Union Hospital, Tongji Medical College, Huazhong University of Science and Technology, Wuhan 430022, China;
2. Department of Urology, The Central Hospital of Wuhan, Tongji Medical College, Huazhong University of Science and Technology;
3. Cancer Center, Union Hospital, Tongji Medical College, Huazhong University of Science and Technology, Wuhan 430022, China;
4. Department of Pathogenic Biology, School of Basic Medicine, Huazhong University of Science and Technology, Wuhan, Hubei 430030, P.R. China
*Contributed equally
Received 2018-8-29; Accepted 2019-1-4; Published 2019-2-23
Abstract
Purpose: The present study aims to explore the potential mechanisms contributing to prostate cancer (PCa), screen the hub genes, and identify potential biomarkers and correlated pathways of PCa progression.
Methods: The PCa gene expression profile GSE3325 was operated to analyze the differentially expressed genes (DEGs). DAVID was used to evaluate Gene ontology (GO) and the Kyoto Encyclopedia of Genes and Genomes (KEGG) analyses. A protein-protein interaction (PPI) network was constructed to visualize interactions of the hub genes. The prognostic and diagnostic analysis of these hub genes was carried out to evaluate their potential effects on PCa.
Results: A total of 847 DEGs were identified (427 upregulated genes and 420 downregulated genes). Meanwhile, top15 hub genes were showed. GO analysis displayed that the DEGs were mainly enriched in cell cycle, DNA damage response, signal transduction by p53 class mediator resulting in cell cycle arrest and proteinaceous extracellular matrix. KEGG analysis indicated the DEGs were enriched in the p53 signaling pathway and cell cycle pathway. The GO and KEGG enrichment analyses for the DEGs disclosed important biological features of PCa. PPI network showed the interaction of top 15 hub genes. Gene Set Enrichment Analysis (GSEA) revealed that some of the hub genes were associated with biochemical recurrence (BCR) and metastasis of PCa. Some top hub genes were distinctive and new discoveries compared with that of the existing associated researches.
Conclusions: Our analysis revealed that the changes of cell cycle and p53 signaling pathway are two major signatures of PCa. CENPA, KIF20A and CDCA8 might promote the tumorigenesis and progression of PCa, especially in BCR and metastasis, which could be novel therapeutic targets and biomarkers for diagnosis, prognosis of PCa.
Keywords: prostate cancer, biomarker, biological pathway, biochemical recurrence
Introduction
Prostate cancer (PCa) is the second most frequent malignancy in men and second most common cause of cancer-related death among men in the United State, the incidence of which continues to increase [1- 3]. Prostate [cancer usually develops from castration-sensitive to castration-resistant, inescapable progressing highly metastatic properties. The detailed molecular mechanism and potential targets of metastatic CRPC remains unclear, needing further research and experience urgently. Metastasis is the leading cause of PCa death. In this respect, intervention at the point of metastasis and biochemical recurrence (BCR) will be more valuable than at time when PCa has advanced to later stages. Thus, it is highly desirable to effectively estimate PCa with increased metastasis and BCR risk. Identifying effective biomarkers to better predict the diagnostic and prognostic levels of this malignancy metastasis and recurrence is also of vital importance.
The recent use of high-throughput gene microarray in analyzing normal and tumor tissue samples from patients gives us an opportunity to discover and explore the whole molecular landscapes of tumors at various levels ranging from copy number changes and somatic mutations at the genome level to gene expression alteration at transcriptome level [4-6]. While the application of microarrays in clinic is greatly limited because of numerous genes detected by gene profiling, lack of both independent reliability and repeatability, likewise the complicated statistical analyses. Meanwhile experimentally identifying key genes in genome-wide is very time-consuming and laborious. In order to put these expression profiles in clinical practice as soon as possible, it needs to develop an optimal approach that could be handled by routine assay. Moreover, there is an explicit need to improve our ability to enhance prostate cancer patients with high risk of metastasis and recurrence following radical prostatectomy (RP). The challenge in exactly predicting PCa metastasis and recurrence may in part attribute to a complicated network of pathways that promote the disease development.
In the current study, we downloaded GSE3325 from the Gene Expression Omnibus (GEO, http://www.ncbi.nlm.nih.gov/ geo/) and use the GEO2R online tool to systematically detect the differentially expressed genes (DEGs). Then, we constructed protein-protein interaction (PPI) network of the DEGs and choose the top 15 hub genes by a high degree of connectivity. Furthermore, the gene ontology and KEGG pathways of DEGs were analyzed. Meanwhile, disease free survival (DFS) and Biochemical Recurrence (BCR) analysis of the top 15 hub genes were operated based on The Cancer Genome Atlas (TCGA) database (https://genome-cancer.ucsc.edu/) [7]. After that, 3 genes were selected to further evaluate the mRNA expression and their protein expression in normal and tumor tissues, based on TCGA and The Human Protein Atlas database (http://www.proteinatlas.org). Finally, according to the diagnostic value, the correlation between them and AR expression, we focused our attention on KIF20A, which can interact with Rab6 small GTPase and involve in the Golgi-to-ER retrograde transport and is also an important mitotic kinesin needed for cytokinesis[8, 9]. Although some of previous studies displayed that KIF20A may play a key role in the tumorigenesis and progression of several types of cancer[10-13], the role of this gene in prostate cancer development and progression has not been illuminated. To obtain further insight into the function of KIF20A, GSEA was operated to map into GO analysis and KEGG pathways database. We also found that the expression of KIF20A correlated with clinical and pathological characteristics of patients with PCa. In conclusion, our findings identified 15 hub genes, which may play important roles in prostate cancer progression. This study also suggested that KIF20A may be a novel biomarker for predicting the diagnosis, prognosis and an important target for the treatment of metastatic and advanced PCa.
Materials and Methods
Microarray Data
Gene expression profile of GSE3325 was downloaded from the GEO database, which was a free and open available database. The GSE3325 dataset has a total of 19 samples, containing 7 primary prostate cancer samples, 6 metastasis and 6 normal prostate tissues, according to agilent GPL570 platform (Affymetrix Human Genome U133 Plus 2.0 Array). It includes genome-wide mRNA expression data of the 19 samples. We also downloaded the Series Matrix File of GSE3325 and obtained 54674 gene expression data in this database.
Identified Genes of Differential Expression
The DEGs between prostate cancer and normal prostate samples were analyzed by GEO2R (https://www.ncbi.nlm.nih.gov/geo/geo2r/), based on R language, which was an online analysis tool for the GEO database. We defined DEGs as differentially expressed with logFC > 2 (upregulated genes) or logFC < - 2 (downregulated genes), according to the criteria [14, 15]. The adjusted P value < 0.05 was considered statistically significant, which was utilized to decrease the false positive rate. Then, 427 upregulated genes and 420 downregulated genes were found, and the top 15 genes with a high degree of connectivity were chose as hub genes.
Further, hierarchical cluster analysis was used to show the volcano plot and heat map of two groups by ImageGP (http://www.ehbio.com/ImageGP/index.php/Home/ Index/index.html).
Gene Ontology and KEGG Pathway Analysis of DEGs
Genes could be annotated by Gene ontology (GO) analysis and their functions were classified by biological pathways, molecular function, as well as cellular components [16]. The Kyoto Encyclopedia of Genes and Genomes (KEGG) is a set of databases that could dispose biological pathways and genomes related to diseases and drugs. KEGG substantially is a channel for the overall and deep understanding of biological systems [17]. The cut-off criterion with statistic difference was P < 0 05. Used the DAVID online database (DAVID, http://david.ncifcrf.gov), cellular components, molecular functions, biological processes, and pathways of DEGs were analyzed.
PPI Network Analysis
The protein-protein interaction (PPI) information, like physical and functional associations, was assessed and integrated by The Search Tool for the Retrieval of Interacting Genes (STRING), an online tool. Until now, STRING version 10.0 have covered a total of 9,643,763 proteins from 2031 organisms[18]. To estimate the interactional correlation of these DEGs, DEGs was first drawn by STRING and then the Cytoscape software was used to construct a PPI network. Also, STRING was used to map 15 hub genes according to maximum number of interactors ≤ 5 and confidence score ≥ 0 4. GO and KEGG pathway was also utilized to analysis their potential information.
The Hub Gene Expression Level
In this study, the boxplot was employed to visualize the expression of 3 hub genes in 498 PCa samples and 52 normal prostate samples from TCGA-PARD (prostate adenocarcinoma) dataset. The Human Protein Atlas (HPA, https://www.proteinatlas.org/) is a Swedish-based project, which was launched in 2003 with the goal to map all human proteins in organs, tissues, cells and using the integration of diverse omics technologies[19]. By acquiring immunohistochemical data of patients with or without PCa based on HPA, we further confirmed the expression of these hub genes.
Survival Analysis of Hub Genes
The disease-free survival information was based on TCGA-PARD database. The hazard ratios (HR) with 95% confidence intervals were calculated and P < 0 05 was regarded as statistically significant.
Gene Set Enrichment Analysis
498 PCa samples from TCGA were classified into two groups (high versus low) based on the expression level of KIF20A, and the median expression value was considered as the cut-off point. To explore the potential function of KIF20A, GSEA (http://software.broadinstitute.org/gsea/index.jsp) was operated between the two groups. We selected annotated gene sets c2.cp.kegg. v5.2.symbols.gmt as the reference gene sets. FDR < 0 05and gene size ≥ 100 were considered as the cut-off criteria.
Statistical Analysis
The values of each group were presented as the mean ± SD. A difference of P < 0 05 was considered statistically significant. The statistical analysis software performed in this study was GraphPad Prism 6.0 (GraphPad Software, Inc., USA) and SPSS 22.0 (IBM SPSS, Chicago, IL). Unpaired t-test was used to elevate the statistical difference between KIF20A expression in cancer tissues and normal prostate tissues. The differences in KIF20A mRNA expression in the PCa subgroups were analyzed by the Mann- Whitney test. The diagnostic values of KIF20A in different patients with PCa were verified by receiver operator characteristic (ROC) curve analysis. The correlation between the KIF20A expression level and the DFS rate were calculated by the Kaplan-Meier curve and log-rank test.
Results
Screening of DEGs and Hub Genes
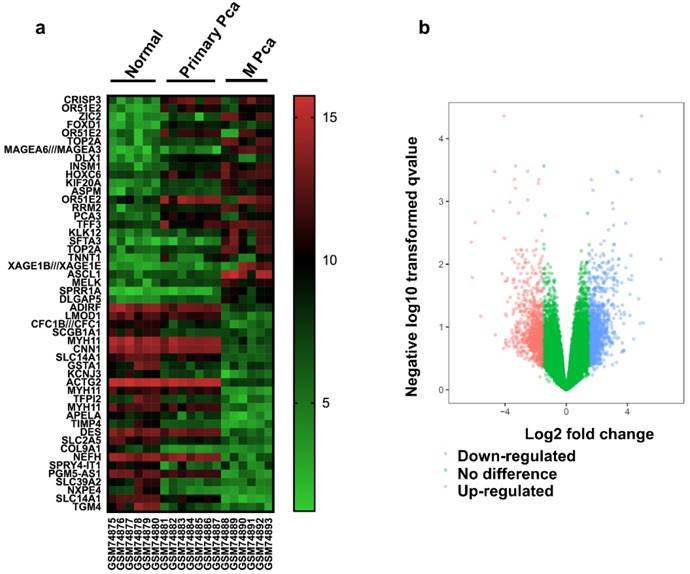
There were 13 PCa samples and 6 normal samples in this study. The DEGs were identified by the GEO2R online analysis tool, using adjusted P value < 0.05 and |logFC| ≥ 2 as cut-off criteria. A total of 847 DEGs were detected after analyzing GSE3325, 427 of which were upregulated genes while 420 were downregulated (Figure 1b). In Figure 1a, the expression of the top 25 upregulated and 25 downregulated DEGs with fold change 2 was displayed. And most of these genes were further upregulated or downregulated in metastasis prostate cancer. Additionally, 15 hub genes and their characteristics in PCa were identified based on their degree of connectivity from high to low (Table S1).
Identification of DEGs (a) Heat map of 50 representative DEGs. (b) Volcano plot of genes detected in PCa. Red means downregulated DEGs; blue means upregulated DEGs; green means no difference.
Functional Enrichment Analysis
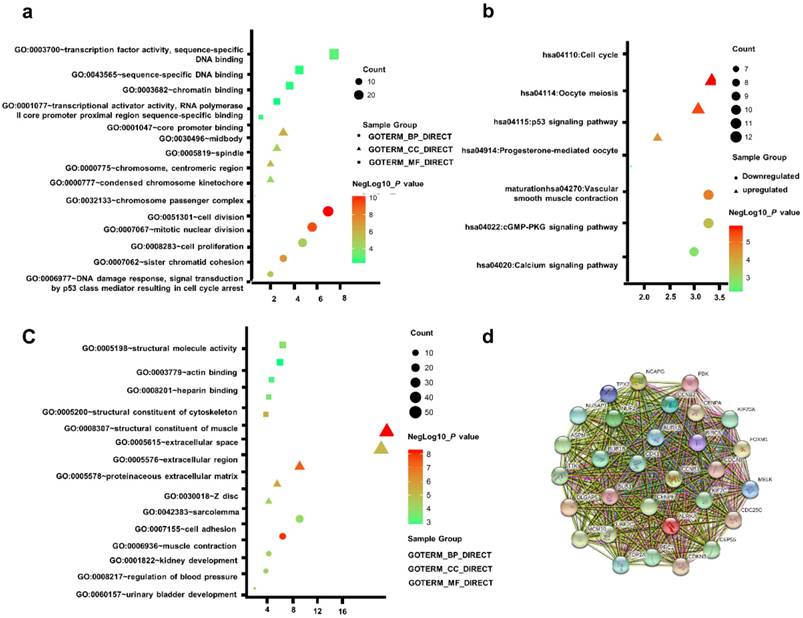
To acquire a more comprehensive and deep understanding of those chosen DEGs, DAVID was used to analyze GO function and KEGG pathway enrichment. The TOP5 gene ontology categories were shown in Table S2. In biological processes (BP), the downregulation DEGs were mainly enriched in muscle contraction; urinary bladder development; kidney development; regulation of blood pressure; Upregulation DEGs were mainly enriched in cell division, mitotic nuclear division, sister chromatid cohesion, DNA damage response, signal transduction by p53 class mediator resulting in cell cycle arrest, and cell proliferation. And in molecular function (MF), the downregulated DEGs were mainly associated with structural constituent of muscle, structural molecule activity. The upregulated DEGs were mainly implicated with transcription factor activity, sequence-specific DNA binding, core promoter binding. In addition, GO cell component (CC) analysis was showed that the downregulated DEGs were principally involving the extracellular space, proteinaceous extracellular matrix, Z disc, extracellular region, sarcolemma, while the upregulated DEGs were mainly enriched in midbody, chromosome, centromeric region, spindle, chromosome passenger complex (Table S2).
Table S3 uncovered the most significant KEGG pathway of the downregulated and upregulated DEGs. The upregulated DEGs were enriched in Cell cycle, Oocyte meiosis, p53 signaling pathway. Figure 2a-c gave a GO and KEGG pathway enrichment plot of PCa.
(a) GO analysis of upregulated DEGs. (b) KEGG pathway of DEGs. (c) GO analysis of downregulated DEGs. (d) The PPI network of the top 15 hub genes.
Hub Genes Screening from the PPI Network
According to the message of the STRING protein query, we built the PPI network of the top 15 hub genes based on the degree of connectivity Figure 2d. The top 15 hub genes were as follows: CDK1, CCNB1, BUB1, CENPA, AURKB, CCNB2, BIRC5, AURKA, BUB1B, TTK, KIF20A, CDKN3, KIF2C, NCAPG and CDCA8. Based on KEGG pathway analysis, this hub genes were enriched in p53 signaling and cell cycle pathway (Table S4).
The Kaplan-Meier survival analysis
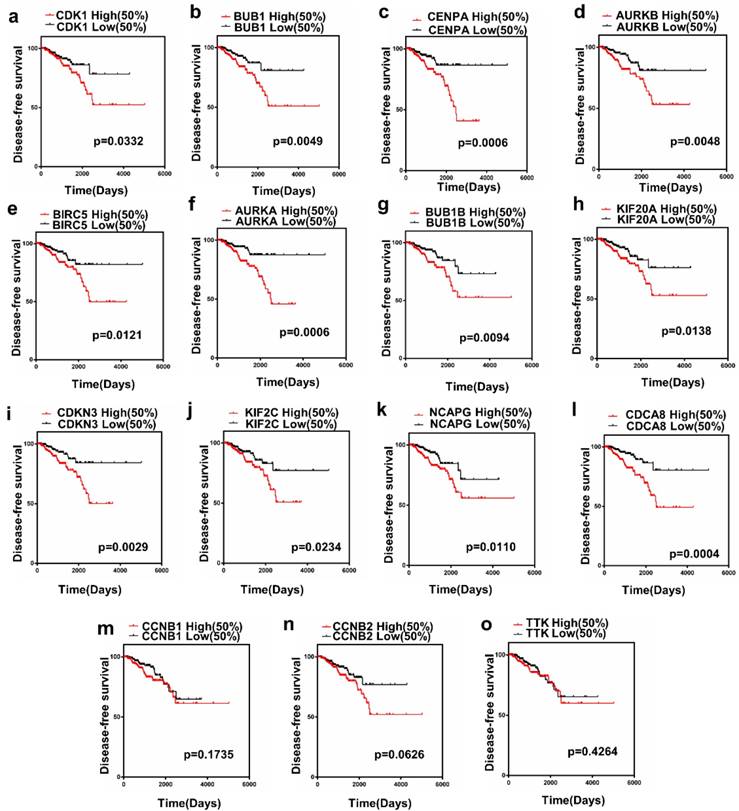
The present study analyzed the association between the top 15 hub gene expression and disease-free survival (DFS) of patients with PCa patients by Kaplan-Meier analysis. The results showed that expression of CDK1 (HR=1.856, log-rank P = 0.0332) was correlated with worse disease-free survival (DFS) for PCa patients, as well as BUB1 (HR=2.342, log-rank P=0.0049), CENPA (HR=2.785, log-rank P=0.0006), AURKB (HR=2.267, log-rank P= 0.0048), BIRC5 (HR=2.086, log-rank P=0.0347), AURKA (HR=2.866, log-rank P = 0.0006), BUB1B (HR=2.116, log-rank P=0.0094), KIF20A(HR=2.060, log-rank P=0.0138), CDKN3(HR=2.451, log-rank P= 0.0029), KIF2C(HR=1.930,log-rankP=0.0234), NCAPG (HR =2.107, log-rank P=0.0110), CDCA8(HR=2.921, log-rank P=0.0004). Only the level of CCNB1 (HR= 1.464, log-rank P=0.1735), CCNB2 (HR=1.697, log- rank P = 0.0626), TTK (HR=1.249, log-rank P=0.4264) had no significant difference on the survival curve of PCa patients (Figure 3a-o).
Prognostic value of 15 genes. (a) CDK1, (b) BUB1, (c) CENPA, (d) AURKB, (e) BIRC5, (f) AURKA, (g) BUB1B, (h) KIF20A, (i) CDKN3, (j) KIF2C, (k) NCAPG, (l) CDCA8, (m) CCNB1, (n) CCNB2 and (o) TTK. P < 0.05 was considered statistically different.
Association with biochemical recurrence and The Expression of Hub Genes
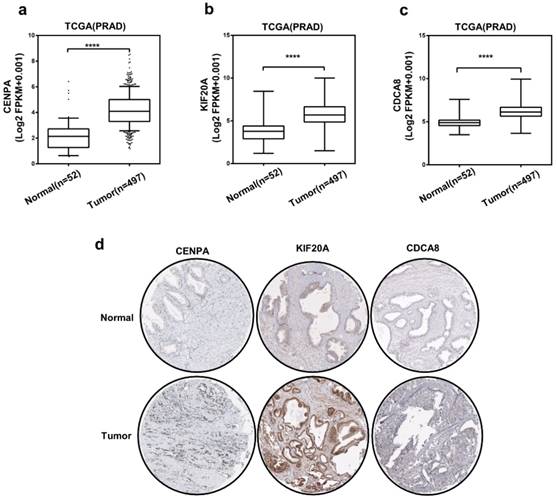
Then, we chose 3 hub genes which were unknown in PCa (Table S1) to evaluate the expression level between prostate tumor and normal tissue using TCGA database. And as shown in Figure 5a-c, compared to normal tissue, the expression level of CENPA, KIF20A and CDCA8 significantly elevated in PCa patients. Subsequently, we detected the expression of them use the immunohistochemical data in the HPA website. The staining pictures verified that the CENPA, KIF20A and CDCA8 in PCa patients exhibited higher expression levels compared with those in normal prostate tissue. Further, the correlation between 3 hub genes and AR was analyzed (Figure 6a-c). After that, we selected KIF20A, more diagnostic value, the most correlation with AR and obvious elevated expression, to operate the further assessment. Finally, the association of the 15 hub genes with PCa BCR was also assessed. All of them was correlated with PCa BCR (Table S5).
The expression of three hub genes (a-c) Expression level of CENPA, KIF20A, and CDCA8 in PCa and normal tissues. Number (T = 497, N = 52); ∗P < 0 05. (d) CENPA, KIF20A, and CDCA8 protein were strongly upregulated in PCa tissues compared with normal prostate tissues according to The Human Protein Atlas database.
The correlation between AR and three hub genes and the relationship between KIF20A with various clinicopathological parameters in PCa (a-c) The correlation between AR and three hub genes in PCa tissues. (N = 498); The high mRNA expression of KIF20A was associated with various clinicopathological factors: (d) Biochemical recurrence, (e) T stage, (f) Lymph lymph node metastasis, (g) PSA value, (h) Gleason score, Gl means Gleason score.
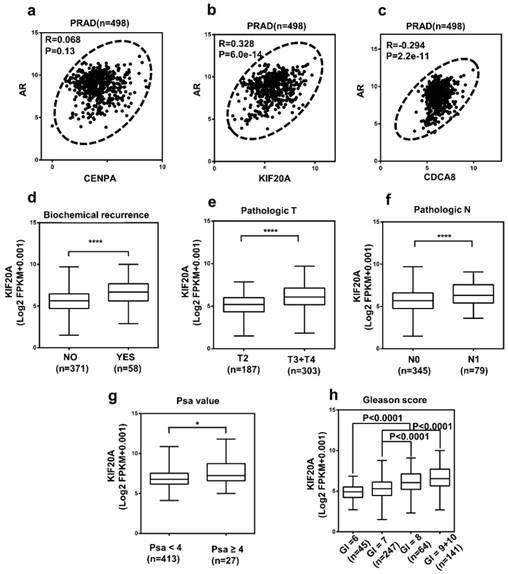
KIF20A expression was correlated with various clinicopathological parameters in PCa
Analysis of the 498 cases contained in the TCGA database revealed that the upregulation of KIF20A expression was significantly associated with higher BCR, pathological T stage, lymph node metastasis, PSA value and gleason score in PCa (Figure 6d-h; Table S6). To investigate the diagnostic value of KIF20A in PCa, ROC curves for clinicopathological parameters were evaluated. The results revealed that the KIF20A mRNA level could discriminate PCa tissues from normal tissues, yielding an AUC of 0.8406 (95% CI: 0.6603 to 0.8256; p < 0.0001) (Figure S1a). In the same way, we also analyzed the diagnostic value of KIF20A in different subgroups according to the clinicopathological parameters of the patients (Figure S1b-f). These data indicated that KIF20A was a potential biomarker for the diagnosis of PCa.
Gene Set Enrichment Analysis
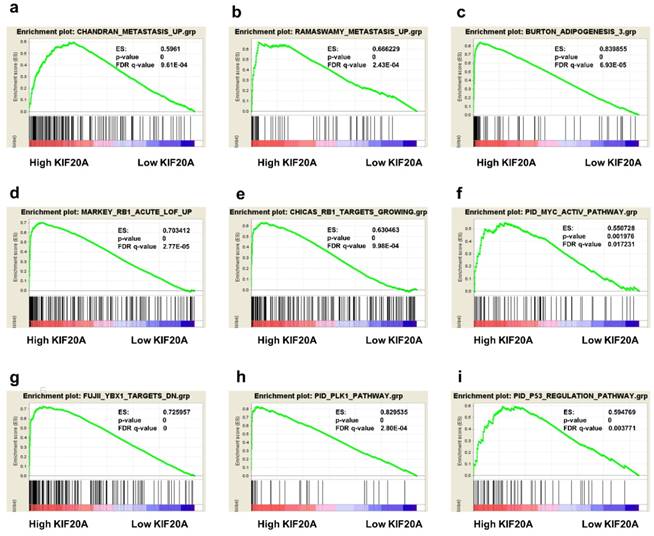
To obtain deeper insight into the function of the KIF20A, GSEA was used to map into KEGG pathways and GO analysis database. 9 functional gene sets associated with metastasis or oncogene pathway were shown, based on the cut-off criteria FDR < 0 05, and gene size ≥ 100, (Figure 7a-i). This result showed that high expression of KIF20A was enriched in CHANDRAN_METASTASIS_UP gene set (genes upregulated in metastatic tumors from the whole panel of patients with prostate cancer, ES=0.5961, p=0, FDR=9.61E-04) and RAMASWAMY_METASTASIS_UP (upregulated genes in metastatic vs primary solid tumors, ES=0.666229, p=0, FDR=2.43E-04). Other gene sets which were important pathway for prostate progression and metastasis were also associated with KIF20A mRNA expression.
Gene set enrichment analysis (GSEA) of KIF20A. 9 representative functional gene sets enriched in PCa with KIF20A highly expressed were listed.
The Receiver Operating Characteristic (ROC) curve analysis of Hub genes
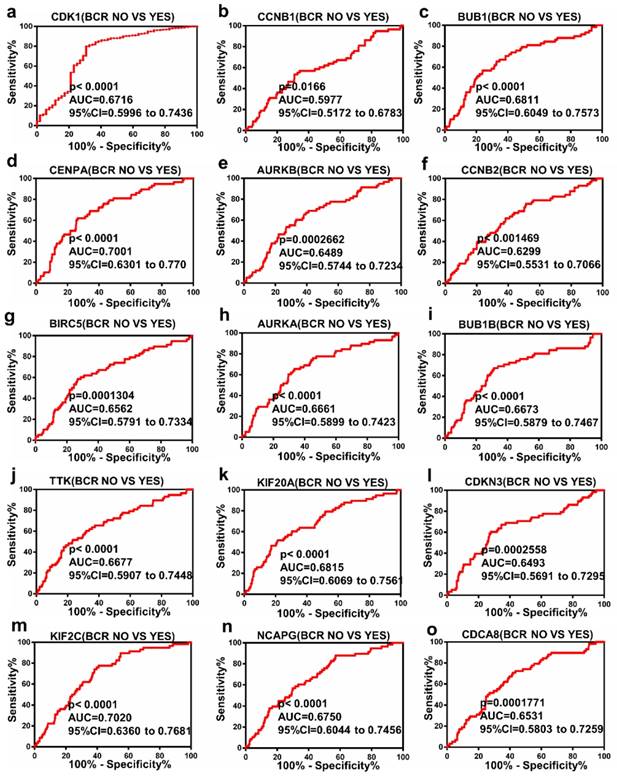
ROC curve analysis was operated with regards to the expression of top 15 hub genes in BCR subgroups of patients with PCa. The results indicated that these hub genes could discriminate BCR patients from no BCR patients with an area under the curve (AUC) of 0.5977 to 0.7020 (Figure 4a-o). The results suggested that the expression of these hub genes may be an effectively diagnostic indicator for patients with PCa BCR.
Diagnostic value of 15 genes for prostate cancer BCR. (a) CDK1, (b) CCNB1, (c) BUB1, (d) CENPA, (e) AURKB, (f) CCNB2, (g) BIRC5, (h) AURKA, (i) BUB1B, (j) TTK, (k) KIF20A, (l) CDKN3, (m) KIF2C, (n) NCAPG and (o) CDCA8 in PCa. P < 0.05 was considered statistically different.
Discussion
Copy number alterations, oncogenic structural DNA rearrangements and recurrent somatic mutations have been confirmed in primary prostate cancer in many studies[20-27]. These contain copy number alterations including PTEN, MYC, CHD1, and RB1; point mutations in SPOP, TP53; and E26 transformation-specific (ETS) fusions, among other biologically related genes. Although the changes or features of some primary prostate cancers have the diagnosis and prognosis clinical significance[28, 29], the prognosis of PCa is still poor. The BCR of prostate cancer is the main cause of death. Thus, specific and sensitive biomarkers for primary and BCR PCa are urgently needed to be found. Our study systematically assessed expression profiling acquired from microarray studies of PCa, which included 13 PCa samples and 6 normal samples from the GEO database of GSE3325. A total of 847 DEGs were obtained including 427 upregulated genes and 420 downregulated genes. To have a better understanding of these DEGs, KEGG pathway and GO function analysis were carried out. The results of functional enrichment analysis suggested that the significant DEGs were related to P53 signaling pathway and cell cycle pathway in PCa. The regulation of cell cycle was an important content and hot issue in the life science study. The core DEGs including CDK1, CCNB1, BUB1, CENPA, CCNB2, BIRC5, AURKA, BUB1B, TTK, KIF20A, CDKN3, KIF2C, NCAPG and CDCA8 were discovered as hub genes in PPI networks. Importantly, some of the DEGs were verified and found associated with tumor stages, metastasis, biochemical recurrence and survival, which indicated these hub genes could not only control cellular process but also confer high value in clinical practice. Although, prostate cancer shares a number of pathways with other cancers such as TP53, TGF-beta pathways, some prominent pathways involving the AR, SPOP, MYC, RB1 and PTEN relevant pathways also play a key role in PCa. In these complicated and comprehensive processes, these hub genes nearly take part in all key cellular pathways considering that they can interact with many proteins. By building the PPI network, the key genes were recognized, which were associated with progression and metastasis of prostate cancer.
PSA has great value in the diagnosis of prostate cancer. It is a prostate cancer biomarker approved by FDA[30]. However, due to the low specificity of PSA in diagnosis, unnecessary biopsies and overtreatment in clinical practice are on the rise[31]. Following prostate normal epithelium progressed to the tumor, the expression of PSA significantly increased. In people older than 60, the production of PSA also increased, which reduced the sensitivity of PSA detection[32]. At the same time, there was no significant correlation between the level of PSA and the severity of prostate cancer[33]. Therefore, exploring new diagnostic markers for prostate cancer still had important clinical significance. In this study, we found that KIF20A could sufficiently discriminate PCa from paired normal tissues with AUC of 0.8406. The diagnostic value of this genes for prostate cancer BCR was also analyzed, suggested that most of these hub gene had novel potential biomarker for predicting diagnosis of patients with BCR. Kaplan-Meier survival analysis was utilized to determine disease- free survival (DFS) according to the expression of top 15 hub genes. The results revealed that high expression of hub genes was correlated with poor DFS and most of them may be considered novel potential prognostic biomarkers in patients with PCa. In accordance with our result, CDK1 has been confirmed upregulation in PCa, predicted biochemical recurrence via androgen receptor phosphorylation at serine 515 and divers AR, ARV7 expression [34-36]. It was also reported that AURKA could transfer prostate cancer to lethal neuroendocrine prostate cancer (NEPC). Inhibition of the N-Myc/AURKA Feed- Forward loop in NEPC induced tumor cell death[37-39]. Some other hub genes were reported enhancing PCa cell proliferation or progression (Table S1). Except for the previously studied key genes, there are also some hub genes not reported in PCa before, like CENPA, KIF20A, CDCA8.We found that these three genes were all overexpression in prostate cancer tissues compared with normal tissues. As we known, this study was the first reported that they were upregulated in PCa and associated with DFS of prostate cancer patients. Then, based on more diagnostic value, the most correlation with AR and obvious elevated expression, we selected KIF20A to determine the further assessment. The present study indicated that KIF20A expression levels tended to elevate with increasing tumor gleason score, PSA value, T stage and the expression was also associated with lymph node metastasis and BCR.
In our study, the expression of KIF20A may be associated with BCR and metastasis, so we focused our attention on the GSEA functional gene sets correlated with progression and metastasis of Pca. We selected annotated gene sets c2.cp.kegg.v5.2. symbols.gmt as the reference gene sets. FDR < 0 05and gene size ≥ 100 were considered as the cut-off criteria. RB1, MYC, P53, PLK1 and YBX1, most frequently aberrant genes in prostate cancer, contributed to the progression and metastasis of PCa[40-49]. Our finding displayed that high expression of KIF20A was enriched in these pathway and metastasis gene set of prostate cancer.
Recently study had reported that KIF20A may promote a transition from proliferative to differentiative divisions of neural progenitor cells. While, Neuroendocrine differentiation of prostate cancer was closely related to metastasis and ADT treatment tolerance in prostate cancer patients. Lots of molecular mechanisms, such as loss of tumor suppressors, like p53 and RB1, amplification of MYCN promote the progression of CRPC to NEPC. Our study suggested that the expression of KIF20A may be associated with neuroendocrine differentiation in prostate cancer. All the results indicated that KIF20A may contribute to the progression, biochemical recurrence and metastasis of prostate cancer. To the best of our knowledge, the current study is the first research evaluating the functional role of KIF20A in PCa tumorigenesis and progression. Unlike previous literature, the value of these 15 genes in the prognosis and diagnosis of biochemical recurrence in prostate cancer was systematically analyzed. Furthermore, the expression of three genes that were not studied in prostate cancer was evaluated. In addition, the possible mechanism of KIF20A in prostate cancer was also analyzed. However, the exact mechanisms and in-depth pathways of these hub genes should be explored by experiments in the future. Core genes in distinct periods like metastatic CRPC need for deeper investigation. In conclusion, the hub genes regulatory network may provide an opportunity to discover potential targets for new drug treatment and development. By utilizing the bioinformatic analysis on hub genes and regulatory pathways, we may obtain important and novel potential targets in the tumor-genesis, prognosis, recurrence, diagnosis, metastasis and key mechanisms in prostate cancer.
Supplementary Material
Supplementary figures and tables.
Acknowledgements
This study was supported by grants from the National Natural Science Foundation of China (grant nos. 81672524 and 81672528), the Clinical Research Physician Program of Tongji Medical College, Huazhong University of Science and Technology (grant no. 5001530015) and the Independent innovation foundation of Huazhong University of Science and Technology (grant no. 118530309).
Competing Interests
The authors have declared that no competing interest exists.
References
1. Chang C C, Lee Y C, Tsai H W. et al. Diagnostic Role of Serum Free-to-Total Prostate Specific Antigen (PSA) Ratio in Prostate Cancer with Serum Total Concentration of PSA below 4 ng/mL. Asian Pac J Cancer Prev. 2015;16(13):5261-5264
2. Ferlay J, Soerjomataram I, Dikshit R. et al. Cancer incidence and mortality worldwide: sources, methods and major patterns in GLOBOCAN 2012. Int J Cancer. 2015;136(5):E359-E386
3. Koo K C, Park S U, Kim K H. et al. Predictors of survival in prostate cancer patients with bone metastasis and extremely high prostate-specific antigen levels. Prostate Int. 2015;3(1):10-15
4. Liu M, Xu Z, Du Z. et al. The Identification of Key Genes and Pathways in Glioma by Bioinformatics Analysis. J Immunol Res. 2017;2017:1278081
5. Sun C, Yuan Q, Wu D. et al. Identification of core genes and outcome in gastric cancer using bioinformatics analysis. Oncotarget. 2017;8(41):70271-70280
6. Chen L, Yuan L, Wang Y. et al. Co-expression network analysis identified FCER1G in association with progression and prognosis in human clear cell renal cell carcinoma. Int J Biol Sci. 2017;13(11):1361-1372
7. Wang Z, Jensen M A, Zenklusen J C. A Practical Guide to The Cancer Genome Atlas (TCGA). Methods Mol Biol. 2016;1418:111-141
8. Echard A, Jollivet F, Martinez O. et al. Interaction of a Golgi-associated kinesin-like protein with Rab6. Science. 1998;279(5350):580-585
9. Hill E, Clarke M, Barr F A. The Rab6-binding kinesin, Rab6-KIFL, is required for cytokinesis. EMBO J. 2000;19(21):5711-5719
10. Taniuchi K, Furihata M, Saibara T. KIF20A-mediated RNA granule transport system promotes the invasiveness of pancreatic cancer cells. Neoplasia. 2014;16(12):1082-1093
11. Liu S L, Lin H X, Qiu F. et al. Overexpression of Kinesin Family Member 20A Correlates with Disease Progression and Poor Prognosis in Human Nasopharyngeal Cancer: A Retrospective Analysis of 105 Patients. PLoS One. 2017;12(1):e169280
12. Khongkow P, Gomes A R, Gong C. et al. Paclitaxel targets FOXM1 to regulate KIF20A in mitotic catastrophe and breast cancer paclitaxel resistance. Oncogene. 2016;35(8):990-1002
13. Gasnereau I, Boissan M, Margall-Ducos G. et al. KIF20A mRNA and its product MKlp2 are increased during hepatocyte proliferation and hepatocarcinogenesis. Am J Pathol. 2012;180(1):131-140
14. Ward A, Balwierz A, Zhang J D. et al. Re-expression of microRNA-375 reverses both tamoxifen resistance and accompanying EMT-like properties in breast cancer. Oncogene. 2013;32(9):1173-1182
15. Luo S, Cao N, Tang Y. et al. Identification of key microRNAs and genes in preeclampsia by bioinformatics analysis. PLoS One. 2017;12(6):e178549
16. Gaudet P, Skunca N, Hu J C. et al. Primer on the Gene Ontology. Methods Mol Biol. 2017;1446:25-37
17. Kanehisa M. The KEGG database. Novartis Found Symp. 2002;247:91-101 101-103, 119-128, 244-252
18. Szklarczyk D, Franceschini A, Wyder S. et al. STRING v10: protein-protein interaction networks, integrated over the tree of life. Nucleic Acids Res. 2015;43(Database issue):D447-D452
19. Uhlen M, Zhang C, Lee S. et al. A pathology atlas of the human cancer transcriptome. Science. 2017:357 (6352)
20. Baca S C, Prandi D, Lawrence M S. et al. Punctuated evolution of prostate cancer genomes. Cell. 2013;153(3):666-677
21. Barbieri C E, Baca S C, Lawrence M S. et al. Exome sequencing identifies recurrent SPOP, FOXA1 and MED12 mutations in prostate cancer. Nat Genet. 2012;44(6):685-689
22. Berger M F, Lawrence M S, Demichelis F. et al. The genomic complexity of primary human prostate cancer. Nature. 2011;470(7333):214-220
23. Cooper C S, Eeles R, Wedge D C. et al. Analysis of the genetic phylogeny of multifocal prostate cancer identifies multiple independent clonal expansions in neoplastic and morphologically normal prostate tissue. Nat Genet. 2015;47(4):367-372
24. Pflueger D, Terry S, Sboner A. et al. Discovery of non-ETS gene fusions in human prostate cancer using next-generation RNA sequencing. Genome Res. 2011;21(1):56-67
25. Taylor B S, Schultz N, Hieronymus H. et al. Integrative genomic profiling of human prostate cancer. Cancer Cell. 2010;18(1):11-22
26. Tomlins S A, Laxman B, Dhanasekaran S M. et al. Distinct classes of chromosomal rearrangements create oncogenic ETS gene fusions in prostate cancer. Nature. 2007;448(7153):595-599
27. Wang X S, Shankar S, Dhanasekaran S M. et al. Characterization of KRAS rearrangements in metastatic prostate cancer. Cancer Discov. 2011;1(1):35-43
28. Hieronymus H, Schultz N, Gopalan A. et al. Copy number alteration burden predicts prostate cancer relapse. Proc Natl Acad Sci U S A. 2014;111(30):11139-11144
29. Lalonde E, Ishkanian A S, Sykes J. et al. Tumour genomic and microenvironmental heterogeneity for integrated prediction of 5-year biochemical recurrence of prostate cancer: a retrospective cohort study. Lancet Oncol. 2014;15(13):1521-1532
30. Rittenhouse H G, Finlay J A, Mikolajczyk S D. et al. Human Kallikrein 2 (hK2) and prostate-specific antigen (PSA): two closely related, but distinct, kallikreins in the prostate. Crit Rev Clin Lab Sci. 1998;35(4):275-368
31. Schroder F H, Hugosson J, Roobol M J. et al. Screening and prostate-cancer mortality in a randomized European study. N Engl J Med. 2009;360(13):1320-1328
32. Bassler T J, Orozco R, Bassler I C. et al. Most prostate cancers missed by raising the upper limit of normal prostate-specific antigen for men in their sixties are clinically significant. Urology. 1998;52(6):1064-1069
33. Cooperberg M R, Broering J M, Carroll P R. Time trends and local variation in primary treatment of localized prostate cancer. J Clin Oncol. 2010;28(7):1117-1123
34. Willder J M, Heng S J, Mccall P. et al. Androgen receptor phosphorylation at serine 515 by Cdk1 predicts biochemical relapse in prostate cancer patients. Br J Cancer. 2013;108(1):139-148
35. Sarwar M, Semenas J, Miftakhova R. et al. Targeted suppression of AR-V7 using PIP5K1alpha inhibitor overcomes enzalutamide resistance in prostate cancer cells. Oncotarget. 2016;7(39):63065-63081
36. Liu X, Gao Y, Ye H. et al. Positive feedback loop mediated by protein phosphatase 1alpha mobilization of P-TEFb and basal CDK1 drives androgen receptor in prostate cancer. Nucleic Acids Res. 2017;45(7):3738-3751
37. Lee J K, Phillips J W, Smith B A. et al. N-Myc Drives Neuroendocrine Prostate Cancer Initiated from Human Prostate Epithelial Cells. Cancer Cell. 2016;29(4):536-547
38. Beltran H, Rickman D S, Park K. et al. Molecular characterization of neuroendocrine prostate cancer and identification of new drug targets. Cancer Discov. 2011;1(6):487-495
39. Beltran H, Park K, Tagawa S T. et al. Association of concurrent AURKA and MYCN amplification in primary prostate adenocarcinoma with the development of lethal neuroendocrine prostate cancer (NEPC). Journal of Clinical Oncology. 2012;30(5_suppl):120
40. Espiritu S, Liu L Y, Rubanova Y. et al. The Evolutionary Landscape of Localized Prostate Cancers Drives Clinical Aggression. Cell. 2018;173(4):1003-1013
41. Ku S Y, Rosario S, Wang Y. et al. Rb1 and Trp53 cooperate to suppress prostate cancer lineage plasticity, metastasis, and antiandrogen resistance. Science. 2017;355(6320):78-83
42. Pandha H S, Protheroe A, Wylie J. et al. An open label phase II trial of BI 2536, a novel Plk1 inhibitor, in patients with metastatic hormone refractory prostate cancer (HRPC). Journal of Clinical Oncology. 2008;26(15):431-436
43. Mao F, Li J, Luo Q. et al. Plk1 Inhibition Enhances the Efficacy of BET Epigenetic Reader Blockade in Castration-Resistant Prostate Cancer. Mol Cancer Ther. 2018;17(7):1554-1565
44. Zhang Z, Hou X, Shao C. et al. Plk1 inhibition enhances the efficacy of androgen signaling blockade in castration-resistant prostate cancer. Cancer Res. 2014;74(22):6635-6647
45. Quigley D A, Dang H X, Zhao S G. et al. Genomic Hallmarks and Structural Variation in Metastatic Prostate Cancer. Cell. 2018;174(3):758-769
46. Dardenne E, Beltran H, Benelli M. et al. N-Myc Induces an EZH2-Mediated Transcriptional Program Driving Neuroendocrine Prostate Cancer. Cancer Cell. 2016;30(4):563-577
47. Benassi B, Flavin R, Marchionni L. et al. MYC is activated by USP2a-mediated modulation of microRNAs in prostate cancer. Cancer Discov. 2012;2(3):236-247
48. Shiota M, Fujimoto N, Imada K. et al. Potential Role for YB-1 in Castration-Resistant Prostate Cancer and Resistance to Enzalutamide Through the Androgen Receptor V7. J Natl Cancer Inst. 2016:108 (7)
49. Imada K, Shiota M, Kohashi K. et al. Mutual regulation between Raf/MEK/ERK signaling and Y-box-binding protein-1 promotes prostate cancer progression. Clin Cancer Res. 2013;19(17):4638-4650
Author contact
![]() Corresponding authors: Professor Ke Chen or Professor Xiaoping Zhang, Department of Urology, Union Hospital, Tongji Medical College, Huazhong University of Science and Technology, 1277 Jiefang Avenue, Wuhan, Hubei 430022, P.R. China. E-mail: shenkeedu.cn. E-mail: xzhangedu.cn
Corresponding authors: Professor Ke Chen or Professor Xiaoping Zhang, Department of Urology, Union Hospital, Tongji Medical College, Huazhong University of Science and Technology, 1277 Jiefang Avenue, Wuhan, Hubei 430022, P.R. China. E-mail: shenkeedu.cn. E-mail: xzhangedu.cn