Impact Factor ISSN: 1837-9664

 Global reach, higher impact
J Cancer 2019; 10(6):1434-1443. doi:10.7150/jca.28317 This issue Cite
Research Paper
High Expression of Human AugminComplex Submit 3 Indicates Poor Prognosis and Associates with Tumor Progression in Hepatocellular Carcinoma
Xuanyu Zhang1,2*, Runzhou Zhuang1,2*, Qianwei Ye1,2, Jianyong Zhuo1,2, Kangchen Chen1,2, Di Lu1,2, Xuyong Wei1,2, Haiyang Xie1,2, Xiao Xu1,2 ![]() , Shusen Zheng1,2
, Shusen Zheng1,2 ![]()
1. Division of Hepatobiliary and Pancreatic Surgery, Department of Surgery, First Affiliated Hospital, School of Medicine, Zhejiang University, Zhejiang Province, Hangzhou 310003,China
2. NHFPC Key Laboratory of Combined Multi-organ Transplantation, Zhejiang Province, Hangzhou 310003, China
*Xuanyu Zhang and Runzhou Zhang contributed equally to this work.
Received 2018-7-5; Accepted 2019-1-28; Published 2019-2-23
Abstract
The function of human augmin complex unit 3(Haus3), a component of the HAU augmin-like complex, in various cancers is not clear. This study aims to elucidate the clinical significance and the role of Haus3 in tumor progression of hepatocellular carcinoma (HCC). We analyzed the expression of Haus3 in 50 HCC patients from The Cancer Genome Atlas and 137 HCC patients in our hospital. Compared with adjacent normal tissue, Haus3 expression assessed by immunohistochemical staining was dramatically increased in tumor tissues. A high level of Haus3 expression was significantly correlated with large tumor size (p=0.025) and tumor multiplicity (p=0.004). Univariate and multivariate survival analysis showed thatexpression of Haus3 was an independent prognostic factor for overall survival ofHCCpatients. Western blot analysis showed that Haus3 regulated the phosphorylation of PLK1-T210 and activity of the Cdk1/cyclin B1 complex, indicating that Haus3 disrupted G2/M phase arrest. In immunofluorescence studies, expression of Haus3 correlated with the level ofα-tubulin and γ-tubulin. In summary, Haus3 plays a vital role in regulatingtheactivityof PLK2-T210 and Cdk1/cyclin B1 complex in G2/M phasetransition and the expression of tubulins to ensure normal mitotic progression. Our data suggest that Haus3 might be a promising prognostic biomarker and molecular target of HCC.
Keywords: Haus3, G2/M arrest, HCC, PLK1, Cdk1/cyclin B1 complex
Introduction
Hepatocellular carcinoma (HCC) is the 5th leading cause of cancer death in males worldwide [1]. In China, HCC is the 4th most prevalent neoplasm and is ranked 3rd for cancer mortality[2]; however, before the age of 60 liver cancer is the leading cause of cancer in men and the most commonly diagnosed cancer[2]. Haus3 was reported prevalent mutated in breast cancer[3]and remained in the metastatic cancer nine years later[4]. It indicated Haus3 may play a vital role in the carcinogenesis in breast cancer, but it has never been reported in HCC. Haus3 contributes to the maintenance of centrosome integrity and completion of cytokinesis as part of the HAUS augmin-like complex [5, 6]. Current studies show that the main function of the HAUS augmin-like complex is regulating mitotic spindle formation [7-12]. However, the clinical significance and the role of Haus3 in regulating cell cycle progression of HCC are not clear.
Evasion of growth suppressors was reported as a hallmark of cancer, and one of the main mechanisms is proposed to be loss of a critical gatekeeper of cell-cycle progression whose absence permits persistent cell proliferation[13]. Either deficiency of a tumor suppressor or increased expression of a tumor promoter would cause this effect [14]. PLK1 is the most ancestral and best studied of the four polo-like kinase (PLK) family members. It is a Ser/Thr kinase that plays central roles in several biological processes and performs many different functions in a cell cycle-dependent manner [15, 16], most of which are attributed to the mitotic phase. PLK1 is overexpressed in a variety of solid tumors and malignancies in the context of tumor progression [17, 18]. Cancer cells were shown to be more sensitive to PLK1 inhibition than normal cells, making regulating PLK1 a highly attractive target for cancer intervention [19, 20].
The cyclin-dependent kinases (CDKs) are master regulators of the cell cycle and are thought to play central roles in growth control during the cell cycle. Cdk1 is a highly conserved protein that functions as a serine/threonine kinase and is a key player in cell cycle regulation [21,22]. The G2/M transition in the cell cycle is positively controlled by the Cdk1/cyclin B1 complex. In normal cells, the Cdk1/cyclin B1 complex remains inactive until the end of G2 phases a result of inhibitory phosphorylation of CDK1[21, 22].
In this study we first discuss the clinical significance in HCC patients in our center and TCGA HCC mRNA-seq dataset. Then we specifically regulated the expression of Haus3 with the aim of determining the mechanism by which it regulates the cell cycle in HCC. Our findings implicated Haus3 functioned as an oncogene and it might be a potential prognostic biomarker for HCC.
Materials and Methods
Patients
We analyzed Haus3 mRNA expression level using RNA-Seq data for 50 pairs of HCC tissues and non-tumor tissues generated by The Cancer Genome Atlas-Liver Hepatocellular Carcinoma (TCGA-LIHC). To further validate the results, 137 patients with primary HCC who received hepatectomy from December 2013 to December 2014 in First Affiliated Hospital of Zhejiang University were collected; patients who received transarterial chemoembolization (TACE) or chemotherapy were excluded. All patients provided written informed consent and the study protocol was in accordance with the revised Helsinki Declaration of 1983. The study was approved by the Ethical Committee at the First Affiliated Hospital, Zhejiang University School of Medicine.
Xenograft experiments
Eight nude mice were divided into two groups. SMMC-7721-shNC control cells or SMMC-7721-shHaus3 cells with stable knockdown of Haus3 were injected subcutaneously into the right upper flank region of nude mice (1 × 10⁶ per mouse). The mice were monitored every 3 days for tumor size. Tumor volume was calculated by the equation: V= (long*(width/2)2) /2 [23]. Approximately 3 weeks after injection, all mice were sacrificed and the tumors were dissected. Mice were fed standard laboratory chow and water ad libitum and kept in accordance with the Guide for the Care and Use of Laboratory Animals of Zhejiang University. Animal procedures were previously approved by the Ethical Committee at the First Affiliated Hospital, Zhejiang University School of Medicine.
Tissue microarray and immunohistochemistry
Tissue samples were collected from resected samples during the operation. After screening of hematoxylin and eosin-stained slides for optimal tumor content, we constructed tissue microarray slides (HK Bio technology). Duplicate 1-mm cores for tumor tissue and adjacent tumor tissue were taken from different areas of the same tissue block for each patient. Serial sections (4 μm thick) were placed on slides coated with 3-aminopropyltriethoxysilane. Immunohistochemistry (IHC) for Haus3 was performed by using the avidin-biotin complex method (ABC; Vector Laboratories) including heat-induced antigen-retrieval procedures. Incubation with polyclonal antibodies against Haus3 (1:100 dilution; Sigma-Aldrich) was carried out at 4°C for 24 hours.
Quantitative scoring methods were used for analysis of IHC, including the score for the number of positive cells and the score for intensity of staining, Quantitative score (Q) = Positive cells (P) × Intensity (I); maximum score = 9, Scores from 0-4 were included in the low expression group; scores from 6-9 were included in the high expression group[24].
Cell culture and transfection
SMMC-7721, Bel-7402, SK-HEP-1, Hep G2, and Hep 3B2.1-7 cells were purchased from National Infrastructure of Cell Line Resource. HCC-LM3 was purchased from China Center for Type Culture Collection (CCTCC). Cells were cultured in Dulbecco's modified Eagle's medium (DMEM, Gibco) and MEM Non-Essential Amino Acids Solution (Gibco) with 10% fetal bovine serum (Gibco) in a humidified, 5% CO2 atmosphere at 37°C. Transient transfection of cells line was performed using lipofectamine 2000 (Thermo Fisher Scientific), Stable transfection was performed with lentivirus according to the manufacturer's instructions (Genechem Co. LTD).
Cell cycle analysis by flow cytometry
Cells were collected from dishes by trypsinization, centrifuged, and fixed with 75% ethanol for 24 h. Cells were then washed three times with phosphate buffer saline (PBS), treated with 20 μg/mL RNase and 50 μg/mL propidium iodide (PI) at room temperature for 20 min in the dark, and analyzed on a FACScan flow cytometer (LSR II, BD). The cell cycle distribution (G1, S, G2/M phase) of 10,000 cells was analyzed by ModFit 3.1 software.
Protein extraction and western blot analysis
Cells were harvested and washed twice with cold PBS. Collected cells were lysed with RIPA lysis buffer (Goodbio technology CO. LTD) containing a protease inhibitor cocktail (Sigma-Aldrich). Tissues were crushed by pestle and mortal, then add RIPA with protease inhibitor cotial and pipet up and down several times. Transfer the lysate to pre-chilled 1.5 ml Eppendorf tubes on ice. Lysis on ice for 30 min. Then centrifugation at 15000g for 20 min. Supernatant proteins were preserved and quantitated using BCA protein assay kit (Thermo scientific, USA).
Similar amounts of proteins were loaded onto a gel (Life Technology), separated by SDS-PAGE gel electrophoresis, and transferred to a PVDF membrane (Bio-Rad). The membrane was blocked with TBST (0.05% Tween 20 in TBS) containing 5% skim milk (BD) and then incubated overnight with the Haus3 antibody (ab170808, abcam, USA)at 4°C. The membrane was washed three times in TBST for 10 min and then incubated with an HRP-conjugated secondary antibody (Pierce) (1:5000) for 1 h at room temperature. Immunocomplexes were detected using chemiluminescence (Pierce). Grey value was calculated by Image Lab 5.0 software, all results were performed for three times.
RNA extraction and real-time PCR
Cells were washed by PBS and 1ml/ 3.5cm diameter well, tissues were crushed by pestle and mortal, then add 2ml/ 1g Trizol (Introvergen). Total RNA was extracted from tissues or cells, according to the manufacturer's instructions. Reverse-transcription PCR (RT-PCR) was carried out with the Prime-Script RT Reagent Kit (Bio-Rad). Expression levels of the genes were determined by real-time quantitative PCR and normalized against an endogenous control GAPDH using SYBR supermix (Bio-Rad). Data were analyzed using a ΔΔCq approach.
Immunofluorescence
Cells grown on coverslips were fixed with 4% paraformaldehyde solution for 15 min at room temperature and then permeabilized with 0.5% Triton X-100 for 5 min. After three washes with PBS, cells were blocked with 3% bovine serum albumin at room temperature for 30 min and then incubated with primary antibodies for 1 h at room temperature. Cells were washed three times with PBS before incubation with fluorescence-labeled secondary antibodies. Cells were washed three more times, mounted on slides with Prolong Gold Anti-fade (Life Technologies), and examined using a Nikon Ai Ti laser scanning confocal microscope (Nikon).
Statistical analysis
Experiments were performed at least three times. The results were expressed as the mean and the standard error of the mean (SEM). Student's t-test (two-tailed) was used to compare the differences between two groups. A chi-squared (χ2) test was used to evaluate the association between Haus3 expression and clinical pathological parameters. Overall survival rates were determined using the Kaplan-Meier method (Breslow test). P values <0.05 were considered significant. All statistical analyses were performed using IBM SPSS Statistics 17.0 software.
Results
High level of Haus3 in HCC tissues significantly correlated with poor prognosis of patients
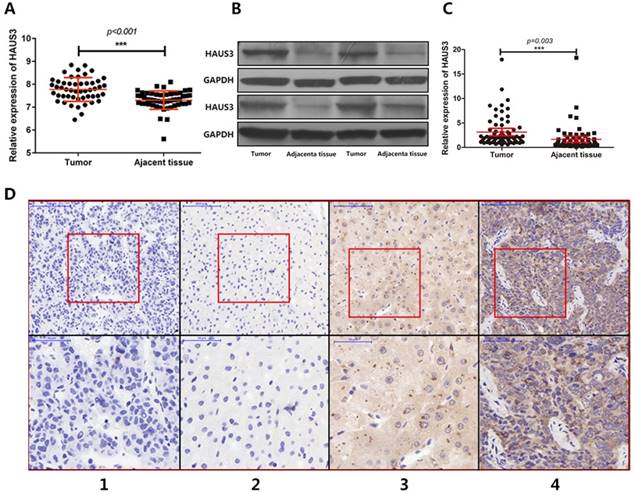
Analysis of RNA-Seq data generated by The Cancer Genome Atlas-Liver Hepatocellular Carcinoma (TCGA-LIHC) showed that Haus3 was highly expressed in HCC tissue (Figure 1A). To identify the role of Haus3 in the progression of HCC, we collected 137 paired primary HCC tissues and adjacent tissues from patients in our hospital and performed western blotting and quantitative real-time PCR to examine the expression of Haus3. Compared with adjacent non-tumor tissues, the protein level and mRNA level of Haus3 were upregulated in HCC tissues (Figure 1B, C). Furthermore, we generated a tissue array and used immunohistochemical staining to confirm the protein levels of Haus3 in HCC tissues compared with matched adjacent tissues (Figure 1D).
The expression of Haus3 was up-regulated in HCC. A. 50 pairs of HCC mRNA data from TCGA-LIHC showed Haus3 was up-regulated in HCC tissue. B, C. The expression level of Haus3 was evaluated by using western blot and quantitative real-time PCR in 137 HCC tissues and matched adjacent tissues. D1~Dd4. Representative cases of intensity of staining (negative, weak staining, moderate staining and strong straining) ranging from score 0~3, magnification in upper pictures is 100×, the red box area were showed in lower pictures in magnification 200x.
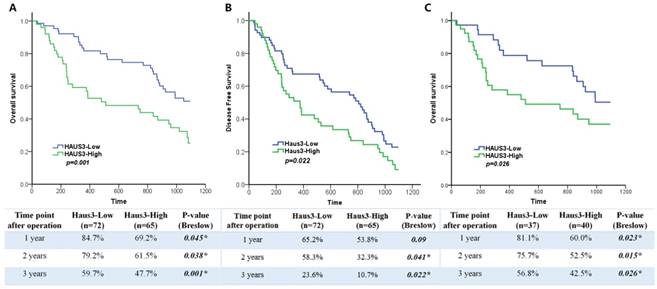
Because Haus3 was highly expressed in HCC tissues, we used quantitative scoring methods to analyze the clinical pathological significance of Haus3 expression in HCC. According to IHC score, 137 patients were divided into a Haus3 low expression group (n=72) and high expression group (n=65). Correlation analysis showed that a high level of Haus3 expression was associated with larger tumor size (tumor diameter <5 cm vs. >5 cm, p=0.025) and a greater number of cancer lesions (p=0.004) (Table 1). Other clinical parameters showed no statistical difference between the two groups. In addition, evaluation of the relationship between the level of Haus3 and HCC risk showed that high Haus3 expression correlated with a shorter survival time (p=0.001, Figure 2A), and also correlated with a shorter disease free time (p=0.022, Figure 2B). Furthermore, univariate and multivariate Coxproportional hazards regression analysis identified high Haus3 expression and AFP ≥ 20 ng/ml as independent risk factors for OS (Table 2). As AFP ≥20 ng/ml was a strong prognostic factor in this cohort, we divided the cohort into two groups of AFP <20 ng/ml (n=60) and ≥20 ng/ml (n=77). Within the AFP ≥20 ng/ml group, the high Haus3 subgroup showed a poor prognosis at 1, 2, and 3 years postoperative (p=0.023, 0.015, 0.026, respectively; Figure 2C).
Correlation between Haus3 and clinicopathologic parameters
| Parameters | Haus3 Low cases | Haus3 High cases | p value2 | |
|---|---|---|---|---|
| Age | ≥ 60 | 27 | 27 | 0.629 |
| <60 | 45 | 38 | ||
| Gender | Female | 10 | 11 | 0.623 |
| Male | 62 | 54 | ||
| Recurrence | Newly onset | 40 | 34 | 0.734 |
| Recurrence | 32 | 31 | ||
| Tumor | ≥ 5cm | 33 | 43 | 0.025* |
| <5cm | 39 | 22 | ||
| Multiplicity | Single | 65 | 46 | 0.004* |
| Multiple | 7 | 19 | ||
| HBV | Positive | 29 | 31 | 0.395 |
| Negative | 43 | 34 | ||
| Serum AFP | ≥ 20 ng ml-1 | 37 | 40 | 0.301 |
| <20 ng ml-1 | 35 | 25 | ||
| Serum CA19-9 | ≥ 40 ng ml-1 | 37 | 26 | 0.230 |
| <40 ng ml-1 | 35 | 39 | ||
| Child-Pugh score | B | 17 | 14 | 0.839 |
| A | 55 | 51 | ||
| Cirrhosis | Yes | 46 | 46 | 0.467 |
| No | 26 | 19 | ||
| Vascular invasion | Positive | 30 | 32 | 0.374 |
| Negative | 42 | 33 | ||
| Tumor grade | Mod | 34 | 30 | 0.900 |
| Poor | 38 | 35 |
High Haus3 expression indicated poor prognosis in HCC patients. A. Kaplan-Meier analysis of OS for the expression of Haus3 in HCC patients (n=137). Breslow tests were used to determine statistical significance. B. Kaplan-Meier analysis of DFS for the expression of Haus3. p=0.022. C. Kaplan-Meier analysis of OS for the expression of Haus3 in HCC patients with AFP≥20 ng/ml (n=77). The lower table showed the 1-3 year survival rate and p value in3 groups.
Univariate and multivariate analysis of demographic and baseline characteristics for overall survival
| Univariate | p value | Multivariate | ||||
|---|---|---|---|---|---|---|
| Parameters | HR | (95%CI) | HR | (95%CI) | p value | |
| Age(<60 vs. ≥60) | 0.816 | (0.407-1.633) | 0.565 | |||
| Gender (male vs. female) | 1.530 | (0.705-3.321) | 0.282 | |||
| AFP(≥20 vs. <20 ng mL-1) | 1.649 | (1.033-2.765) | 0.048 | 1.953 | (1.153-3.309) | 0.013 |
| Haus3(high vs. low) | 2.131 | (1.289-3.520) | 0.003 | 1.814 | (1.184-3.223) | 0.042 |
| Tumor Size(<5cm vs. ≥5cm) | 1.285 | (0.683-2.420) | 0.437 | |||
| Recurrence | 1.572 | (0.840-2.944) | 0.157 | |||
| TNM grade(III+IV vs. I+II) | 2.093 | (1.268-3.453) | 0.004 | 1.75 | (0.989-3.097) | 0.55 |
These data suggested that Haus3 overexpression was a frequent event in human HCC tissues and was related to a poor prognosis.
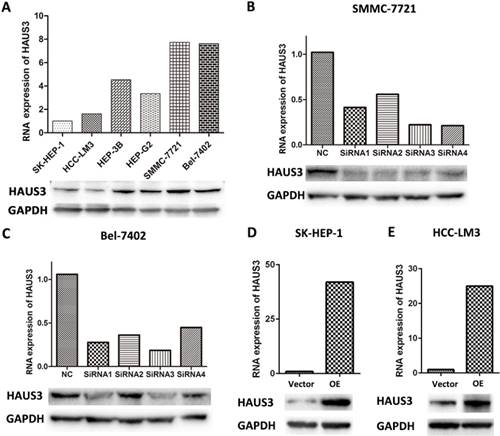
Western blot and RT-PCR analysis of Haus3 modification. A. Expression of Haus3 in HCC cell lines. B, C. Knockdown efficiency of Haus3 in SMMC-7721 and Bel-7402 cell lines. D, E. Overexpression efficiency of Haus3 in SMMC-7721 and Bel-7402 cell line.
Downregulation of Haus3 caused G2/M arrest and inhibited tumor growth in vitro and in vivo
To investigate the function of Haus3 in HCC, six human HCC cell lines were examined using real-time PCR and western blot analysis. SMMC-7721 and Bel-7402 cells showed high expression of Haus3 at both mRNA and protein level (Figure. 3A). These two cell lines were used to establish Haus3 knockdown and overexpression cell lines, and the efficiency of overexpression was validated (Figure. 3B, C). Four siRNAs were designed for Haus3 knockdown and siRNA 1 was selectedto synthesize shRNA, which were used for stable knockdown Haus3 in SMMC-7721 and Bel-7402 using lenti-viral infection (Figure. 3D, E).
The effect of Haus3 knockdown and overexpression on cell cycle distribution was determined with flow cytometry. FACS analysis revealed that Haus3 overexpression decreased the percentage of cells in G2/M for both SK-Hep-1and HCC-LM3 (p<0.001, p<0.001), whereasHaus3 knockdown significantly increased the percentage of cells in the G2/M phase in SMMC-7721 and Bel-7402. (p=0.003, p<0.001) (Figure 4A-D).
The level of Haus3 regulated the G2/M phase transition in HCC cells. A. Representative result of cell cycle distributions measured by flow cytometry with propidium iodide staining in SK-Hep-1 and HCC-LM3 cell line (NC-OE: negative control for over expression; OE: over expression; NC-KD: negative control for knockdown; KD: knockdown). B. Representative result of cell cycle distributions ofSMMC-7721 and Bel-7402 cell line. C, D. Quantitative of analysis of cell cycle percentages in SK-Hep-1, HCC-LM3, SMMC-7721 cell line and Bel-7402 cell line (*. P<0.05; **. P<0.01; ***. P<0.001). E, F. CCK-8 assays assessing the effect of the Haus3 on the in vitro proliferation of SMMC-7721 and Bel-7402cells after lenti-virus mediated knockdown and overexpression of Haus3.
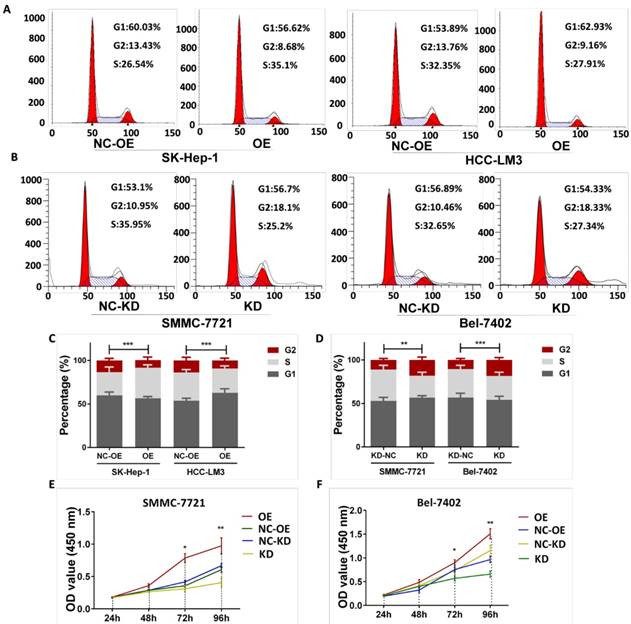
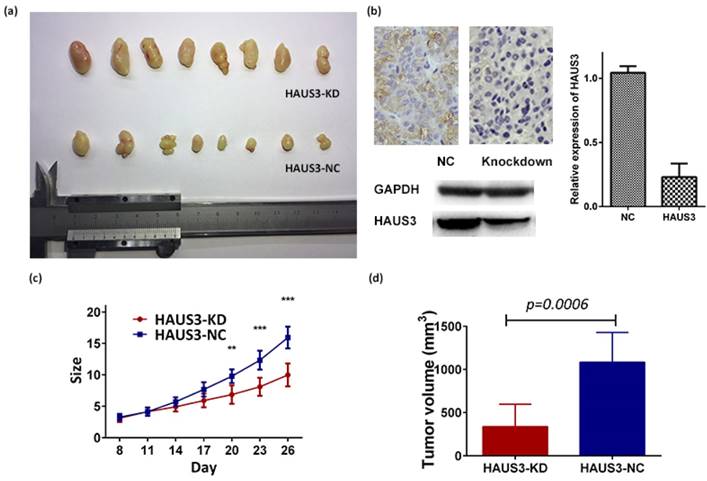
Next, we investigated the effect of Haus3 on proliferation using a CCK-8 assay. In both cell lines, knockdown of Haus3 was associated with inhibition of proliferation and Haus3 overexpression promoted HCC cell growth (Figure 4E, F). To further characterize the effect of Haus3 on HCC tumor growth in vivo, nude mice were inoculated subcutaneously with 1×10⁶ cells with Haus3 knockdown and negative control. The mice were observed for 26 days and tumor size was recorded every 3 days (Figure 5C). Tumor growth was inhibited in the Haus3 knockdown group (tumor volume, NC: 337.1±91.65, n=8; KD: 1085± 121.2, n=8) (Figure 5A, D). After the mice were sacrificed, tumor tissues were subjected to IHC to validate Haus3 expression level (Figure 5B).
Haus3 knockdown inhibited cell proliferation in a xenograft animal model. A. 1×10⁶ cells were injected subcutaneously into the right upper flank region of nude mice. B. IHC analysis showed the expression of Haus3 in xenograft after mice were sacrificed (day 26).Histogram and western blot showed the protein level of Haus3 in xenograft.C. The size of tumor were recorded every 3 days (t test,*. P<0.05; **. P<0.01). d. Tumor volume was calculated on day 26 by equation: V= (long*(width/2)2) /2.
Haus3 affects the phosphorylation of PLK1-T210 and Cdk1/cyclin B1 activity in HCC cells
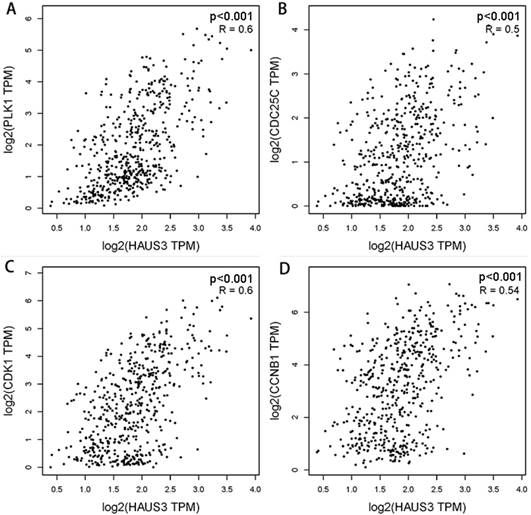
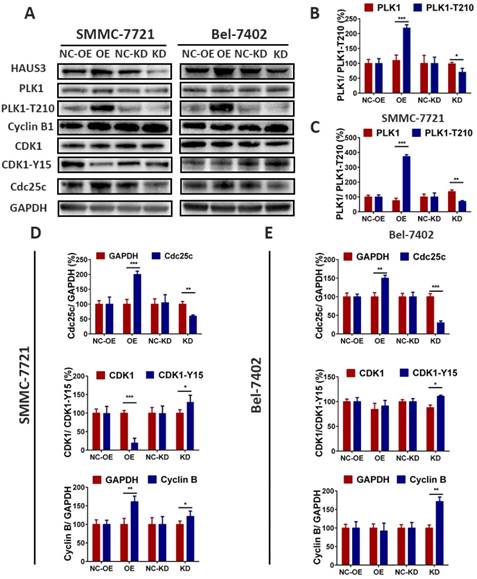
Correlation analysis of Haus3 with PLK1, Cdc25c, Cdk1, and Cyclin B1 using Gene Expression Profiling Interactive Analysis (GEPIA) showed significant correlations (Figure. 6). Efficient stable knockdown is demonstrated in Figure 7A, B. Western blotting was performed to investigate the expression of PLK1, PLK1-T210, cdc25c, Cdk1, Cdk1-Y15, and cyclin B1. As shown in Figure 7, the expression of PLK1-T210 increased in Haus3 overexpression cell lines and decreased in Haus3 knockdown cell lines. Cdc25c expression showed a similar tendency. There was no difference in the expression of Cdk1 in overexpression and knockdown groups, but levels of Cdk1- Y15 decreased in the overexpression group and increased in the knockdown group. The expression of cyclin B1 showed a similar time course to that of Cdk-Y15. These data indicate that Haus3-induced HCC cell G2/M phase arrest might be mediated through phosphorylation of PLK1-T210 and disruption of Cdk1/cyclin B1 complex activity.
Correlation analysis of Haus3 with PLK1, Cdc25c, Cdk1, cyclin B1. A-D. Correlation analysis was performed using GEPIA including TCGA LIHC tumor and normal data. The correlation coefficients were calculated using Pearson test.
Haus3 regulate the activity of PLK1 and Cdk1/cyclin B1 complex. A. SMMC-7721 and Bel-7402 were analyzed using western blot with PLK1-T210, Cyclin B1, Cdk1-Y15and Cdc25c. B-E. Quantitative analysis of western blot (* p<0.05, ** p<0.01, *** p<0.001). The gray value of GAPDH was taken as 100%, both in the two cell lines.
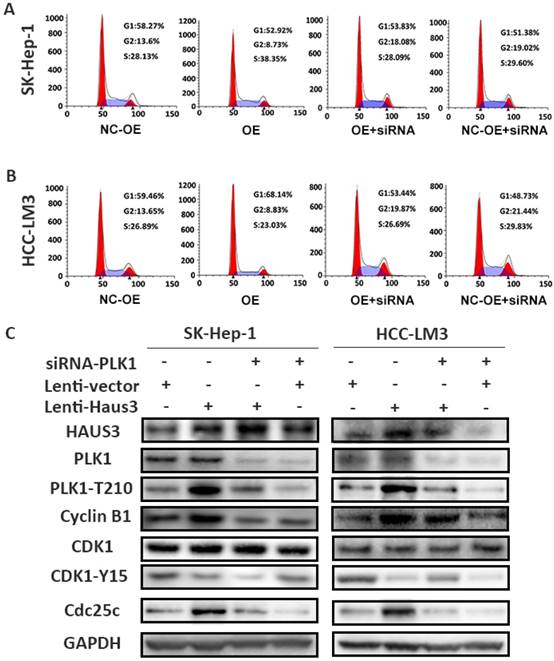
In figure. 8, PLK1 was knockdown using siRNA in NC-OE and OE group, and the result showed downregulation of PLK1 could reverse the decreasing G2/M percentage cells induced by overexpression of Haus3. HCC cell circle arrest was observed in NC-OE+siRNA and OE+siRNA group. Comparing with NC group, western blot showed phosphorylation of PLK1-T210, cyclin B1, cdc25c increased, phosphorylation of cdk1-Y15 decreased in OE group. These proteins reversed in NC-OE+siRNA group, and NC+siRNA group showed the consistent result.
These results showed Haus3 plays an important role in regulating the G2/M phase transition of HCC through regulating the activity of PLK2-T210 and Cdk1/cyclin B1 complex.
Haus3 regulates the expression of α-tubulin and γ-tubulin in HCC cells
PLK1 was reported to have important functions throughout M phase of the cell cycle. As Haus3 regulates the phosphorylation of PLK1-T210, we assumed that it would also regulate centrosome maturation and spindle assembly. The expression of α-tubulin and γ-tubulin was examined by Immunofluorescence using TRITC-conjugated antibodies against α-tubulin and FITC-conjugated antibodies against γ-tubulin. Tubulin expression was decreased in Haus3 knockdown cells. (Supplemental FigureA, B). Western blot analysis showed a similar trend for α-tubulin and γ-tubulin, Haus6 and Haus8 (2 members from Hau complex), were also downregulated. (Supplemental Figure C).
Discussion
In the present study, we first analyzed 50 paired HCC tissues and non-tumor tissues from TCGA datasets and found that Haus3 was highly expressed in HCC tissue. To further validate the level of Haus3, we showed that Haus3 expression levels in 137 paired HCC tissues and adjacent tissues from our hospital were consistent with data from the TCGA dataset. Immunohistochemistry results suggested that a high level of Haus3 in HCC tissue is a frequent event. Then we tried to explain the role of Haus3 in the progress of HCC. We found downregulation of Haus3 affected the phosphorylation of PLK1-T210 and caused G2/M arrest then inhibited tumor growth in vitro and in vivo, these results suggested that Haus3 is an oncogene in HCC.
Although recent improvements in early diagnosis, operation skills, and adjunctive therapy have led to a decrease in the incidence and mortality of HCC, the prognosis of HCC is still not satisfactory. The 5-year survival of HCC after operation was in the range 5-30% throughout 2000-2014 all over the world [25]. In this study, we identified Haus3 as an independent risk factor predicting early prognosis based on protein expression data obtained from IHC staining of tissue samples from HCC patients. Our data, together with previous reports including Haus3 expression, suggest that Haus3 may be a practical biomarker for the prognosis of HCC.
Based on reports that the Haus complex might interact with the PLK1-PICH complex [26], we performed correlation analysis between PLK1 and Haus3 in GEPIA. PLK1 was frequently reported to promote cell cycle transition from G2 phase to M phase [17, 27]. The Polo box domain (PBD) of PLK1 specifically combines with cdc25; leading to phosphorylation of cdc25c that then activates the Cdk1/cyclin B1 complex [28]. This heterodimeric complex promotes mitosis by phosphorylating and activating enzymes regulating chromatin condensation, mitosis- specific microtubule reorganization, and changes in the actin cytoskeleton required for mitotic rounding of the cell [7, 29, 30]. In the present study, we have confirmed the previous findings. The phosphorylation of PLK1, cyclin B1, and cdc25c was upregulated and phosphorylation of Cdk1 was downregulated, and the percent of cells in G2/M phase was decreased in Haus3 overexpression cell lines. The opposite tendency was observed in Haus3 knockdown cell lines. These results were consistent with the notion that Haus3 regulates G2/M phase of the cell cycle affected the phosphorylation of PLK1-T210 and activation of Cdk1/cyclin B1. Further studies are needed to prove whether Haus3 has a direct role in these processes.
Knockdown PLK1 reverse the decreasing percentage of G2/M phase cells induced by overexpression of Haus3. A. Representative result of cell cycle distributions measured by flow cytometry with propidium iodide staining in SK-Hep-1 (NC-OE: negative control for Haus3 over expression; OE: Haus3 over expression; OE+siRNA: PLK1knockdown in OE group; NC+siRNA: PLK1 knockdown in NC group). B. Representative result of cell cycle distributions measured by flow cytometry with propidium iodide staining in HCC-LM3. C. SK-Hep-1 and HCC-LM3 were analyzed using western blot with PLK1-T210, Cyclin B1, Cdk1-Y15and Cdc25c
The relationship between PLK1 and Haus3 suggests that these two proteins may play a similar role in mitosis. PLK1 was reported to be responsible for centrosome maturation and spindle assembly [31]. During mitosis, Haus3 is located on the centrosome in metaphase, and on the centrosome and spindle in anaphase [32]. In this study, we found an interesting phenomenon that the level of Haus6 and Haus8 decreased in Haus3 Knockdown group, Haus6 and Haus8 were reported as subunits implicated in augmin and the γ-tubulin ring complex (γTuRC) and microtubule binding, respectively[7]. These findings support the idea that Haus3 regulates the expression of the centrosome-related protein α-tubulin and the spindle-related protein γ-tubulin. In the present study, the expression of α-tubulin and γ-tubulin increased in a Haus3 overexpression cell line, which was consistent with previous reports. Further experimental evidences are needed to explain the mechanism.
In summary, we described Hasu3 is an important player in control of cell cycle, cell proliferation and clinical outcomes during human HCC. Our data suggest that Haus3 function as an oncogene in HCC progression, decreasing Haus3 expression by using small molecules or by targeting gene-delivery systems through gene transfer may be novel approaches that can be used for the treatment of HCC.
Acknowledgements
This study was funded by National S&T Major Project (Grant number: 2017ZX10203205), Projects of Medical and Health Technology Program in Zhejiang province (Grant number: 2015KYB062), Natural Science Foundation of Zhejiang Province (Grant number: LQ19H160030), Medical Science and Technology Project of Zhejiang Province (Grant number: 2016146968).
Ethics approval and consent to participate
All procedures performed in studies involving human participants were in accordance with the ethical standards of Ethical Committee at the First Affiliated Hospital, Zhejiang University School of Medicine and with the 1983 Helsinki declaration and its later amendments or comparable ethical standards.
All applicable guidelines from Ethical Committee at the First Affiliated Hospital, Zhejiang University School of Medicine for the care and use of animals were followed.
Competing Interests
The authors have declared that no competing interest exists.
References
1. Siegel RL, Miller KD, Jemal A. Cancer Statistics, 2017. CA: a cancer journal for clinicians. 2017;67:7-30
2. Chen W, Zheng R, Baade PD, Zhang S, Zeng H, Bray F. et al. Cancer statistics in China, 2015. CA: a cancer journal for clinicians. 2016;66:115-32
3. Shah SP, Morin RD, Khattra J, Prentice L, Pugh T, Burleigh A. et al. Mutational evolution in a lobular breast tumour profiled at single nucleotide resolution. Nature. 2009;461:809-13
4. Ching YH, Munroe RJ, Moran JL, Barker AK, Mauceli E, Fennell T. et al. High resolution mapping and positional cloning of ENU-induced mutations in the Rw region of mouse chromosome 5. BMC genetics. 2010;11:106
5. Lawo S, Bashkurov M, Mullin M, Ferreria MG, Kittler R, Habermann B. et al. HAUS, the 8-subunit human Augmin complex, regulates centrosome and spindle integrity. Current biology: CB. 2009;19:816-26
6. Uehara R, Nozawa RS, Tomioka A, Petry S, Vale RD, Obuse C. et al. The augmin complex plays a critical role in spindle microtubule generation for mitotic progression and cytokinesis in human cells. Proceedings of the National Academy of Sciences of the United States of America. 2009;106:6998-7003
7. Sanchez-Huertas C, Freixo F, Viais R, Lacasa C, Soriano E, Luders J. Non-centrosomal nucleation mediated by augmin organizes microtubules in post-mitotic neurons and controls axonal microtubule polarity. Nature communications. 2016;7:12187
8. Sanchez-Huertas C, Luders J. The augmin connection in the geometry of microtubule networks. Current biology: CB. 2015;25:R294-9
9. Savoian MS, Glover DM. Differing requirements for Augmin in male meiotic and mitotic spindle formation in Drosophila. Open biology. 2014;4:140047
10. Tsai CY, Ngo B, Tapadia A, Hsu PH, Wu G, Lee WH. Aurora-A phosphorylates Augmin complex component Hice1 protein at an N-terminal serine/threonine cluster to modulate its microtubule binding activity during spindle assembly. The Journal of biological chemistry. 2011;286:30097-106
11. Uehara R, Goshima G. [Mitotic spindle formation mediated by augmin protein complex]. Tanpakushitsu kakusan koso Protein, nucleic acid, enzyme. 2009;54:1850-5
12. Wainman A, Buster DW, Duncan T, Metz J, Ma A, Sharp D. et al. A new Augmin subunit, Msd1, demonstrates the importance of mitotic spindle-templated microtubule nucleation in the absence of functioning centrosomes. Genes & development. 2009;23:1876-81
13. Hanahan D, Weinberg RA. Hallmarks of cancer: the next generation. Cell. 2011;144:646-74
14. Blevins MA, Towers CG, Patrick AN, Zhao R, Ford HL. The SIX1-EYA transcriptional complex as a therapeutic target in cancer. Expert opinion on therapeutic targets. 2015;19:213-25
15. Archambault V, Lepine G, Kachaner D. Understanding the Polo Kinase machine. Oncogene. 2015;34:4799-807
16. Strebhardt K. Multifaceted polo-like kinases: drug targets and antitargets for cancer therapy. Nature reviews Drug discovery. 2010;9:643-60
17. Treekitkarnmongkol W, Katayama H, Kai K, Sasai K, Jones JC, Wang J. et al. Aurora kinase-A overexpression in mouse mammary epithelium induces mammary adenocarcinomas harboring genetic alterations shared with human breast cancer. Carcinogenesis. 2016;37:1180-9
18. Zhang H, Diab A, Fan H, Mani SK, Hullinger R, Merle P. et al. PLK1 and HOTAIR Accelerate Proteasomal Degradation of SUZ12 and ZNF198 during Hepatitis B Virus-Induced Liver Carcinogenesis. Cancer research. 2015;75:2363-74
19. Haibara H, Yamazaki R, Nishiyama Y, Ono M, Kobayashi T, Hokkyo-Itagaki A. et al. YPC-21661 and YPC-22026, novel small molecules, inhibit ZNF143 activity in vitro and in vivo. Cancer science. 2017;108:1042-8
20. Xu L, Zhu Y, Shao J, Chen M, Yan H, Li G. et al. Dasatinib synergises with irinotecan to suppress hepatocellular carcinoma via inhibiting the protein synthesis of PLK1. British journal of cancer. 2017;116:1027-36
21. Asghar U, Witkiewicz AK, Turner NC, Knudsen ES. The history and future of targeting cyclin-dependent kinases in cancer therapy. Nature reviews Drug discovery. 2015;14:130-46
22. Malumbres M. Cyclin-dependent kinases. Genome biology. 2014;15:122
23. Zhou YH, Wu X, Tan F, Shi YX, Glass T, Liu TJ. et al. PAX6 suppresses growth of human glioblastoma cells. Journal of neuro-oncology. 2005;71:223-9
24. Shiao YH, Palli D, Caporaso NE, Alvord WG, Amorosi A, Nesi G. et al. Genetic and immunohistochemical analyses of p53 independently predict regional metastasis of gastric cancers. Cancer Epidem Biomar. 2000;9:631-3
25. Allemani C, Matsuda T, Di Carlo V, Harewood R, Matz M, Niksic M. et al. Global surveillance of trends in cancer survival 2000-14 (CONCORD-3): analysis of individual records for 37 513 025 patients diagnosed with one of 18 cancers from 322 population-based registries in 71 countries. Lancet. 2018
26. Hutchins JR, Toyoda Y, Hegemann B, Poser I, Heriche JK, Sykora MM. et al. Systematic analysis of human protein complexes identifies chromosome segregation proteins. Science. 2010;328:593-9
27. Reinhardt HC, Yaffe MB. Phospho-Ser/Thr-binding domains: navigating the cell cycle and DNA damage response. Nature reviews Molecular cell biology. 2013;14:563-80
28. van Vugt MA, Gardino AK, Linding R, Ostheimer GJ, Reinhardt HC, Ong SE. et al. A mitotic phosphorylation feedback network connects Cdk1, Plk1, 53BP1, and Chk2 to inactivate the G(2)/M DNA damage checkpoint. PLoS biology. 2010;8:e1000287
29. Lee YJ, Hiwatashi Y, Hotta T, Xie T, Doonan JH, Liu B. The Mitotic Function of Augmin Is Dependent on Its Microtubule-Associated Protein Subunit EDE1 in Arabidopsis thaliana. Current biology: CB. 2017;27:3891-7 e4
30. Lera RF, Potts GK, Suzuki A, Johnson JM, Salmon ED, Coon JJ. et al. Decoding Polo-like kinase 1 signaling along the kinetochore-centromere axis. Nature chemical biology. 2016;12:411-8
31. Vertii A, Ivshina M, Zimmerman W, Hehnly H, Kant S, Doxsey S. The Centrosome Undergoes Plk1-Independent Interphase Maturation during Inflammation and Mediates Cytokine Release. Developmental cell. 2016;37:377-86
32. Neumann B, Walter T, Heriche JK, Bulkescher J, Erfle H, Conrad C. et al. Phenotypic profiling of the human genome by time-lapse microscopy reveals cell division genes. Nature. 2010;464:721-7
Author contact
![]() Corresponding authors: Xu Xiao, MD, PhD. Tel: +86-571-87236567; Fax: +86-571-87236567; E-mail: zjxuedu.cn and Shusen Zheng, MD, PhD. Tel: +86-571-87236567; Fax: +86-571-87236567; E-mail: shusenzhengedu.cn
Corresponding authors: Xu Xiao, MD, PhD. Tel: +86-571-87236567; Fax: +86-571-87236567; E-mail: zjxuedu.cn and Shusen Zheng, MD, PhD. Tel: +86-571-87236567; Fax: +86-571-87236567; E-mail: shusenzhengedu.cn