Impact Factor ISSN: 1837-9664

 Global reach, higher impact
J Cancer 2019; 10(6):1538-1549. doi:10.7150/jca.28137 This issue Cite
Research Paper
Genetic Association between Interleukin-4 Receptor Polymorphisms and Cancer Susceptibility: A Meta-Analysis Based on 53 Case-Control Studies
Yong Qi1 ![]() , Taofei Zeng2, Song Fan2, Li Zhang2, Chaozhao Liang2
, Taofei Zeng2, Song Fan2, Li Zhang2, Chaozhao Liang2
1. Department of Emergency Surgery, The First Affiliated Hospital of Anhui University of Chinese Medicine, Hefei, Anhui, China.
2. Department of Urology, The First Affiliated Hospital of Anhui Medical University; Institute of Urology, Anhui Medical University; Anhui Province Key Laboratory of Genitourinary Diseases, Anhui Medical University, Hefei, Anhui, China.
Received 2018-6-26; Accepted 2018-12-5; Published 2019-2-26
Abstract
Polymorphisms in interleukin-4 receptor (IL-4R) gene have been reported susceptible to a variety of cancer types, nevertheless, data from these publications remained inconsistent and controversial. We further performed a comprehensive meta-analysis to present a precise estimation of its relationship. Extensive retrieve was performed in PubMed, Google Scholar and Web of Science up to May 25, 2018. Odds ratios (ORs) and 95% confidence intervals (CIs) were conducted to evaluate the overall strength of the associations in five genetic models, as well as in subgroup analyses, stratified by ethnicity, cancer type or source of control. Q-test, Egger's test and Begg's funnel plot were applied to evaluate the heterogeneity and publication bias. In-silico analysis was managed to demonstrate the relationship of IL-4R expression correlated with cancer tissues. Finally, 31 publications including 53 case-control studies were enrolled, with 24,452 cases and 24,971 controls. After a comprehensive analysis, no significant evidence was revealed for the association between four IL-4R polymorphisms (rs1801275, rs1805010, rs1805015, rs2057768) and cancer susceptibility in the overall population, as well as the subgroup analysis stratified by ethnicity, cancer type, the genotyping method or the source of control. To sum up, no evidence was identified between IL-4R polymorphisms and overall cancer susceptibility. Further well-designed studies with large sample sizes will be continued on this issue of interest.
Keywords: meta-analysis, polymorphism, cytokines, interleukin-4 receptor, cancer susceptibility
Introduction
Cancer has been regarded as one of the most frequent causes of death in economically developing and developed countries. According to the 2018 updated global estimation, there are approximately 42 million people across the world suffered from any type of cancer. Including 8 million had breast cancer, 6.3 million had colon and rectum cancer, 5.7 million with prostate cancer and over 2.8 million suffered from respiratory cancer[1]. Another worldwide result conducted by GLOBOCAN represented that there are about 12.7 million new cancer cases and 7.6 million deaths had occurred in 2012, suggested that cancer has become a primary public health threat[2]. It is established that cancers were multifactorial diseases which commonly arose from these intricate interactions between genetic and environmental factors[3].
For the past few years, numerous epidemiologic studies have uncovered that single nucleotide polymorphisms (SNPs) in the cytokine family may contribute to the tumorigenesis of many cancers in several ways, such as, influencing the function of cytokines participated in immune reactions and inflammatory responses, affecting the binding of nuclear factors with targeted genes, and inhibiting apoptosis [4]. Interleukin-4 (IL-4) is a member of the α-helical cytokine family, which is generated by activated CD4+T cells, basophils, and mast cells, regarding as the central differentiation factor managing Th2 development, removing extracellular pathogens, and inhibiting Th1 differentiation. In addition, IL-4 receptor (IL-4R) is a heterodimeric complex that can bind to the Th2 cytokines IL-4 and IL-13[5, 6]. Overexpression of IL-4R has been observed in colorectal carcinoma [6]. In addition, polymorphisms in IL-4R were identified implicated in the tumorigenesis of a variety of cancer types, including pancreatic cancer, renal cell carcinoma, bladder cancer and cervical cancer [7-10]. For example, Schwartzbaum et al. reported an increased susceptibility of glioblastoma contributed by rs1801275 of IL-4R [11], however, Li et al. indicated that the mutant G allele plays a protective function in tumorigenesis[ 12]. The inconsistent might cause by the differences of genotyping methods, source of control, and ethnic lines, as well as the small-scale sample size. Therefore, we conducted a comprehendsive meta-analysis to explore the association between IL-4R polymorphisms and cancer susceptibility.
Material and Methods
Literature search
All eligible publications up to May 25, 2018 were retrieved and extracted by investigators from the databases of PubMed, Google Scholar, Web of Science, CNKI and Wanfang databases, respectively. When discrepancies occurred in data interpretation, we will deal with them by discussing, review of the publications, and counseling other cancer research experts if necessary. The keywords applied for literature retrieve are as follows: (“IL-4R,” OR “Interleukin-4 receptor,” OR “IL4R,”) AND (“SNP,” OR “mutation,” OR “variant,” OR “polymorphism,”) AND (“cancer,” OR “carcinoma,” OR “tumor,” OR “malignancy,” OR “leukemia” OR “lymphoma”). In addition, we conducted a manual retrieve for the additional eligible studies from the studies cited in the reference lists.
Inclusion criteria and exclusion criteria
The publications enrolled in our studies should keep to the following inclusion criteria: 1) publications should illustrate the association between the polymorphisms in IL-4R and cancer susceptibility; 2) The detail genotype frequency of the cases and controls could be obtained directly or indirectly through calculating; 3) case-control studies. However, publications should be removed when they were: 1) no control studies, meta-analysis or systematic review, comments, and case report; 2) no efficient data of the genotype frequency offered; 3) repetitive publications; 4) the publications were conducted on animals or cell lines; 5) they were concerned about other disorders instead of cancers.
Data extraction
Two investigators extracted data from the enrolled case-control studies individually. The following details were collected from each study: the name of the first author, the date of publication, ethnicity, sample size, genotyping method, and genotype frequency of the cases and controls. By comparing enrolled forms between two investigators, the accuracy of the data was verified. If any difference was generated, we would check the full-text of the articles.
Statistical analysis
We applied ORs with corresponding 95% CIs to assess the strength of the relationship between the polymorphisms in IL-4R and overall cancer susceptibility. Five common genetic models applied for assessing gene-disease associations are allele contrast model (B vs. A), heterozygote model (BA vs. AA), homozygote model (BB vs. AA), recessive model (BB vs. BA+AA) and dominant model (BA+BB vs. AA) (AA, homozygotes for the wild allele; AB, heterozygotes; BB, homozygotes for the mutant allele). Bonferroni corrections were also performed to adjust the results, Padjust = 0.05* number of calculated polymorphism * 5 models, and less than 0.05 was considered as statistically significant[13]. In addition, we applied the chi-squared (χ2)-based Q test to calculate between-study heterogeneity[14]. P<0.1 was indicated a substantial level of heterogeneity, and a random effects model (the DerSimonian and Laird method) was selected to pool the data [15]; or else, the fixed effects model (the Mantel-Haenszel method) was adopted. Stratified analyses were also calculated by ethnicity, cancer type, the genotyping method and the source of control. Moreover, we also conducted the Begg's funnel plots and Egger's test to evaluate the publication bias [16, 17]. Hardy-Weinberg equilibrium (HWE) of controls was calculated by the χ2 test. We applied STATA 12.0 (Version 12.0, Stata Corp) to conduct all the statistical analyses, and all the P values were two-sided.
Linkage Disequilibrium (LD) Analysis and in-silico analysis of IL-4R expression
Data were extracted from the 1000 genomes project comprising the polymorphisms in genes of IL-4R in the current study. CHB (Han Chinese in Beijing, China), CHS (southern Han Chinese, China), CEU (Utah residents with Northern and Western European ancestry from the CEPH collection), JPT (Japanese in Tokyo, Japan) and YRI (Yoruba in Ibadan, Nigeria), ESN (Esan in Nigeria) were enrolled in the calculate project, analyses were performed with Haploview software, LD in each above-mentioned population was assessed by r2 statistics.
In order to further explore the relationship between IL-4R expression and cancer, we used a newly developed interactive web server, GEPIA (http://gepia.cancer-pku.cn/), which provided the RNA sequencing expression data of tumors and normal samples from the TCGA and the GTEx projects[18].
Results
Study characteristics
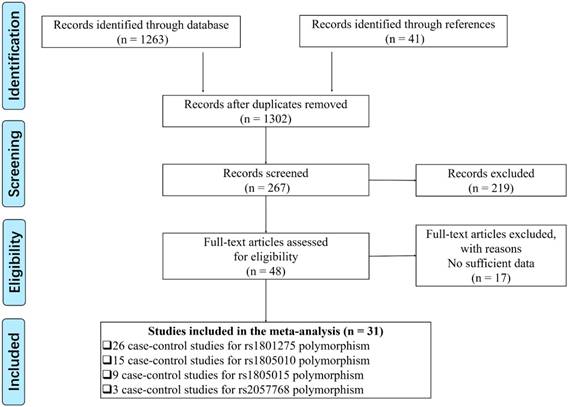
A total of 31 publications including 53 case-control studies satisfied the inclusion criteria, including 24452 cancer patients and 24971 controls focused on rs1801275, rs1805010, rs1805015 and rs2057768, while another 5 polymorphisms (rs1805011, rs1805012, rs1805013, rs1805016, rs3024536) were finally exceeded because of less than 3 studies. We provide a flowchart to show the details of the data selection process (Figure 1). There were 26 case-control studies of the rs1801275 polymorphism[5, 8, 9, 11, 12, 19-37], 15 of the rs1805010 polymorphism[5, 9, 20, 23-26, 28, 32, 33, 37-40], 9 of the rs1805015 polymorphism[9, 11, 12, 23, 24, 32, 33, 38, 41], and 3 of the rs2057768 polymorphism[42-44]. 19 studies were performed in Asians, 29 in Caucasians, 2 in the mixed group (more than two descendant), and 1 in African group. The characteristics of each case-control study, genotype frequencies and HWE examination results were presented in Table 1. Six case-control studies were not comforted to HWE[11, 24, 26, 34, 35, 40], and we further conducted a sensitive analysis to validate the influence of the three studies on the integrated data. In order to evaluate the quality of each enrolled studies, we applied Newcastle-Ottawa Scale (NOS) [45], and filled the result in Table S1, the result of PRISMA2009 checklist was also listed to present our meta-analysis work (Table S2).
Flow chart presenting the study selection procedure.
Details of enrolled studies for current meta-analysis and systematic review
| SNP | First author | Year | Ethnicity | Genotyping Method | Source of Control | Cancer Type | case | control | |||||
|---|---|---|---|---|---|---|---|---|---|---|---|---|---|
| PAA | PAB | PBB | HAA | HAB | HBB | HWE | |||||||
| rs1801275 | Calhoun et al.19 | 2002 | Caucasian | PCR | PB | CC | 78 | 45 | 4 | 60 | 41 | 7 | Y |
| rs1801275 | Nakamura et al.5 | 2002 | Asian | PCR-RFLP | HB | RC | 98 | 40 | 5 | 161 | 42 | 2 | Y |
| rs1801275 | Wu et al.20 | 2003 | Asian | PCR | HB | GC | 160 | 57 | 3 | 164 | 61 | 5 | Y |
| rs1801275 | Schwartzbaum et al.11 | 2005 | Caucasian | PCR-RFLP | PB | HL | 53 | 45 | 11 | 243 | 236 | 24 | N |
| rs1801275 | Balasubramanian et al.21 | 2006 | Caucasian | Taq-Man | PB | BC | 493 | 249 | 33 | 451 | 288 | 28 | N |
| rs1801275 | Brenner et al.22 | 2007 | Caucasian | PCR | HB | Glioma | 407 | 214 | 28 | 651 | 331 | 44 | Y |
| rs1801275 | Ivansson et al.23 | 2007 | Caucasian | Taq-Man | PB | CC | 766 | 462 | 66 | 163 | 100 | 23 | Y |
| rs1801275 | Landi et al.24 | 2007 | Caucasian | Taq-Man | HB | CRC | 183 | 87 | 14 | 332 | 180 | 24 | Y |
| rs1801275 | Olson et al.8 | 2007 | Caucasian | PCR-RFLP | PB | PC | 104 | 38 | 7 | 89 | 41 | 5 | Y |
| rs1801275 | Wiemels et al.38 | 2007 | Caucasian | PCR-RFLP | PB | Glioma | 243 | 126 | 15 | 303 | 144 | 22 | Y |
| rs1801275 | Gu et al.25 | 2008 | Caucasian | PCR | PB | Melanoma | 120 | 64 | 11 | 121 | 65 | 7 | Y |
| rs1801275 | Yang et al.27 | 2008 | Mixed | PCR-RFLP | PB | UBC | 406 | 193 | 29 | 374 | 229 | 22 | Y |
| rs1801275 | Zambon et al.26 | 2008 | Caucasian | Taq-Man | HB | GC | 17 | 7 | 0 | 29 | 15 | 1 | Y |
| rs1801275 | Lee et al.29 | 2010 | Asian | PCR-SSP | HB | CRC | 137 | 29 | 4 | 84 | 43 | 4 | Y |
| rs1801275 | Mohan et al.28 | 2009 | Caucasian | PCR-RFLP | PB | RC | 37 | 9 | 4 | 31 | 17 | 3 | Y |
| rs1801275 | Scola et al.30 | 2010 | Caucasian | PCR-RFLP | HB | PC | 32 | 11 | 15 | 79 | 48 | 4 | Y |
| rs1801275 | Chu et al.32 | 2012 | Asian | Taq-Man | HB | UBC | 559 | 227 | 26 | 793 | 314 | 30 | Y |
| rs1801275 | Ruan et al.31 | 2011 | Asian | PCR | HB | Glioma | 462 | 196 | 14 | 466 | 205 | 25 | Y |
| rs1801275 | Chu et al.9 | 2012 | Asian | Taq-Man | HB | RC | 407 | 195 | 18 | 424 | 176 | 23 | Y |
| rs1801275 | Li et al.12 | 2012 | Asian | PCR | PB | Glioma | 161 | 62 | 2 | 157 | 88 | 5 | Y |
| rs1801275 | Ingram et al.33 | 2013 | Mixed | Taq-Man | PB | CRC | 847 | 524 | 77 | 364 | 190 | 23 | Y |
| rs1801275 | Jin et al.34 | 2013 | Asian | PCR | PB | Glioma | 56 | 14 | 2 | 187 | 105 | 6 | N |
| rs1801275 | Quan et al.35 | 2014 | Caucasian | PCR | PB | BC | 642 | 288 | 47 | 660 | 261 | 32 | Y |
| rs1801275 | Quan et al.35 | 2014 | African | PCR | PB | BC | 296 | 490 | 800 | 360 | 522 | 847 | N |
| rs1801275 | Sousa et al.36 | 2015 | Caucasian | Taq-Man | PB | NPC | 159 | 63 | 16 | 436 | 212 | 39 | Y |
| rs1801275 | Liang et al.37 | 2017 | Asian | PCR-LDR | HB | RC | 84 | 44 | 4 | 100 | 43 | 2 | Y |
| rs1805010 | Nakamura et al.5 | 2002 | Asian | PCR-RFLP | HB | RC | 42 | 76 | 25 | 84 | 94 | 27 | Y |
| rs1805010 | Wu et al.20 | 2003 | Asian | PCR | HB | GC | 51 | 120 | 49 | 52 | 119 | 59 | Y |
| rs1805010 | Ivansson et al.23 | 2007 | Caucasian | Taq-Man | HB | CC | 365 | 653 | 267 | 99 | 147 | 38 | Y |
| rs1805010 | Landi et al.24 | 2007 | Caucasian | Taq-Man | HB | CRC | 83 | 141 | 55 | 162 | 262 | 102 | Y |
| rs1805010 | Wiemels et al.38 | 2007 | Caucasian | PCR-RFLP | HB | Glioma | 119 | 196 | 72 | 148 | 232 | 91 | Y |
| rs1805010 | Gu et al.25 | 2008 | Caucasian | PCR | PB | Melanoma | 67 | 104 | 43 | 57 | 110 | 50 | Y |
| rs1805010 | Zambon et al.26 | 2008 | Caucasian | Taq-Man | HB | GC | 4 | 9 | 10 | 19 | 15 | 11 | N |
| rs1805010 | Crusius et al.42 | 2008 | Caucasian | PCR | PB | GC | 71 | 134 | 39 | 352 | 549 | 249 | Y |
| rs1805010 | Mohan et al.28 | 2009 | Caucasian | PCR-RFLP | PB | RC | 20 | 12 | 18 | 23 | 22 | 6 | Y |
| rs1805010 | Ando et al.39 | 2009 | Asian | PCR-RFLP | HB | GC | 137 | 156 | 37 | 77 | 85 | 28 | Y |
| rs1805010 | Chu et al.9 | 2012 | Asian | Taq-Man | PB | UBC | 213 | 399 | 205 | 305 | 557 | 278 | Y |
| rs1805010 | Wang et al.51 | 2012 | Asian | PCR-RFLP | PB | HL | 185 | 98 | 51 | 190 | 96 | 48 | N |
| rs1805010 | Chu et al.32 | 2012 | Asian | Taq-Man | PB | RC | 219 | 268 | 133 | 168 | 310 | 145 | Y |
| rs1805010 | Ingram et al.33 | 2013 | Mixed | Taq-Man | PB | CRC | 428 | 700 | 280 | 162 | 295 | 106 | Y |
| rs1805010 | Liang et al.37 | 2017 | Asian | PCR-LDR | HB | RC | 26 | 76 | 30 | 36 | 78 | 31 | Y |
| rs1805015 | Schwartzbaum et al.11 | 2005 | Caucasian | PCR-RFLP | PB | Glioma | 64 | 40 | 4 | 288 | 107 | 16 | Y |
| rs1805015 | Ivansson et al.23 | 2007 | Caucasian | Taq-Man | HB | CC | 871 | 379 | 44 | 176 | 94 | 16 | Y |
| rs1805015 | Landi et al.24 | 2007 | Caucasian | Taq-Man | HB | CRC | 201 | 73 | 7 | 362 | 164 | 6 | N |
| rs1805015 | Wiemels et al.38 | 2007 | Caucasian | PCR-RFLP | HB | Glioma | 274 | 99 | 13 | 341 | 113 | 16 | Y |
| rs1805015 | Chu et al.9 | 2012 | Asian | Taq-Man | PB | UBC | 673 | 141 | 2 | 951 | 182 | 7 | Y |
| rs1805015 | Chu et al.32 | 2012 | Asian | Taq-Man | PB | RC | 519 | 100 | 1 | 527 | 90 | 6 | Y |
| rs1805015 | Li et al.12 | 2012 | Asian | PCR | PB | Glioma | 196 | 30 | 0 | 207 | 42 | 4 | Y |
| rs1805015 | Ingram et al.33 | 2013 | Mixed | Taq-Man | PB | CRC | 951 | 442 | 54 | 400 | 158 | 18 | Y |
| rs1805015 | Shamran et al.41 | 2014 | Caucasian | PCR-RFLP | PB | Glioma | 70 | 25 | 5 | 17 | 15 | 8 | Y |
| rs2057768 | Crusius et al.42 | 2008 | Caucasian | PCR | PB | GC | 108 | 116 | 11 | 583 | 433 | 91 | Y |
| rs2057768 | Wilkening et al.43 | 2008 | Caucasian | Taq-Man | PB | CRC | 150 | 139 | 18 | 296 | 238 | 47 | Y |
| rs2057768 | Burada et al.44 | 2012 | Caucasian | Taq-Man | HB | GC | 53 | 40 | 12 | 144 | 85 | 13 | Y |
CRC: Colorectal cancer; GC: Gastric cancer; BC: Breast cancer; UBC: Bladder cancer; CC: Cervical cancer; PC: Pancreatic cancer; RC: Renal cancer; NPC: nasopharyngeal carcinoma; HL: Hodgkin's lymphoma; H-B: Hospital based; P-B: Population based; HWE: Hardy Weinberg Equilibrium
Quantitative data synthesis
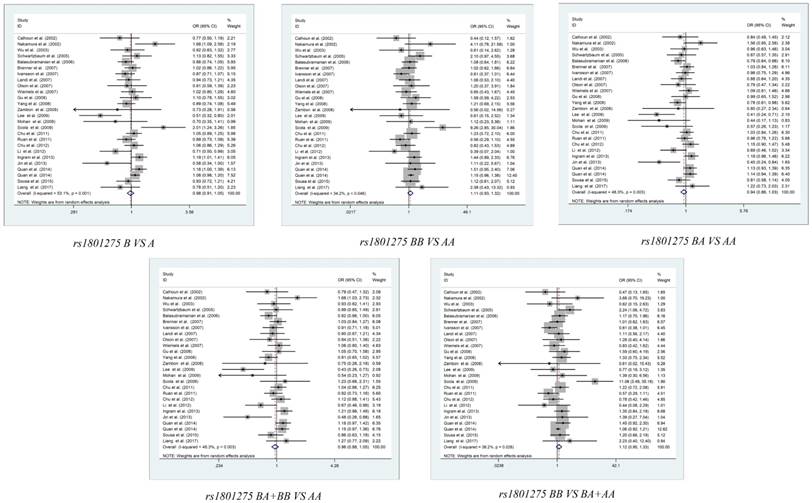
The summary of the meta-analysis between the IL-4R polymorphisms and cancer susceptibility was shown in Table 2. After complicated calculation, we revealed that there is no significant association between rs1801275, rs1805010, rs1805015, and rs2057768 polymorphisms and cancer susceptibility in the overall population (Figure 2, Figure S1-S3). In the subgroup analyses stratified by ethnicity, cancer type, the genotyping method or the source of control, the homozygote model of cervical cancer in rs1801275 shown a decreased risk (BB vs. AA: OR (95% CI) = 0.581(0.364-0.925), PH=0.022), while shown an increased risk in breast cancer (BB vs. AA: OR (95% CI) = 1.181(1.006-1.386), PH=0.043), the recessive model of cervical cancer in rs1801275 also shown a decreased risk (BB vs. BA+AA: OR (95% CI) = 0.59(0.374-0.931), PH=0.024). For rs1805010, several significant risk were shown in HB subgroup of heterozygote model (BA vs. AA: OR (95% CI) = 1.151(1.001-1.323), PH=0.049), HB subgroup of dominant model (BA+BB vs. AA: OR (95% CI) = 1.167(1.022- 1.332), PH=0.023), PCR subgroup of recessive model (BB vs. BA+ AA: OR (95% CI) = 0.767 (0.604- 0.974), PH=0.03), gastric cancer subgroup of recessive model (BB vs. BA+AA: OR (95% CI) = 0.785 (0.617-0.998), PH=0.048). For rs1805015, the significant risk was shown in Asian population subgroup of homozygote model (BB vs. AA: OR (95% CI) = 0.24(0.076- 0.752), PH=0.014), Asian population subgroup of recessive model (BB vs. BA+AA: OR (95% CI) = 0.239(0.076-0.749), PH=0.014). For rs2057768, the subgroup of PB and gastric cancer shown statistical difference in heterozygote model (BA vs. AA), recessive model (BB vs. BA+AA) or dominant model (BA+BB vs. AA). However, after Bonferroni corrections, all the Padjust value is higher than 0.05. The results revealed that there is no significant association between IL-4R polymorphisms and cancer risks in stratification analyses.
Results of meta-analysis for polymorphisms in and cancer susceptibility.
| Polymorphisms | Comparision | Subgroup | N | PH | PZ | Padjust | Random | Fixed |
|---|---|---|---|---|---|---|---|---|
| rs1801275 | B VS A | Overall | 26 | 0.001 | 0.588 | 1.000 | 0.980(0.910-1.055) | 1.007(0.963-1.053) |
| B VS A | Caucasian | 14 | 0.089 | 0.983 | 1.000 | 0.998(0.909-1.095) | 0.999(0.933-1.070) | |
| B VS A | Asian | 9 | 0.003 | 0.187 | 1.000 | 0.889(0.747-1.059) | 0.939(0.857-1.029) | |
| B VS A | Mixed | 2 | 0.028 | 0.808 | 1.000 | 1.035(0.783-1.369) | 1.054(0.929-1.194) | |
| B VS A | PB | 15 | 0.019 | 0.546 | 1.000 | 0.974(0.893-1.062) | 1.010(0.956-1.067) | |
| B VS A | HB | 11 | 0.003 | 0.983 | 1.000 | 0.998(0.866-1.151) | 1.000(0.925-1.082) | |
| B VS A | CC | 2 | 0.627 | 0.088 | 1.000 | 0.850(0.704-1.026) | 0.849(0.704-1.025) | |
| B VS A | RC | 4 | 0.055 | 0.522 | 1.000 | 1.036(0.752-1.426) | 1.055(0.895-1.243) | |
| B VS A | GC | 2 | 0.672 | 0.501 | 1.000 | 0.890(0.631-1.254) | 0.733(0.281-1.914) | |
| B VS A | BC | 3 | 0.044 | 0.537 | 1.000 | 1.047(0.904-1.213) | 1.060(0.981-1.144) | |
| B VS A | Glioma | 5 | 0.119 | 0.146 | 1.000 | 0.898(0.768-1.048) | 0.925(0.832-1.028) | |
| B VS A | CRC | 3 | 0.002 | 0.497 | 1.000 | 0.874(0.591-1.291) | 1.036(0.909-1.182) | |
| B VS A | PC | 2 | 0.015 | 0.462 | 1.000 | 1.340(0.615-2.922) | 1.277(0.928-1.757) | |
| B VS A | UBC | 2 | 0.209 | 0.761 | 1.000 | 0.977(0.832-1.147) | 0.980(0.863-1.114) | |
| B VS A | PCR | 9 | 0.03 | 0.613 | 1.000 | 0.971(0.866-1.089) | 1.024(0.959-1.094) | |
| B VS A | PCR-RFLP | 7 | 0.013 | 0.338 | 1.000 | 1.111(0.895-1.379) | 1.040(0.925-1.171) | |
| B VS A | Taq-Man | 8 | 0.222 | 0.969 | 1.000 | 0.992(0.908-1.084) | 0.999(0.928-1.075) | |
| B VS A | Y | 22 | 0.002 | 0.658 | 1.000 | 0.981(0.901-1.068) | 1.002(0.950-1.057) | |
| B VS A | N | 4 | 0.035 | 0.695 | 1.000 | 0.963(0.799-1.162) | 1.018(0.937-1.106) | |
| BA VS AA | Overall | 26 | 0.003 | 0.181 | 1.000 | 0.941(0.860-1.029) | 0.971(0.916-1.030) | |
| BA VS AA | Caucasian | 14 | 0.4 | 0.174 | 1.000 | 0.940(0.860-1.029) | 0.942(0.865-1.027) | |
| BA VS AA | Asian | 9 | 0.002 | 0.362 | 1.000 | 0.907(0.735-1.119) | 0.963(0.865-1.073) | |
| BA VS AA | Mixed | 2 | 0.008 | 0.86 | 1.000 | 0.963(0.636-1.458) | 0.989(0.847-1.154) | |
| BA VS AA | PB | 15 | 0.009 | 0.142 | 1.000 | 0.914(0.812-1.031) | 0.955(0.886-1.030) | |
| BA VS AA | HB | 11 | 0.05 | 0.751 | 1.000 | 0.977(0.847-1.127) | 0.998(0.908-1.097) | |
| BA VS AA | CC | 2 | 0.623 | 0.699 | 1.000 | 0.953(0.746-1.217) | 0.953(0.746-1.217) | |
| BA VS AA | RC | 4 | 0.143 | 0.127 | 1.000 | 1.146(0.831-1.579) | 1.166(0.957-1.419) | |
| BA VS AA | GC | 2 | 0.754 | 0.734 | 1.000 | 0.935(0.631-1.384) | 0.934(0.631-1.383) | |
| BA VS AA | BC | 3 | 0.02 | 0.927 | 1.000 | 1.011(0.801-1.275) | 1.019(0.906-1.145) | |
| BA VS AA | Glioma | 5 | 0.047 | 0.297 | 1.000 | 0.892(0.719-1.106) | 0.942(0.829-1.070) | |
| BA VS AA | CRC | 3 | 0.001 | 0.378 | 1.000 | 0.801(0.490-1.312) | 0.990(0.841-1.165) | |
| BA VS AA | PC | 2 | 0.478 | 0.12 | 1.000 | 0.713(0.462-1.101) | 0.710(0.461-1.093) | |
| BA VS AA | UBC | 2 | 0.08 | 0.242 | 1.000 | 0.899(0.684-1.180) | 0.912(0.782-1.064) | |
| BA VS AA | PCR | 9 | 0.092 | 0.856 | 1.000 | 0.973(0.852-1.110) | 1.009(0.919-1.107) | |
| BA VS AA | PCR-RFLP | 7 | 0.071 | 0.127 | 1.000 | 0.889(0.703-1.124) | 0.891(0.768-1.034) | |
| BA VS AA | Taq-Man | 8 | 0.145 | 0.746 | 1.000 | 0.978(0.868-1.101) | 0.985(0.899-1.079) | |
| BA VS AA | Y | 22 | 0.022 | 0.378 | 1.000 | 0.959(0.873-1.053) | 0.985(0.923-1.052) | |
| BA VS AA | N | 4 | 0.009 | 0.258 | 1.000 | 0.838(0.616-1.139) | 0.918(0.803-1.048) | |
| BB VS AA | Overall | 26 | 0.046 | 0.233 | 1.000 | 1.110(0.935-1.319) | 1.127(1.006-1.261) | |
| BB VS AA | Caucasian | 14 | 0.019 | 0.276 | 1.000 | 1.172(0.881-1.561) | 1.145(0.951-1.377) | |
| BB VS AA | Asian | 9 | 0.317 | 0.527 | 1.000 | 0.903(0.634-1.285) | 0.907(0.672-1.226) | |
| BB VS AA | Mixed | 2 | 0.656 | 0.114 | 1.000 | 1.341(0.928-1.938) | 1.345(0.931-1.941) | |
| BB VS AA | PB | 11 | 0.336 | 0.048 | 1.000 | 1.131(0.966-1.323) | 1.138(1.001-1.295) | |
| BB VS AA | HB | 15 | 0.014 | 0.485 | 1.000 | 1.158(0.767-1.748) | 1.088(0.860-1.377) | |
| BB VS AA | CC | 2 | 0.638 | 0.022 | 0.440 | 0.584(0.366-0.933) | 0.581(0.364-0.925) | |
| BB VS AA | RC | 4 | 0.254 | 0.657 | 1.000 | 1.299(0.629-2.684) | 1.123(0.673-1.873) | |
| BB VS AA | GC | 2 | 0.96 | 0.457 | 1.000 | 0.606(0.161-2.275) | 0.605(0.161-2.271) | |
| BB VS AA | BC | 3 | 0.524 | 0.043 | 0.860 | 1.180(1.005-1.386) | 1.181(1.006-1.386) | |
| BB VS AA | Glioma | 5 | 0.579 | 0.212 | 1.000 | 0.819(0.590-1.136) | 0.812(0.586-1.126) | |
| BB VS AA | CRC | 3 | 0.466 | 0.259 | 1.000 | 1.231(0.842-1.798) | 1.240(0.853-1.803) | |
| BB VS AA | PC | 2 | 0.016 | 0.239 | 1.000 | 3.333(0.449-24.745) | 3.452(1.564-7.617) | |
| BB VS AA | UBC | 2 | 0.975 | 0.315 | 1.000 | 1.222(0.827-1.807) | 1.222(0.827-1.807) | |
| BB VS AA | PCR | 9 | 0.225 | 0.212 | 1.000 | 1.039(0.815-1.324) | 1.100(0.947-1.277) | |
| BB VS AA | PCR-RFLP | 7 | 0.021 | 0.052 | 1.000 | 1.765(0.995-3.130) | 1.551(1.124-2.140) | |
| BB VS AA | Taq-Man | 8 | 0.409 | 0.747 | 1.000 | 1.022(0.826-1.263) | 1.035(0.840-1.275) | |
| BB VS AA | Y | 22 | 0.027 | 0.516 | 1.000 | 1.076(0.862-1.343) | 1.092(0.936-1.273) | |
| BB VS AA | N | 4 | 0.504 | 0.066 | 1.000 | 1.173(0.993-1.386) | 1.169(0.990-1.382) | |
| BA+BB VS AA | Overall | 26 | 0.003 | 0.382 | 1.000 | 0.963(0.884-1.048) | 0.990(0.936-1.047) | |
| BA+BB VS AA | Caucasian | 14 | 0.524 | 0.427 | 1.000 | 0.968(0.891-1.050) | 0.967(0.891-1.050) | |
| BA+BB VS AA | Asian | 9 | 0.001 | 0.364 | 1.000 | 0.908(0.736-1.119) | 0.958(0.863-1.063) | |
| BA+BB VS AA | Mixed | 2 | 0.01 | 0.993 | 1.000 | 0.998(0.676-1.474) | 1.023(0.881-1.187) | |
| BA+BB VS AA | PB | 11 | 0.008 | 0.249 | 1.000 | 0.935(0.835-1.048) | 0.980(0.913-1.052) | |
| BA+BB VS AA | HB | 15 | 0.052 | 0.877 | 1.000 | 1.001(0.873-1.148) | 1.007(0.920-1.103) | |
| BA+BB VS AA | CC | 2 | 0.611 | 0.308 | 1.000 | 0.887(0.703-1.118) | 0.886(0.703-1.118) | |
| BA+BB VS AA | RC | 4 | 0.136 | 0.115 | 1.000 | 1.171(0.857-1.599) | 1.165(0.964-1.409) | |
| BA+BB VS AA | GC | 2 | 0.705 | 0.611 | 1.000 | 0.906(0.617-1.330) | 0.905(0.616-1.329) | |
| BA+BB VS AA | BC | 3 | 0.017 | 0.746 | 1.000 | 1.037(0.833-1.292) | 1.051(0.943-1.171) | |
| BA+BB VS AA | Glioma | 5 | 0.057 | 0.222 | 1.000 | 0.881(0.719-1.078) | 0.926(0.819-1.047) | |
| BA+BB VS AA | CRC | 3 | 0.001 | 0.428 | 1.000 | 0.822(0.506-1.334) | 1.014(0.867-1.185) | |
| BA+BB VS AA | PC | 2 | 0.341 | 0.893 | 1.000 | 0.974(0.659-1.438) | 0.974(0.659-1.437) | |
| BA+BB VS AA | UBC | 2 | 0.107 | 0.414 | 1.000 | 0.929(0.729-1.183) | 0.940(0.810-1.090) | |
| BA+BB VS AA | PCR | 9 | 0.038 | 0.61 | 1.000 | 0.965(0.839-1.108) | 1.018(0.932-1.111) | |
| BA+BB VS AA | PCR-RFLP | 7 | 0.116 | 0.557 | 1.000 | 0.987(0.804-1.212) | 0.959(0.832-1.104) | |
| BA+BB VS AA | Taq-Man | 8 | 0.165 | 0.84 | 1.000 | 0.983(0.880-1.099) | 0.991(0.908-1.081) | |
| BA+BB VS AA | Y | 22 | 0.019 | 0.583 | 1.000 | 0.975(0.891-1.067) | 0.997(0.936-1.062) | |
| BA+BB VS AA | N | 4 | 0.009 | 0.393 | 1.000 | 0.883(0.664-1.175) | 0.963(0.852-1.088) | |
| BB VS BA+AA | Overall | 26 | 0.026 | 0.183 | 1.000 | 1.124(0.946-1.335) | 1.094(0.991-1.207) | |
| BB VS BA+AA | Caucasian | 14 | 0.007 | 0.185 | 1.000 | 1.226(0.908-1.655) | 1.175(0.979-1.411) | |
| BB VS BA+AA | Asian | 9 | 0.393 | 0.545 | 1.000 | 0.911(0.661-1.257) | 0.912(0.676-1.230) | |
| BB VS BA+AA | Mixed | 2 | 0.959 | 0.113 | 1.000 | 1.342(0.932-1.932) | 1.342(0.933-1.932) | |
| BB VS BA+AA | PB | 11 | 0.297 | 0.111 | 1.000 | 1.116(0.956-1.302) | 1.093(0.980-1.218) | |
| BB VS BA+AA | HB | 15 | 0.007 | 0.419 | 1.000 | 1.193(0.778-1.830) | 1.101(0.873-1.390) | |
| BB VS BA+AA | CC | 2 | 0.695 | 0.024 | 0.480 | 0.593(0.375-0.938) | 0.590(0.374-0.931) | |
| BB VS BA+AA | RC | 4 | 0.268 | 0.727 | 1.000 | 1.264(0.626-2.554) | 1.095(0.659-1.820) | |
| BB VS BA+AA | GC | 2 | 0.988 | 0.476 | 1.000 | 0.619(0.166-2.315) | 0.619(0.166-2.314) | |
| BB VS BA+AA | BC | 3 | 0.414 | 0.168 | 1.000 | 1.093(0.963-1.240) | 1.093(0.963-1.240) | |
| BB VS BA+AA | Glioma | 5 | 0.594 | 0.22 | 1.000 | 0.823(0.595-1.139) | 0.817(0.591-1.129) | |
| BB VS BA+AA | CRC | 3 | 0.71 | 0.282 | 1.000 | 1.221(0.839-1.776) | 1.226(0.846-1.778) | |
| BB VS BA+AA | PC | 2 | 0.01 | 0.218 | 1.000 | 3.776(0.456-31.263) | 3.895(1.787-8.491) | |
| BB VS BA+AA | UBC | 2 | 0.833 | 0.227 | 1.000 | 1.270(0.861-1.871) | 1.270(0.862-1.871) | |
| BB VS BA+AA | PCR | 9 | 0.325 | 0.452 | 1.000 | 1.030(0.850-1.248) | 1.047(0.928-1.182) | |
| BB VS BA+AA | PCR-RFLP | 7 | 0.01 | 0.035 | 1.000 | 1.910(1.047-3.483) | 1.648(1.201-2.261) | |
| BB VS BA+AA | Taq-Man | 8 | 0.401 | 0.7 | 1.000 | 1.029(0.833-1.271) | 1.041(0.847-1.281) | |
| BB VS BA+AA | Y | 22 | 0.019 | 0.422 | 1.000 | 1.096(0.876-1.372) | 1.101(0.946-1.281) | |
| BB VS BA+AA | N | 4 | 0.271 | 0.196 | 1.000 | 1.179(0.908-1.530) | 1.089(0.957-1.240) | |
| rs1805010 | B VS A | Overall | 15 | 0.002 | 0.468 | 1.000 | 1.034(0.944-1.132) | 1.012(0.959-1.068) |
| B VS A | Asian | 7 | 0.051 | 0.609 | 1.000 | 0.998(0.883-1.126) | 0.980(0.908-1.059) | |
| B VS A | Caucasian | 7 | 0.004 | 0.259 | 1.000 | 1.107(0.928-1.322) | 1.068(0.977-1.168) | |
| B VS A | PCR-RFLP | 5 | 0.078 | 0.251 | 1.000 | 1.109(0.926-1.328) | 1.071(0.953-1.203) | |
| B VS A | PCR | 3 | 0.885 | 0.139 | 1.000 | 0.903(0.788-1.034) | 0.903(0.788-1.034) | |
| B VS A | Taq-Man | 6 | 0.001 | 0.498 | 1.000 | 1.055(0.903-1.234) | 1.018(0.950-1.091) | |
| B VS A | HB | 8 | 0.025 | 0.133 | 1.000 | 1.114(0.968-1.282) | 1.103(1.011-1.203) | |
| B VS A | PB | 7 | 0.058 | 0.253 | 1.000 | 0.964(0.867-1.071) | 0.961(0.898-1.029) | |
| B VS A | RC | 4 | 0.001 | 0.358 | 1.000 | 1.180(0.829-1.678) | 0.974(0.859-1.105) | |
| B VS A | GC | 4 | 0.083 | 0.434 | 1.000 | 0.987(0.793-1.229) | 0.949(0.831-1.083) | |
| B VS A | CRC | 2 | 0.758 | 0.989 | 1.000 | 1.001(0.892-1.123) | 1.001(0.892-1.123) | |
| B VS A | Y | 13 | 0.005 | 0.704 | 1.000 | 1.018(0.929-1.115) | 1.005(0.951-1.062) | |
| B VS A | N | 2 | 0.033 | 0.329 | 1.000 | 1.493(0.667-3.343) | 1.149(0.919-1.436) | |
| BB VS AA | Overall | 15 | 0.004 | 0.521 | 1.000 | 1.061(0.885-1.271) | 1.024(0.919-1.142) | |
| BB VS AA | Asian | 7 | 0.108 | 0.573 | 1.000 | 0.976(0.781-1.220) | 0.957(0.821-1.116) | |
| BB VS AA | Caucasian | 7 | 0.003 | 0.282 | 1.000 | 1.227(0.845-1.780) | 1.140(0.949-1.369) | |
| BB VS AA | PCR-RFLP | 5 | 0.069 | 0.363 | 1.000 | 1.192(0.820-1.733) | 1.115(0.882-1.411) | |
| BB VS AA | PCR | 3 | 0.931 | 0.089 | 1.000 | 0.782(0.589-1.039) | 0.782(0.589-1.038) | |
| BB VS AA | Taq-Man | 6 | 0.002 | 0.433 | 1.000 | 1.127(0.836-1.520) | 1.051(0.915-1.208) | |
| BB VS AA | HB | 8 | 0.027 | 0.172 | 1.000 | 1.226(0.915-1.643) | 1.210(1.009-1.451) | |
| BB VS AA | PB | 7 | 0.068 | 0.315 | 1.000 | 0.933(0.758-1.148) | 0.933(0.814-1.069) | |
| BB VS AA | RC | 4 | 0.003 | 0.324 | 1.000 | 1.407(0.714-2.773) | 0.966(0.752-1.241) | |
| BB VS AA | GC | 4 | 0.124 | 0.26 | 1.000 | 0.902(0.592-1.376) | 0.852(0.645-1.126) | |
| BB VS AA | CRC | 2 | 0.844 | 0.894 | 1.000 | 1.016(0.801-1.289) | 1.016(0.801-1.289) | |
| BB VS AA | Y | 13 | 0.006 | 0.734 | 1.000 | 1.033(0.857-1.244) | 1.009(0.902-1.130) | |
| BB VS AA | N | 2 | 0.062 | 0.286 | 1.000 | 1.848(0.498-6.859) | 1.255(0.827-1.904) | |
| BA VS AA | Overall | 15 | 0.061 | 0.987 | 1.000 | 1.019(0.904-1.148) | 1.001(0.917-1.092) | |
| BA VS AA | Asian | 7 | 0.025 | 0.838 | 1.000 | 1.022(0.828-1.262) | 0.971(0.856-1.100) | |
| BA VS AA | Caucasian | 7 | 0.413 | 0.25 | 1.000 | 1.087(0.940-1.256) | 1.088(0.943-1.255) | |
| BA VS AA | PCR-RFLP | 5 | 0.384 | 0.343 | 1.000 | 1.090(0.907-1.311) | 1.090(0.912-1.303) | |
| BA VS AA | PCR | 3 | 0.339 | 0.678 | 1.000 | 1.043(0.824-1.321) | 1.049(0.838-1.312) | |
| BA VS AA | Taq-Man | 6 | 0.018 | 0.74 | 1.000 | 0.966(0.788-1.184) | 0.945(0.844-1.058) | |
| BA VS AA | HB | 8 | 0.637 | 0.049 | 0.980 | 1.150(0.999-1.322) | 1.151(1.001-1.323) | |
| BA VS AA | PB | 7 | 0.073 | 0.123 | 1.000 | 0.913(0.773-1.078) | 0.916(0.820-1.024) | |
| BA VS AA | RC | 4 | 0.004 | 0.976 | 1.000 | 0.992(0.583-1.688) | 0.855(0.697-1.050) | |
| BA VS AA | GC | 4 | 0.506 | 0.232 | 1.000 | 1.136(0.918-1.407) | 1.139(0.920-1.409) | |
| BA VS AA | CRC | 2 | 0.447 | 0.541 | 1.000 | 0.943(0.782-1.138) | 0.943(0.782-1.137) | |
| BA VS AA | Y | 13 | 0.057 | 0.872 | 1.000 | 1.008(0.889-1.143) | 0.993(0.907-1.086) | |
| BA VS AA | N | 2 | 0.162 | 0.509 | 1.000 | 1.381(0.575-3.316) | 1.119(0.801-1.564) | |
| BA+BB VS AA | Overall | 15 | 0.018 | 0.576 | 1.000 | 1.036(0.916-1.172) | 1.010(0.931-1.096) | |
| BA+BB VS AA | Asian | 7 | 0.013 | 0.862 | 1.000 | 1.019(0.828-1.254) | 0.969(0.863-1.090) | |
| BA+BB VS AA | Caucasian | 7 | 0.208 | 0.145 | 1.000 | 1.103(0.930-1.308) | 1.106(0.966-1.267) | |
| BA+BB VS AA | PCR-RFLP | 5 | 0.395 | 0.246 | 1.000 | 1.102(0.932-1.303) | 1.103(0.935-1.300) | |
| BA+BB VS AA | PCR | 3 | 0.482 | 0.74 | 1.000 | 0.964(0.778-1.195) | 0.965(0.779-1.194) | |
| BA+BB VS AA | Taq-Man | 6 | 0.002 | 0.89 | 1.000 | 1.016(0.809-1.277) | 0.975(0.876-1.085) | |
| BA+BB VS AA | HB | 8 | 0.21 | 0.023 | 0.560 | 1.173(0.997-1.381) | 1.167(1.022-1.332) | |
| BA+BB VS AA | PB | 7 | 0.105 | 0.139 | 1.000 | 0.926(0.800-1.073) | 0.925(0.833-1.026) | |
| BA+BB VS AA | RC | 4 | 0.002 | 0.641 | 1.000 | 1.133(0.670-1.918) | 0.897(0.741-1.087) | |
| BA+BB VS AA | GC | 4 | 0.259 | 0.609 | 1.000 | 1.059(0.825-1.359) | 1.054(0.861-1.290) | |
| BA+BB VS AA | CRC | 2 | 0.513 | 0.677 | 1.000 | 0.963(0.806-1.150) | 0.963(0.806-1.150) | |
| BA+BB VS AA | Y | 13 | 0.026 | 0.761 | 1.000 | 1.020(0.899-1.157) | 0.999(0.917-1.088) | |
| BA+BB VS AA | N | 2 | 0.067 | 0.347 | 1.000 | 1.644(0.536-5.038) | 1.152(0.858-1.545) | |
| BB VS BA+AA | Overall | 15 | 0.02 | 0.641 | 1.000 | 1.035(0.897-1.194) | 1.025(0.933-1.126) | |
| BB VS BA+AA | Asian | 7 | 0.662 | 0.773 | 1.000 | 0.981(0.859-1.119) | 0.981(0.860-1.119) | |
| BB VS BA+AA | Caucasian | 7 | 0.001 | 0.356 | 1.000 | 1.174(0.835-1.651) | 1.073(0.915-1.257) | |
| BB VS BA+AA | PCR-RFLP | 5 | 0.04 | 0.464 | 1.000 | 1.149(0.793-1.664) | 1.068(0.862-1.324) | |
| BB VS BA+AA | PCR | 3 | 0.738 | 0.03 | 0.6 | 0.770(0.605-0.979) | 0.767(0.604-0.974) | |
| BB VS BA+AA | Taq-Man | 6 | 0.077 | 0.169 | 1.000 | 1.114(0.927-1.340) | 1.087(0.965-1.225) | |
| BB VS BA+AA | HB | 8 | 0.078 | 0.209 | 1.000 | 1.100(0.877-1.380) | 1.106(0.945-1.295) | |
| BB VS BA+AA | PB | 7 | 0.043 | 0.867 | 1.000 | 0.984(0.813-1.191) | 0.982(0.874-1.104) | |
| BB VS BA+AA | RC | 4 | 0.027 | 0.273 | 1.000 | 1.309(0.809-2.119) | 1.063(0.856-1.321) | |
| BB VS BA+AA | GC | 4 | 0.191 | 0.048 | 0.960 | 0.819(0.592-1.133) | 0.785(0.617-0.998) | |
| BB VS BA+AA | CRC | 2 | 0.834 | 0.613 | 1.000 | 1.054(0.858-1.295) | 1.054(0.859-1.295) | |
| BB VS BA+AA | Y | 13 | 0.018 | 0.823 | 1.000 | 1.017(0.875-1.183) | 1.015(0.922-1.118) | |
| BB VS BA+AA | N | 2 | 0.176 | 0.375 | 1.000 | 1.366(0.668-2.793) | 1.196(0.805-1.776) | |
| rs1805015 | B VS A | Overall | 9 | <0.001 | 0.408 | 1.000 | 0.928(0.777-1.108) | 0.981(0.897-1.072) |
| B VS A | Caucasian | 5 | 0.001 | 0.353 | 1.000 | 0.863(0.633-1.177) | 0.903(0.792-1.031) | |
| B VS A | Asian | 3 | 0.202 | 0.689 | 1.000 | 0.943(0.754-1.179) | 0.967(0.819-1.141) | |
| B VS A | PCR-RFLP | 3 | <0.001 | 0.576 | 1.000 | 0.831(0.435-1.589) | 1.002(0.820-1.224) | |
| B VS A | Taq-Man | 5 | 0.099 | 0.928 | 1.000 | 0.980(0.847-1.134) | 0.995(0.899-1.102) | |
| B VS A | PB | 6 | <0.001 | 0.528 | 1.000 | 0.918(0.703-1.198) | 1.034(0.923-1.157) | |
| B VS A | HB | 3 | 0.207 | 0.15 | 1.000 | 0.903(0.752-1.085) | 0.899(0.777-1.039) | |
| B VS A | Glioma | 4 | <0.001 | 0.364 | 1.000 | 0.788(0.472-1.317) | 0.936(0.778-1.125) | |
| B VS A | CRC | 2 | 0.183 | 0.288 | 1.000 | 1.063(0.856-1.318) | 1.085(0.933-1.261) | |
| B VS A | Y | 8 | <0.001 | 0.436 | 1.000 | 0.923(0.755-1.129) | 0.988(0.899-1.085) | |
| BB VS AA | Overall | 9 | 0.014 | 0.172 | 1.000 | 0.688(0.403-1.176) | 0.788(0.589-1.056) | |
| BB VS AA | Caucasian | 5 | 0.019 | 0.407 | 1.000 | 0.743(0.368-1.501) | 0.745(0.507-1.093) | |
| BB VS AA | Asian | 3 | 0.686 | 0.014 | 0.280 | 0.256(0.080-0.818) | 0.240(0.076-0.752) | |
| BB VS AA | PCR-RFLP | 3 | 0.024 | 0.372 | 1.000 | 0.593(0.189-1.867) | 0.714(0.410-1.243) | |
| BB VS AA | Taq-Man | 5 | 0.047 | 0.527 | 1.000 | 0.807(0.415-1.570) | 0.867(0.610-1.234) | |
| BB VS AA | PB | 6 | 0.013 | 0.098 | 1.000 | 0.461(0.184-1.152) | 0.741(0.500-1.098) | |
| BB VS AA | HB | 3 | 0.093 | 0.468 | 1.000 | 0.942(0.467-1.900) | 0.851(0.549-1.317) | |
| BB VS AA | Glioma | 4 | 0.031 | 0.213 | 1.000 | 0.503(0.170-1.484) | 0.640(0.374-1.095) | |
| BB VS AA | CRC | 2 | 0.417 | 0.194 | 1.000 | 1.395(0.855-2.276) | 1.386(0.847-2.270) | |
| BB VS AA | Y | 8 | 0.025 | 0.072 | 1.000 | 0.602(0.346-1.046) | 0.731(0.540-0.989) | |
| BA VS AA | Overall | 9 | 0.021 | 0.968 | 1.000 | 1.003(0.849-1.185) | 1.028(0.926-1.141) | |
| BA VS AA | Caucasian | 5 | 0.011 | 0.651 | 1.000 | 0.931(0.682-1.271) | 0.933(0.795-1.096) | |
| BA VS AA | Asian | 3 | 0.378 | 0.552 | 1.000 | 1.056(0.884-1.262) | 1.055(0.884-1.261) | |
| BA VS AA | PCR-RFLP | 3 | 0.012 | 0.992 | 1.000 | 1.003(0.551-1.824) | 1.132(0.885-1.447) | |
| BA VS AA | Taq-Man | 5 | 0.134 | 0.706 | 1.000 | 1.007(0.859-1.181) | 1.023(0.909-1.151) | |
| BA VS AA | PB | 6 | 0.044 | 0.522 | 1.000 | 1.074(0.863-1.338) | 1.113(0.978-1.267) | |
| BA VS AA | HB | 3 | 0.301 | 0.186 | 1.000 | 0.889(0.734-1.078) | 0.889(0.746-1.059) | |
| BA VS AA | Glioma | 4 | 0.012 | 0.814 | 1.000 | 0.946(0.595-1.504) | 1.046(0.839-1.305) | |
| BA VS AA | CRC | 2 | 0.054 | 0.622 | 1.000 | 0.991(0.682-1.440) | 1.046(0.875-1.250) | |
| BA VS AA | Y | 8 | 0.03 | 0.704 | 1.000 | 1.035(0.868-1.234) | 1.058(0.948-1.182) | |
| BA+BB VS AA | Overall | 9 | 0.003 | 0.683 | 1.000 | 0.962(0.801-1.157) | 1.004(0.908-1.110) | |
| BA+BB VS AA | Caucasian | 5 | 0.002 | 0.477 | 1.000 | 0.885(0.632-1.240) | 0.911(0.781-1.062) | |
| BA+BB VS AA | Asian | 3 | 0.272 | 0.902 | 1.000 | 0.998(0.809-1.231) | 1.011(0.848-1.205) | |
| BA+BB VS AA | PCR-RFLP | 3 | 0.001 | 0.738 | 1.000 | 0.889(0.446-1.773) | 1.069(0.847-1.351) | |
| BA+BB VS AA | Taq-Man | 5 | 0.109 | 0.877 | 1.000 | 0.992(0.844-1.165) | 1.009(0.900-1.132) | |
| BA+BB VS AA | PB | 6 | 0.004 | 0.96 | 1.000 | 0.993(0.765-1.291) | 1.078(0.950-1.222) | |
| BA+BB VS AA | HB | 3 | 0.258 | 0.154 | 1.000 | 0.886(0.728-1.079) | 0.885(0.748-1.047) | |
| BA+BB VS AA | Glioma | 4 | 0.001 | 0.535 | 1.000 | 0.845(0.496-1.440) | 0.987(0.799-1.219) | |
| BA+BB VS AA | CRC | 2 | 0.083 | 0.433 | 1.000 | 1.025(0.740-1.420) | 1.072(0.902-1.274) | |
| BA+BB VS AA | Y | 8 | 0.002 | 0.814 | 1.000 | 0.976(0.796-1.197) | 1.024(0.920-1.139) | |
| BB VS BA+AA | Overall | 9 | 0.039 | 0.18 | 1.000 | 0.717(0.441-1.167) | 0.788(0.590-1.052) | |
| BB VS BA+AA | Caucasian | 5 | 0.049 | 0.414 | 1.000 | 0.772(0.415-1.437) | 0.764(0.523-1.115) | |
| BB VS BA+AA | Asian | 3 | 0.699 | 0.014 | 0.280 | 0.254(0.080-0.812) | 0.239(0.076-0.749) | |
| BB VS BA+AA | PCR-RFLP | 3 | 0.08 | 0.221 | 1.000 | 0.625(0.249-1.571) | 0.710(0.411-1.228) | |
| BB VS BA+AA | Taq-Man | 5 | 0.058 | 0.425 | 1.000 | 0.823(0.433-1.566) | 0.867(0.611-1.231) | |
| BB VS BA+AA | PB | 6 | 0.041 | 0.086 | 1.000 | 0.493(0.220-1.105) | 0.723(0.489-1.068) | |
| BB VS BA+AA | HB | 3 | 0.101 | 0.545 | 1.000 | 0.970(0.489-1.922) | 0.875(0.567-1.349) | |
| BB VS BA+AA | Glioma | 4 | 0.094 | 0.099 | 1.000 | 0.549(0.225-1.341) | 0.640(0.376-1.088) | |
| BB VS BA+AA | CRC | 2 | 0.32 | 0.234 | 1.000 | 1.357(0.834-2.208) | 1.347(0.825-2.202) | |
| BB VS BA+AA | Y | 8 | 0.081 | 0.038 | 0.760 | 0.639(0.395-1.033) | 0.727(0.539-0.982) | |
| rs2057768 | B VS A | Overall | 3 | 0.191 | 0.218 | 1.000 | 1.115(0.923-1.348) | 1.093(0.949-1.260) |
| B VS A | Taq-Man | 2 | 0.07 | 0.305 | 1.000 | 1.178(0.806-1.721) | 1.102(0.915-1.327) | |
| B VS A | PB | 2 | 0.606 | 0.644 | 1.000 | 1.037(0.889-1.210) | 1.037(0.889-1.210) | |
| B VS A | GC | 2 | 0.152 | 0.095 | 1.000 | 1.218(0.907-1.638) | 1.173(0.973-1.414) | |
| BB VS AA | Overall | 3 | 0.032 | 0.96 | 1.000 | 1.019(0.488-2.129) | 0.898(0.616-1.307) | |
| BB VS AA | Taq-Man | 2 | 0.022 | 0.642 | 1.000 | 1.321(0.408-4.274) | 1.078(0.676-1.717) | |
| BB VS AA | PB | 2 | 0.742 | 0.117 | 1.000 | 0.709(0.459-1.095) | 0.707(0.458-1.090) | |
| BB VS AA | GC | 2 | 0.013 | 0.745 | 1.000 | 1.245(0.331-4.678) | 1.024(0.625-1.678) | |
| BA VS AA | Overall | 3 | 0.552 | 0.009 | 0.180 | 1.288(1.067-1.555) | 1.288(1.067-1.554) | |
| BA VS AA | Taq-Man | 2 | 0.72 | 0.183 | 1.000 | 1.183(0.924-1.516) | 1.183(0.924-1.516) | |
| BA VS AA | PB | 2 | 0.276 | 0.015 | 0.300 | 1.290(1.032-1.611) | 1.289(1.051-1.581) | |
| BA VS AA | GC | 2 | 0.672 | 0.008 | 0.160 | 1.401(1.091-1.798) | 1.401(1.091-1.798) | |
| BA+BB VS AA | Overall | 3 | 0.495 | 0.028 | 0.560 | 1.226(1.023-1.470) | 1.226(1.023-1.470) | |
| BA+BB VS AA | Taq-Man | 2 | 0.303 | 0.191 | 1.000 | 1.176(0.918-1.507) | 1.171(0.924-1.484) | |
| BA+BB VS AA | PB | 2 | 0.358 | 0.084 | 1.000 | 1.190(0.977-1.450) | 1.190(0.977-1.450) | |
| BA+BB VS AA | GC | 2 | 0.725 | 0.016 | 0.320 | 1.343(1.056-1.709) | 1.343(1.056-1.709) | |
| BB VS BA+AA | Overall | 3 | 0.021 | 0.82 | 1.000 | 0.916(0.429-1.955) | 0.797(0.553-1.148) | |
| BB VS BA+AA | Taq-Man | 2 | 0.021 | 0.734 | 1.000 | 1.219(0.389-3.820) | 0.998(0.635-1.569) | |
| BB VS BA+AA | PB | 2 | 0.557 | 0.031 | 0.610 | 0.634(0.415-0.967) | 0.628(0.412-0.957) | |
| BB VS BA+AA | GC | 2 | 0.007 | 0.904 | 1.000 | 1.090(0.268-4.429) | 0.870(0.539-1.403) |
PH: P value of Q test for heterogeneity test; PZ: means statistically significant (P < 0.05); PAdjust: Multiple testing P value according to Bonferroni Correction; CRC: Colorectal cancer; GC: Gastric cancer; BC: Breast cancer; UBC: Bladder cancer; CC: Cervical cancer; PC: Pancreatic cancer; RC: Renal cancer; NPC: nasopharyngeal carcinoma; HL: Hodgkin's lymphoma; H-B: Hospital based; P-B: Population based; HWE: Hardy Weinberg Equilibrium; Padjust value less than 0.05*(4 polymorphisms* 5 models) was considered as statistically significant, which was marked with bold font in the table). Note: Heterogeneity was considered to be significant when the P-value was less than 0.1. If there was no significant heterogeneity, a fixed effect model (Der-Simonian Laird) was used to evaluate the point estimates and 95% CI; otherwise, a random effects model (Der-Simonian Laird) was used. And the Pz was calculated based on the actual model adopted.
Meta-analysis of the association between IL-4R rs1801275 polymorphism and overall cancer risk.
Sensitivity analysis and publication bias
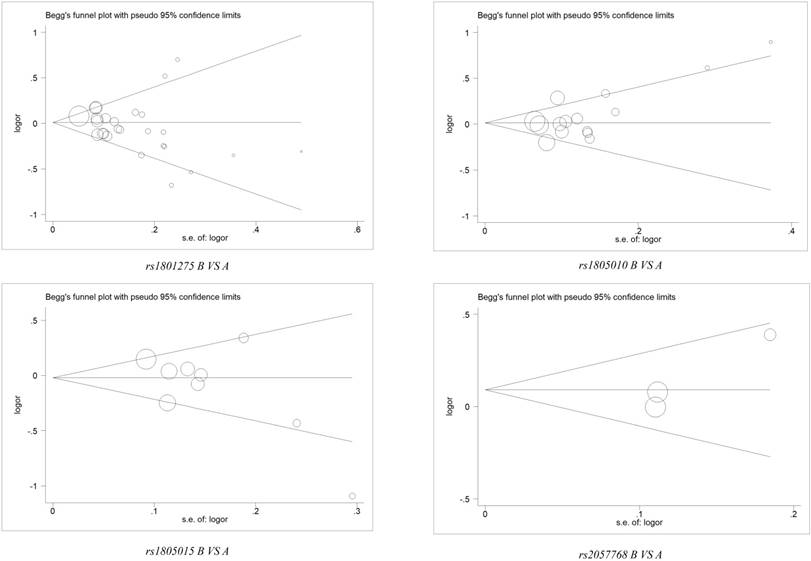
Sensitivity analysis was applied to assess the impaction of the individual studies on the integrated data by removing a single data from the pooled analysis every time for each polymorphism. We uncovered that there was no individual study influenced the result of pooled ORs (Figure 3 and Table S3). Furthermore, Begg's funnel plot and Egger's test was conducted to evaluate the publication bias, and no significant evidence of distinct asymmetry was disclosed through the shapes of the funnel plots, as well as the value of P > |t| in Egger's test (Figure 4 and Table S4).
Begg's funnel plot for publication bias test under 4 polymorphisms of IL-4R gene (B vs. A). The x-axis is log (OR), and the y-axis is natural logarithm of OR. The horizontal line in the figure represents the overall estimated log (OR). The two diagonal lines indicate the pseudo 95% confidence limits of the effect estimate.
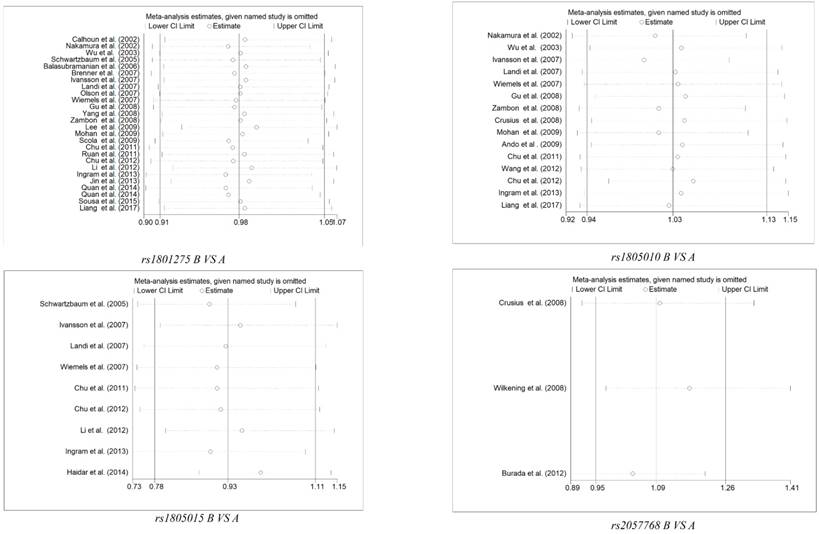
Sensitivity Analysis of Overall ORs Co-Efficients for 4 polymorphisms of Il-4R gene (B vs. A). Results were calculated by omitting each study in turn. The two ends of the dotted lines represent the 95% CIs.
LD Analyses across Populations and in-silico analysis of IL-4R expression
For better understanding the quantitative synthesis, LD analysis was performed to test the presence or absence of bins in the region containing these polymorphisms in IL-4R. LD plots for polymorphisms in IL-4R genes were presented in Figure S4. Highlighted, there is significant LD between rs1805010 and rs1801275 in CEU and JPT populations (CEU: r2= 0.7; JPT: r2= 0.67).
In-silico results indicated that the expression of IL-4R in colon adenocarcinoma was higher than that in normal colon tissue (Transcripts Per Kilo base Million (TPM) =41.6 vs. 60.0, P < 0.01), as well as in rectum adenocarcinoma (TPM=43.6 vs. 58.4, P < 0.01), kidney Chromophobe (TPM=6.47 vs. 21.8, P < 0.01), kidney renal clear cell carcinoma (TPM=43.7 vs. 18.2, P < 0.01), and pancreatic adenocarcinoma (TPM=62.4 vs. 4.99, P < 0.01). All the result is shown in Figure S5.
Discussion
At present, the identification of novel genetic and molecular predictors is desiderata, in order to successfully early diagnose or prevent the malignancies. Several biomarks are reported might be associated with tumorigenesis. IL4R, which encodes the alpha chain of the IL-4R, can bind IL-4 and IL-13 contributing to the regulation of IgE production[46], one soluble form of the encoded protein can restrain IL-4 mediated cell proliferation. Enormous genetic studies have uncovered that several SNPs in IL-4R gene were identified to be significantly associated with many diseases, including cancers [47]. These SNPs have the ability to regulate the efficacy of gene expressions, interfere with the synthesis of the protein, disrupt signaling pathways and result in the instabilities of the exonic mRNA [47, 48].
The recent study has suggested that rs1801275 polymorphism in the IL-4R gene can predict 2.29-fold glioblastoma susceptibility by the over-dominant model[34], a result consistent with a previous study that rs1801275 contributed to an increased susceptibility of glioblastoma (OR = 1.61, 95% CI, 1.05-2.47) in a population-based study[11]. However, Li et al. indicated that the mutant G allele plays a protective function in tumorigenesis (OR=0.71, 95%CI, 0.50-0.99) [12]. Moreover, a significantly increased susceptibility of gastric cancer was identified in the IL-4R rs1805010 polymorphism in a Caucasian population[26], which was not consistent with previous investigations that no association of SNPs in IL-4R gene and gastric cancer susceptibility were displayed in Taiwan [20]and Japanese[39] populations. And in a separate research, Chu et al. [9] identified that IL-4R rs1805010 polymorphism was associated with a significantly decreased susceptibility of renal cell carcinoma. A large number of case-control studies have elaborated the association between these polymorphisms in IL-4R and the susceptibility of a variety of cancer types, data from these publications remained inconsistent and controversial.
Meta-analysis is a validated method, by which we can enlarge the effective sample size via pooling the data from the separate related case-control studies. Besides, the statistical power for estimation of the genetic effects was also enhanced [49]. There are several previous meta-analyses also concerned about IL-4R and tumorigenesis. Cho et al.[50] demonstrated a reduced risk of GC for rs1801275, but they mixed the gastric cancer, esophageal cancer, pancreatic cancer and colorectal cancer, without any subgroup analysis of cancer type. Wang et al.[51] performed a meta-analysis about IL-4R and cancer risk on rs1801275, rs1805010 and rs1805015, however, they only enrolled 36 studies, and didn't adjust the P value of Q-test, which might lead to statistical error.
All in all, our recent updated meta-analysis draw a comprehensive, precise and convincible result, which is that rs1801275, rs1805010, rs1805015 and rs2057768 polymorphisms of IL-4R are not associated with tumorigenesis. The advantages of this research should not be buried. Firstly, a comprehensive search was conducted to identify more qualified studies, this analysis is persuasive and substantive. Secondly, the quality of each registered research was evaluated by NOS scale, low-quality studies were eliminated to raise the credibility of results. Thirdly, stratification analysis was performed by ethnicity, source of controls, tumor type or race, in order to decrease the impact of heterogeneity and obtain the real conclusion. Fourthly, Bonferroni corrections formula was used to adjust the results of polymorphism, ensuring avoid overstating results. Fifthly, sensitivity analysis was presented to confirm the stability of conclusion calculated from these studies, and Egger's test and Begg's funnel plot was carried out to detect publication bias. Nevertheless, there are still several limitations that should be mentioned. Firstly, we have enrolled some small size case-control studies that contained small-scale numbers of the cases and controls. Thus, an insufficient capacity that slight effects on cancer susceptibility occurred when a stratified analysis was conducted by the cancer type, ethnicity, source of control, genotyping method and etc. Secondly, the controls were not accordant defined, part of them was population-based and the others were hospital-based. Therefore, when the polymorphism was predicted to influence the susceptibility of other diseases, the controls may not invariably be represented in the potential source populations. Thirdly, the majority of the enrolled studies were Caucasian groups, and no African data were available. Fourth, since the lack of raw data, such as smoking and drinking status, we are unable to perform a further assessment for the potential gene-gene and gene-environment interactions.
In conclusion, our work suggested that no significant association was identified between IL-4R polymorphisms and cancer susceptibility. Further well-designed studies with large sample sizes will be continued on this issue of interest.
Abbreviations
Abbreviation: Full name; IL-4R: Interleukin-4 receptor; IL-4: Interleukin-4; ORs: Odds ratios; CIs: Confidence intervals; SNP: Single nucleotide polymorphism; HWE: Hardy-Weinberg equilibrium; NOS: Newcastle-Ottawa Scale; LD: Linkage Disequilibrium; TPM: Transcripts Per Kilobase Million.
Supplementary Material
Supplementary figures and tables.
Acknowledgements
All authors agreed to publish this work and contributed to the design, data extraction, data analysis, chart drawing drafting, and revising of the article. All authors are committed to being responsible for their work. Y.Q. and Z.T. accessed information from literature for this article.Y.Q., S.F., L.Z. and C.L. contributed towards writing, discussing, and editing the manuscript. Y.Q. and C.L. reviewed the manuscript.
Competing Interests
The authors have declared that no competing interest exists.
References
1. Roser M, Ritchie H. Cancer. OurWorldInData.org.: Max Roser and Hannah Ritchie. 2018
2. Ferlay J, Soerjomataram I, Dikshit R, Eser S, Mathers C, Rebelo M. et al. Cancer incidence and mortality worldwide: sources, methods and major patterns in GLOBOCAN 2012. Int J Cancer. 2015;136:E359-86
3. Pharoah PD, Dunning AM, Ponder BA, Easton DF. Association studies for finding cancer-susceptibility genetic variants. Nat Rev Cancer. 2004;4:850-60
4. Imyanitov EN. Gene polymorphisms, apoptotic capacity and cancer risk. Hum Genet. 2009;125:239-46
5. Nakamura E, Megumi Y, Kobayashi T, Kamoto T, Ishitoya S, Terachi T. et al. Genetic polymorphisms of the interleukin-4 receptor alpha gene are associated with an increasing risk and a poor prognosis of sporadic renal cell carcinoma in a Japanese population. Clin Cancer Res. 2002;8:2620-5
6. Formentini A, Braun P, Fricke H, Link KH, Henne-Bruns D, Kornmann M. Expression of interleukin-4 and interleukin-13 and their receptors in colorectal cancer. Int J Colorectal Dis. 2012;27:1369-76
7. Levey AS, Stevens LA, Schmid CH, Zhang YL, Castro AF 3rd, Feldman HI. et al. A new equation to estimate glomerular filtration rate. Annals of internal medicine. 2009;150:604-12
8. Olson S, Simon J, Orlow I, Tommasi D, Roy P, Bayuga S. et al. Allergies, variants in IL-4 and IL-4Rα genes, and risk of pancreatic cancer. Cancer Detection & Prevention. 2007;31:345-51
9. Chu H, Wang M, Yan F, Zhong D, Shi D, Ma L. et al. Polymorphisms in the IL-13 and IL-4R genes are associated with the development of renal cell carcinoma. Ann Oncol. 2012;23:2114-21
10. Chen X, Chen Z, Wang H, Xiong X, Liu X, Hu C. et al. Plasmid pUDK-HGF encoding human hepatocyte growth factor gene attenuates gentamicin-induced kidney injury in rats. Exp Toxicol Pathol. 2013;65:541-7
11. Schwartzbaum J, Ahlbom A, Malmer B, Lönn S, Brookes AJ, Doss H. et al. Polymorphisms Associated with Asthma Are Inversely Related to Glioblastoma Multiforme. Cancer Res. 2005;65:6459-65
12. Li S, Jin T, Zhang J, Lou H, Yang B, Li Y. et al. Polymorphisms of TREH, IL4R and CCDC26 genes associated with risk of glioma. Cancer Epidemiology. 2012;36:283-7
13. Bonferroni CE. Teoria Statistica Delle Classi e Calcolo Delle Probabilità. Comm Firenze. 1936;1936:216-8
14. Lau J, Ioannidis JP, Schmid CH. Quantitative synthesis in systematic reviews. Annals of internal medicine. 1997;127:820-6
15. R D, N L. Meta-analysis in clinical trials. Controlled Clinical Trials. 1986;7:177
16. Begg CB, Mazumdar M. Operating characteristics of a rank correlation test for publication bias. Biometrics. 1994;50:1088-101
17. Higgins JP, Thompson SG. Quantifying heterogeneity in a meta-analysis. Stat Med. 2002;21:1539-58
18. Tang Z, Li C, Kang B, Gao G, Li C, Zhang Z. GEPIA: a web server for cancer and normal gene expression profiling and interactive analyses. Nucleic Acids Res. 2017;45:W98-W102
19. Calhoun ES, Mcgovern RM, Janney CA, Cerhan JR, Iturria SJ, Smith DI. et al. Host genetic polymorphism analysis in cervical cancer. Clin Chem. 2002;48:1218-24
20. MS W, CY W, CJ C, MT L, CT S, JT L. Interleukin-10 genotypes associate with the risk of gastric carcinoma in Taiwanese Chinese. Int J Cancer. 2003;104:617-23
21. Balasubramanian SP, Azmy IA, Higham SE, Wilson AG, Cross SS, Cox A. et al. Interleukin gene polymorphisms and breast cancer: a case control study and systematic literature review. Bmc Cancer. 2006;6:188
22. Brenner AV, Butler MA, Wang SS, Ruder AM, Rothman N, Schulte PA. et al. Single-nucleotide polymorphisms in selected cytokine genes and risk of adult glioma. Carcinogenesis. 2007;28:2543-7
23. Ivansson EL, Gustavsson IM, Magnusson JJ, Steiner LL, Magnusson PK, Erlich HA. et al. Variants of chemokine receptor 2 and interleukin 4 receptor, but not interleukin 10 or Fas ligand, increase risk of cervical cancer. Int J Cancer. 2007;121:2451-7
24. Landi S, Bottari F, Gemignani F, Gioia-Patricola L, Guino E, Osorio A. et al. Interleukin-4 and interleukin-4 receptor polymorphisms and colorectal cancer risk. Eur J Cancer. 2007;43:762-8
25. Gu F, Qureshi AA, Niu T, Kraft P, Guo Q, Hunter DJ. et al. Interleukin and interleukin receptor gene polymorphisms and susceptibility to melanoma. Melanoma Res. 2008;18:330-5
26. Zambon CF, Basso D, Marchet A, Fasolo M, Stranges A, Schiavon S. et al. IL-4 -588C>T polymorphism and IL-4 receptor alpha [Ex5+14A>G; Ex11+828A>G] haplotype concur in selecting H. pylori cagA subtype infections. Clin Chim Acta. 2008;389:139-45
27. Yang H, Gu J, Lin X, Grossman HB, Ye Y, Dinney CP. et al. Profiling of genetic variations in inflammation pathway genes in relation to bladder cancer predisposition. Clin Cancer Res. 2008;14:2236-44
28. Mohan S, Mohanasenthil, Paul SF, Shroff S, Venkatesan V. Interleukin-4-receptor alpha gene polymorphism and the risk of renal cell carcinoma in a South Indian population. Asian Pac J Cancer Prev. 2009;10:295-8
29. Lee YS, Choi HB, Lee IK, Kim TG, Oh ST. Association between interleukin-4R and TGF-β1 gene polymorphisms and the risk of colorectal cancer in a Korean population. Colorectal Disease. 2010;12:1208-12
30. Scola L, Giacalone A, Marasà L, Mirabile M, Vaccarino L, Forte GI. et al. Genetic Determined Downregulation of Both Type 1 and Type 2 Cytokine Pathways Might Be Protective against Pancreatic Cancer. Ann Ny Acad Sci. 2010;1155:284-8
31. Ruan Z, Zhao Y, Yan L, Chen H, Fan W, Chen J. et al. Single nucleotide polymorphisms in IL-4Ra, IL-13 and STAT6 genes occurs in brain glioma. Frontiers in Bioscience. 2011;3:33-45
32. Chu H, Ma L, Wang M, Shi D, Qin C, Yuan L. et al. The polymorphisms of IL-4, IL-4R and IL-13 genes and bladder cancer risk in a Chinese population: a case-control study. Mol Biol Rep. 2012;39:5349-57
33. Ingram N, Northwood EL, Perry SL, Marston G, Snowden H, Taylor JC. et al. Reduced type II interleukin-4 receptor signalling drives initiation, but not progression, of colorectal carcinogenesis: evidence from transgenic mouse models and human case-control epidemiological observations. Carcinogenesis. 2013;34:2341-9
34. Jin T, Li X, Zhang J, Hong W, Geng T, Gang L. et al. Genetic association between selected cytokine genes and glioblastoma in the Han Chinese population. Bmc Cancer. 2013;13:236
35. Quan L, Gong Z, Yao S, Bandera EV, Zirpoli G, Hwang H. et al. Cytokine and cytokine receptor genes of adaptive immune response are differentially associated with breast cancer risk in American women of African and European ancestry. Int J Cancer. 2014;134:1408-21
36. Sousa H, Mesquita L, Ribeiro J, Catarino R, Breda E, Medeiros R. Polymorphisms in host immune response associated genes and risk of nasopharyngeal carcinoma development in Portugal. Immunobiology. 2016;221:145-52
37. Liang G, Liu Q, Sun J, Liu W, Shen W. The rs20541 G>A polymorphism in the interleukin 13 gene is associated with a decreased risk of renal cell carcinoma in a Chinese population. 2017; 10(1): 708-16.
38. Wiemels J, Wiencke J, Kt, Moghadassi M, Rice T, Urayama K, Miike R. et al. Allergy-related polymorphisms influence glioma status and serum IgE levels. Cancer Epidemiol Biomarkers Prev. 2007;16:1229-35
39. Ando T, Ishikawa T, Kato H, Yoshida N, Naito Y, Kokura S. et al. Synergistic effect of HLA class II loci and cytokine gene polymorphisms on the risk of gastric cancer in Japanese patients with Helicobacter pylori infection. Int J Cancer. 2009;125:2595-602
40. Xinru W, Li L, Huang T, Li H. Relationship of TGF-β and IL-4R gene polymorphisms with risk of classical Hodgkin lymphoma. Chinal Journal of Hematology. 2012;33:1015-9
41. Shamran HA, Hamza SJ, Yaseen NY, Al-Juboory AA, Taub DD, Price RL. et al. Impact of single nucleotide polymorphism in IL-4, IL-4R genes and systemic concentration of IL-4 on the incidence of glioma in Iraqi patients. Int J Med Sci. 2014;11:1147-53
42. Crusius JB, Canzian F, Capella G, Pena AS, Pera G, Sala N. et al. Cytokine gene polymorphisms and the risk of adenocarcinoma of the stomach in the European prospective investigation into cancer and nutrition (EPIC-EURGAST). Ann Oncol. 2008;19:1894-902
43. Wilkening S, Tavelin B, Canzian F, Enquist K, Palmqvist R, Altieri A. et al. Interleukin promoter polymorphisms and prognosis in colorectal cancer. Carcinogenesis. 2008;29:1202-6
44. FB CA, PM TC, MC AS. et al. Interleukin-4 receptor -3223T→C polymorphism is associated with increased gastric adenocarcinoma risk. 2012; 26: 532-6.
45. Wells M, Chande N, Adams P, Beaton M, Levstik M, Boyce E. et al. Meta-analysis: vasoactive medications for the management of acute variceal bleeds. Aliment Pharmacol Ther. 2012;35:1267-78
46. Choi WA, Kang MJ, Kim YJ, Seo JH, Kim HY, Kwon JW. et al. Gene-gene interactions between candidate gene polymorphisms are associated with total IgE levels in Korean children with asthma. J Asthma. 2012;49:243-52
47. Howell WM, Rose-Zerilli MJ. Cytokine gene polymorphisms, cancer susceptibility, and prognosis. J Nutr. 2007;137:194S-9S
48. Aldred MA, Eng C. SNP'ing at nasopharyngeal cancer susceptibility: for whom the bell TOLLs. Cancer Biol Ther. 2006;5:1292-3
49. Peng H, Zhou M, Xu WD, Xu K, Zhai Y, Li R. et al. Association of PTPN22 C1858T polymorphism and type 1 diabetes: a meta-analysis. Immunol Invest. 2012;41:484-96
50. Cho YA, Kim J. Association of IL4, IL13, and IL4R polymorphisms with gastrointestinal cancer risk: A meta-analysis. J Epidemiol. 2017;27:215-20
51. Wang JY, Zhou YQ, Li XX, Jin X, Wang LL, Lei L. et al. Associations between three polymorphisms in the interleukin-4 receptor gene and risk of cancer: a meta-analysis. Asian Pac J Cancer Prev. 2012;13:6227-32
Author contact
![]() Corresponding author: Yong Qi, MD; Department of Emergency Surgery, The First Affiliated Hospital of Anhui University of Chinese Medicine, No.117, Meishan Road, Hefei, 230009, Hefei, Anhui, China. Tel.: +86 15755188582; Email: 513101519com
Corresponding author: Yong Qi, MD; Department of Emergency Surgery, The First Affiliated Hospital of Anhui University of Chinese Medicine, No.117, Meishan Road, Hefei, 230009, Hefei, Anhui, China. Tel.: +86 15755188582; Email: 513101519com