3.2
Impact Factor
ISSN: 1837-9664
J Cancer 2019; 10(8):1855-1861. doi:10.7150/jca.28476 This issue Cite
Research Paper
BTF3 Silencing Inhibits the Proliferation of Osteosarcoma Cells
1. Department of General Surgery, People's Hospital of Hunan Province, First Affiliated Hospital of Hunan Normal University, Changsha 410005, Hunan Province, China
2. Department of Orthopedic Surgery, Traumatology and Orthopedics Hospital of Liuyang, Liuyang 410300, Hunan Province, China
3. Department of Orthopedic Surgery, The Second Xiangya Hospital, Central South University, Changsha 410005, Hunan Province, China
Received 2018-7-11; Accepted 2019-2-22; Published 2019-4-21
Abstract
Osteosarcoma (OS) is one of the bone malignancy cancers with poor prognosis in the early stages worldwide. Basic transcription factor 3 (BTF3) is associated with the development of several types of cancer. The present study aimed to evaluate the role of BTF3 in OS. Silencing of BTF3 was achieved by using stable lentivirus transfection of siRNA targeting BTF3 in the human OS cell line Saos-2. Cell viability and colony-forming ability were measured using methyl-thaizolyl-tetrazolium (MTT) and colony formation assays, respectively. Propidium iodide staining and flow cytometry was used to detect the progression of the cell cycle. To evaluate the possible intracellular signaling molecules involved, a PathScan Intracellular Signaling Array Kit was utilized. Lentivirus-BTF3-shRNA (LV-BTF3-shRNA) suppressed expression of BTF3 in Saos-2 cells (inhibition ratio: 89.8%), which significantly inhibited cell proliferation (48.5%), colony formation and enhanced apoptosis to 48.2% compared to 4.5% with lentivirus control shRNA (N-shRNA). Additionally, BTF3 silencing enhanced the percentage of Saos-2 cells in S and G2/M phases, but significantly reduced cells in the G0/M phase (all P < 0.01). The proteins activated by BTF3 included STAT3, S6 ribosomal protein, HSP27 and SAPK/JNK2, all of which were inhibited by BTF3 silencing, whereas SAPK/JNK1 was upregulated by BTF3 silencing. In the present study, we explored the crucial role of BTF3 in promoting OS cell proliferation as well as laying the foundations for further research to investigate the clinical potential of lentivirus-mediated delivery of BTF3 interruption therapy for the treatment of OS.
Keywords: osteosarcoma, basic transcription factor 3, Saos-2, STAT3, S6 ribosomal protein, HSP27
Introduction
Osteosarcoma (OS) is a malignant cancer that affects rapidly proliferating bones, and has a poor prognosis. [1, 2] The main treatment is surgery with adjuvant chemotherapy when the 5-year survival rate is approximately 70%. Unfortunately, about 30% of the patients will deteriorate because tumor cells (metastases) will migrate to the lungs through the pulmonary circulation, where they attach to small blood vessels. [3-5] Therefore it will be important to identify novel biomarkers that can be used to determine which patients with OS will most likely respond to chemotherapy, and thus increase their survival times.
Basic transcription factor 3 (BTF3) was first identified in HeLa cells and has been reported to play a vital role in RNA polymerase class B promotion. [6] From the peptide sequences of BTF3, two complementary DNAs have been cloned. Increasing evidence has shown that BTF3, acting a transcription factor, is an important player in initiating the development of a number cancer types including gastric [7] and prostate cancer, [8] and pancreatic ductal adenocarcinoma. [9] It is known that BTF3 is necessary for the epithelial-mesenchymal transition and cell proliferation through its regulation of JAK2/STAT3 and FOXM1 signaling pathways in gastric carcinoma. [10] BTF3 has also been linked with stimulation of cell proliferation, a decrease in the regulation of the cell cycle, and also apoptosis. [7] However, BTF3 regulation in OS remains to be eludidated.
The aims of the present study were to explore the relationships between BTF3 and OS, and to characterize further the signaling pathways involved.
Methods and Materials
Culture of cells
OS cell lines including human U-2OS, MG-63, Saos-2 and HOS were obtained from the American Type Culture Collection (Rockville, US) and grown in Dulbecco's modified Eagle's medium containing fetal bovine serum at a concentration of 10% (16000-044, Gibco), and maintained in a chamber with a 5% (v/v) CO2 humid atmosphere at 37°C.
Transfection with lentivirus-BTF3-shRNA
GFP-labelled lentivirus BTF3-shRNA and negative shRNA controls were purchased from Shanghai Genechem (Shanghai, China). Once Saos-2 cells reached a density of 50-80%, they were infected with lentivirus-BTF3-shRNA (LV-BTF3-shRNA) (sense: GCCGAAGAAGCCTGGGAATCA, antisense: TGATTCCCAGGCTTCTTCGGC) or lentivirus negative control shRNA (N-shRNA) (sense: TTCTCCGAACGTGTCACGT, antisense: ACGTGACACGTTCGGAGAA) sourced from Genechem (Shanghai, China), in antibiotic-free and serum-free Opti-MEM culture medium. The MOI was 10. Three days after transfection the cells were harvested for other experiments.
Analysis using RT-PCR
Cultured human U-2OS, MG-63, Saos-2 and HOS cells were centrifuged for 5 min at 2,000 r/min and the precipitates were mixed with 1 mL of Trizol. After 5 min allowed for settlement, 200 μL chloroform and 600 μL of isopropyl alcohol were added. After extraction with phenol/chloroform and ethanol precipitation, the RNA was re-dissolved in RNase-free H2O and concentrations were measured with a NanoDrop 2000/2000C spectrophotometer (Thermo Scientific). Each RNA sample was reverse transcribed into cDNA using random hexamers and Moloney-murine leukemia virus (M-MLV) reverse transcriptase (Life Technologies) following the manufacturer's instructions. After PCR, the products were separated on 2% agarose gels and visualized by Midori Green (NIPPON Genetics) staining on a UV transilluminator (Alpha Innotech Corporation).
Quantitative real-time PCR (RT-qPCR) was performed using SYBR Green Supermix and Premix Ex TaqTM kits (Takara, Dalian, China). ABI PRISM 7900 HT Sequence Detection System (Applied Biosystems) and LightCycler 480 (Roche Diagnostics) were used for quantifications. A quantity of 2 µL was mixed with 6 µL SYBR Green reaction master mix, 5 µM forward and 5 µM reverse primers (Table 1). PCR comprised 40 cycles consisting of 5 sec at 95°C and 30 sec at 60°C. GADPH was used as the internal reference to normalize the samples and relative expression level of mRNAs were determined by the (2-△△ Ct) method.
Sequences of RT-PCR Primers
| Primers | Sense |
|---|---|
| BTF3 | P+: 5'-GCGAACACTTTCACCATTACAG-3' |
| P-: 5'-AACTTCATCATCATCATCCTCTCC-3' | |
| GAPDH | P+: 5'-TGACTTCAACAGCGACACCCA-3' |
| P-: 5'-CACCCTGTTGCTGTAGCCAAA-3' |
Assay to determine the viability of cells
An MTT assay was performed to establish cell viability following the protocol supplied by the kit manufacturer (Sigma, USA).
Fluorescein isothiocyanate (FITC)-labeled annexin V staining (annexin V-FITC)
After Saos-2 (1 × 10⁶) cells were transfected for 72 h, the apoptosis of Saos-2 cells was detected by single annexin V-FITC (5 μL) staining (BD Biosciences, New York, USA). The Saos-2 cells were subsequently maintained for 15 min at 17°C and then analyzed using flow cytometry (BD Biosciences).
Cell-cycle assays
Saos-2 cells were counted using flow cytometry and then seeded onto culture plates (6 wells, 1 × 10⁵ cells per well) for analysis of the cell cycle. The incubation medium was changed after 24 h to DMEM containing 1% FBS, which rendered the cells quiescent for 24 h. Saos-2 cells were then subjected to a number of treatments and after 24 h the cells were gently fixed by adding 80% ethanol, and then stored in a freezer for 2 h. Next, the cells were placed in an ice bath and exposed for 5 min to 0.25% triton X-100 before being resuspended in 300 mL of PBS solution that contained 0.1 mg/mL of RNase and 40 mg/mL of propidium iodide. The cells were then incubated for 20 min at room temperature in a darkroom before analysis of the cell cycle with a FACScan flow cytometer and FlowJo software, ver. 7.1.0 (Tree Star, US). At least 10,000 cells were counted for each measurement.
Assay to detect the formation of colonies
After infection of Saos-2 cells with lentivirus for 72 h, they were cultivated at 500 cells per well and 750 cells per well, respectively in volumes of 2 mL each and the medium was changed every 72 h, The cells were rinsed with PBS and then fixed in paraformaldehyde (4%) after being cultured for 8 days. Then the cells were stained with crystal violet stain (20 min exposure) and the number of colonies counted using Image J, with the aid of a light/fluorescence microscope.
Intracellular signalling assay
Lysates of cells were constituted as previously described (vide infra). Intracellular signaling molecule levels were measured using a PathScan Intracellular Signaling Array Kit.
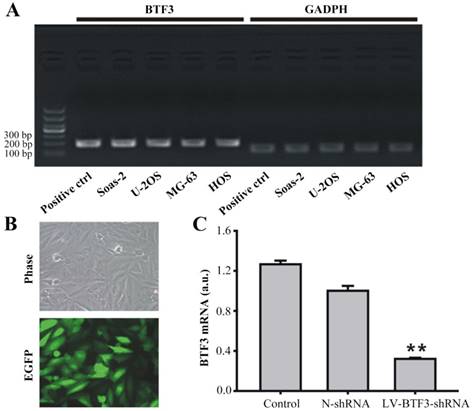
Effect of LV-BTF3-shRNA on BTF3 expression in Saos-2 cells. (A) BTF3 mRNA expression was found in Saos-2, U-2OS, MG-63 and HOS cells detected by PCR. (B) LV-BTF3-shRNA labelled with enhanced GFP was successfully transfected into Saos-2 cells (×200). (C) LV-BTF3-shRNA silenced the transcription of BTF3 mRNA in Saos-2 cells. Data are presented as the mean ± SEM of 3 independent experiments performed in triplicate. **P < 0.01, LV-BTF3-shRNA vs N-shRNA.
Western blot analyses
After infection of Saos-2 cells with N-shRNA and LV-BTF3-shRNA lentiviruses for 72 h, cells were harvested and washed twice with ice-cold PBS and lysed on ice for 10-15 min with 2 × lysis buffer. The lysed samples were then centrifuged at 12,000 × g (4°C for 15 min) and the separated supernatant protein concentration measured using a BCA assay (Beyotime Biotechnology, Shanghai, China). After SDS-polyacrylamide gel electrophoresis and subsequent transfer to PVDF membranes (Millipore), samples were blocked with TBST (containing fat-free milk 5%) and then incubated with the primary antibodies STAT3 (Cat: Ab68153, Rabbit, Abcam, Burlingame, US), RPS6 (Cat: Ab225676, Rabbit, Abcam, Burlingame, US), SAPK/JNK2 (Cat: Ab76125, Rabbit, Abcam, Burlingame, US), SAPK/JNK 1 (Cat: 9251S, Rabbit, Cell Signalling Technology, US), GAPDH (Cat: sc-32233, Mouse, Santa Cruz Biotechnology, US) overnight at 4°C, followed by 1.5 h incubation with horseradish peroxidase-conjugated secondary antibodies (Anti-Rabbit IgG, Cat: #7074 and Anti-Mouse IgG, Cat: #7076, Cell Signalling Technology, US). After a further 3 times wash, immunoreactive bands were measured using enhanced chemiluminescence (ECL, Pierce-Thermo Scientific USA).
Statistical analyses
Data are presented as the mean ± SEM. A Student-Newman-Keuls test and analysis of variance (one-way) was utilized for multiple comparisons. All analysis was carried out using SPSS software (ver. 16.0). A P-value less than 0.05 denoted statistical significance.
Results
Effects of LV-BTF3-shRNA on BTF3 expression in Saos-2 cells
First, to determine the role of BTF3 in the development of OS, the level of BTF3 mRNA was measured in 4 cell lines of OS (U-2OS, Saos-2, MG-63, HOS). As shown in Figure 1A, BTF3 mRNA was found to be transcribed in all the cell lines tested. Furthermore, the suppression of BTF3 in the Saos-2 cell line by LV-BTF3-shRNA was used to demonstrate the functionality of BTF3. The transfection efficacy of green fluorescent protein (GFP) labeled LV-BTF3-shRNA was evaluated by the ratio of green fluorescent protein (GFP) expressed in Saos-2 cells after 5 days, which was > 80% demonstrating a sufficient infection efficiency (Figure 1B). Compared with the N-shRNA group, the mRNA level of BTF3 was significantly reduced by 89.8% in the LV-BTF3-shRNA group (P < 0.01, Figure 1C).
Effect of BTF3 silencing on proliferation of Saos-2 cells
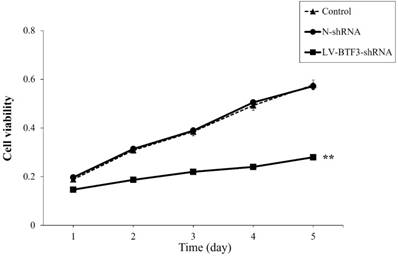
The effect of BTF3 silencing on Saos-2 cell proliferation was measured using MTT assays. Cell viability was determined for 5 days after lentivirus transfection. LV-BTF3- shRNA decreased the growth curve of Saos2 cells, starting on day 2. Compared with N-shRNA cells (99.10%), the cell viability of LV-BTF3-shRNA cells was reduced by 48.50% on day 5 (Figure 2, P < 0.01). These data suggested that BTF3 silencing suppressed proliferation of Saos-2 cells.
Effect of BTF3 silencing on apoptosis of Saos-2 cells
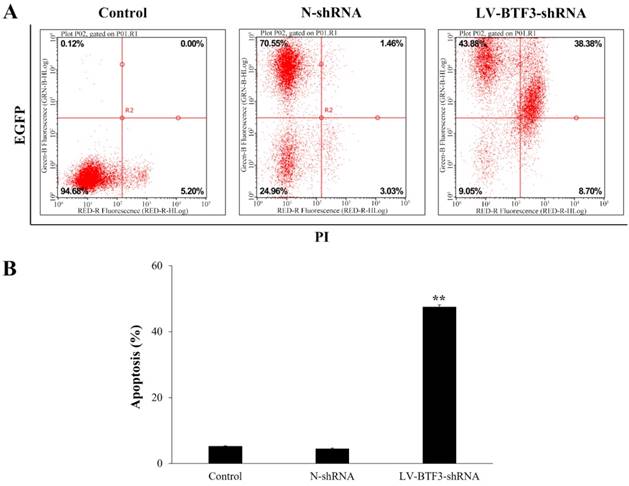
The effect of BTF3 silencing on apoptosis of Saos-2 cells was analyzed using annexin-V assays. Compared with N-shRNA cells, the apoptosis rate of LV-BTF3-shRNA treated cells was significantly increased (4.50% vs 48.20%, Figure 3). The data suggested that BTF3 silencing could induce apoptosis of Saos-2 cells.
Effect of BTF3 knockdown on the S and G2/M phases of Saos-2 cells
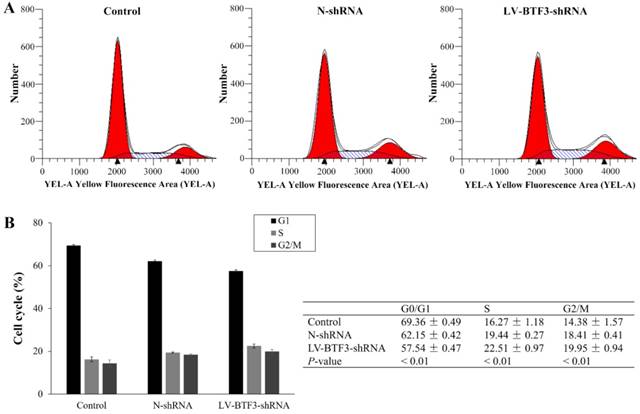
To explore the function of BTF3 on the cell cycle, Saos-2 cells were analyzed using flow cytometry. The results indicated that silencing BTF3 expression in cells decreased the G0/G1 phase population (Figure 4). However, they presented with higher S and G2/M phase populations than N-shRNA treated cells. The proportion of S and G2/M phases was increased from 19.44 ± 0.27 and 18.41 ± 0.41 in the N-shRNA group to 22.51 ± 0.97 and 19.95 ± 0.94 in the LV-BTF3-shRNA cell group, respectively (Figure 4, P < 0.01). Taken together, we propose that BTF3 shRNA suppresses cell growth associated with S and G2/M cell cycle arrest in OS cells.
Effect of BTF3 knockdown on colony formation
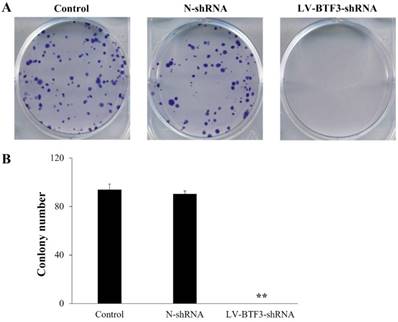
The size of an independent colony of LV-BTF3-shRNA treated Saos-2 cells was much smaller than that of the N-shRNA group, and the number of colonies was significantly inhibited by BTF3 silencing (Figure 5, P < 0.01).
Effect of BTF3 silencing on Saos-2 cell proliferation. Cell proliferation of control, N-shRNA and LV-BTF3-shRNA treated cells was evaluated using MTT assays. Data are presented as the mean ± SEM of 3 independent experiments performed in triplicate. **P < 0.01 control and N-shRNA vs LV-BTF3-shRNA.
Effect of BTF3 silencing on apoptosis of Saos-2 cells. Apoptosis in control, N-shRNA and LV-BTF3-shRNA treated cells was measured using an annexin-V single staining assay. (A) Representative flow cytometry images; (B) Graph of quantitative apoptosis rate analyses. Data are presented as the mean ± SEM of 3 independent experiments performed in triplicates. **P < 0.01 vs N-shRNA.
Effect of BTF3 silencing on the cell cycle of Saos-2 cells. The cell cycle in control, N-shRNA and LV-BTF3-shRNA treated cells was assessed using the PI single staining assay. (A) Representative flow cytometry images; (B) Quantitative cell cycle status analyses. Data are presented as the mean ± SEM of 3 independent experiments performed in triplicate. **P < 0.01 N-shRNA vs LV-BTF3-ShRNA.
Effect of BTF3 knockdown on colony formation of Saos-2 cells. Colony formation in control, N-shRNA and LV-BTF3-shRNA treated cells was measured using the crystal purple stain. (A) Representative images of cell colony formations; (B) Quantitative analyses of colony numbers. Data are presented as the mean ± SEM of 3 independent experiments performed in triplicate. **P < 0.01 N-shRNA vs LV-BTF3-ShRNA.
Effect of BTF3 knockdown on multi-intracellular signalling activation
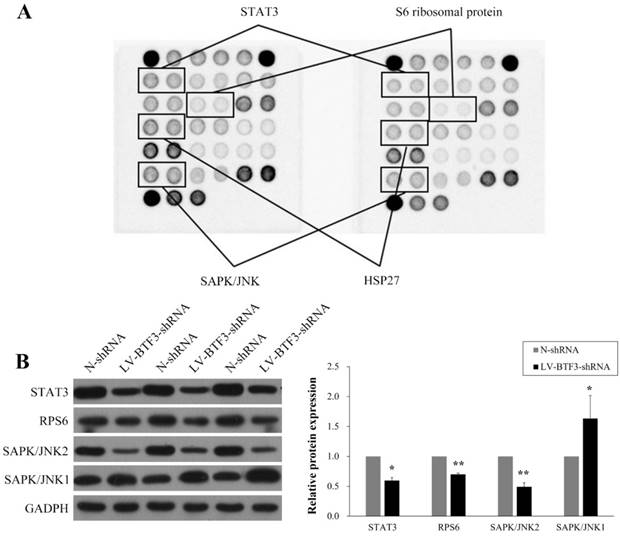
To investigate further the mechanisms involved in the regulatory effect of BTF3 on OS cell growth, we used a PathScan Intracellular Signaling Array Kit to measure changes in the production of signaling molecules in Saos-2 cells prior to and after BTF3 silencing and the data presented in Figure 6A indicate that activations of STAT3, S6 ribosomal protein (RPS6), HSP27 and SAPK/JNK were significantly downregulated. However, in western blots, we could only detect reduced expressions of STAT3, S6 ribosomal protein (RPS6) and SAPK/JNK2, whereas expression of SAPK/JNK1 was upregulated (Figure 6B).
Discussion
Our results have revealed that disruption of BTF3 expression inhibits cell viability and colony- forming ability, induces apoptosis and blocks the cell cycle in the Saos-2 cell line. The results of PathScan analysis further revealed that the regulation of the cell cycle by BTF3 was dependent on multiple signaling pathways.
It is believed that BTF3 is intimately involved in the regulation of a number of biological processes. [11] Its interaction with promoter elements, such as CAAT and TATA box sequences, initiates polymerase transcription by RNA. In addition, previous research has confirmed that BTF3 regulates regulation of the cell cycle as well as apoptosis. [7, 12]
In the present study, we investigated the functional role of BTF3 in OS and whether it could be a novel therapeutic target. First, we silenced BTF3 expression in Saos-2 cells using LV-BTF3-shRNA. Although BTF3 silencing reduced colony formation and cell proliferation, it increased the cell cycle ratio in the G2/M and S phases, respectively. It should be noted that our data are in agreement with a previous study, which reported that BTF3 down-regulation produced cycle inhibition in the G2/M phase. [7]
Furthermore, to explore the signal pathways involved in the action of BTF3 on cell growth in OS, we identified modifications to a number of proteins associated with actions on cell proliferation, apoptosis and the cell cycle, after cells were exposed to LV-BTF3-shRNA. Our data shows that STAT3, RPS6, HSP27 and SAPK/JNK were all downregulated due to interruption of BTF3 expression. STAT3 regulates downstream expression of target genes that promotes cellular processes including oncogenesis, tumor growth and progression. [13] Recent experimental findings have indicated that STAT3 controls many biological processes in cells about to undergo malignant changes and plays a vital role in the pathogenesis of many types of cancer. [14-18] Additionally, over activation of RPS6 has been detected in many types of tumors, [19, 20] particularly those that are phosphorylated at the Ser 235/236 site. [21] Furthermore, it has been demonstrated that phosphorylated-RPS6 triggers pancreatic cancer [22] and predicts unfavorable non-small cell lung cancer and an indicator of HER2 treatment resistance in breast cancer. [23, 24]. However, down-regulation of RPS6 can also influence cell cycle arrest at G0/G1 in non-small cell lung cancers. [25]
Especially under pathological circumstances serines on HSP27 are phosphorylated by MAPKAP kinases 2, which is a downstream substrate of the p38 MAPK. [26] However, in the PathScan analysis and western blots, shBTF3 inhibited the activation of SAPK/JNK2, but SAPK/JNK1 was upregulated by shBTF3, which needs further investigation. The SAPK/JNKs are member of the MAP kinase super family known to regulate many cellular processes and their pathways are activated by growth factors and cytokines that induce apoptosis and senescence as well as by environmental stress [27] and it has been reported that SAPK/JNK controls IL-6 synthesis stimulated by IL-1 negatively, by acting on the pathway in osteoblasts between IκB/NF-κB and AMPK. [28] Therefore, we conclude that the mechanism of BTF3 regulation of cancer development is necessarily very complex.
In conclusion, BTF3 has been implicated in the pathogenesis of OS, the mechanisms being related to the actions of STAT3, RPS6, HSP27 and SAPK/JNKs. However, the underlying mechanisms need to be investigated further in future studies.
Effect of shBTF3 on intracellular signalling in Saos-2 cells. (A) Modifications to STAT3 (Tyr705), RPS6 (Ser235/236), HSP27 (Ser78) and SAPK/JNK (Thr183/Tyr185) phosphorylation were observed in shBTF3-treated cells. (B) Wesetrn blot analyses of STAT3, RPS6, SAPK/JNK1 and SAPK/JNK2 expression in Saos-2 cells transfected with N-shRNA or LV-BTF3-shRNA. The right panel indicates the relative protein expressions of 3 independent measurements. *P < 0.05; **P < 0.01
Abbreviations
Annexin V-FITC: Fluorescein isothiocyanate (FITC)-labeled annexin V staining; BTF3: basic transcription factor 3; FITC: fluorescein isothiocyanate; MTT: methyl-thaizolyl-tetrazolium; OS: osteosarcoma.
Acknowledgements
This work was supported by Natural Science Foundation of Hunan Province of China (Grant No. 2018JJ2229).
Author contributions
TJ, LJ, WW and QL were responsible for the conception and design of the study. TJ and QL were responsible for acquisition and analysis of data; furthermore, TJ and QL were in charge of statistical analysis. TJ drafted the manuscript; QL revised and commented on the draft, and TJ and QL read and approved the final version of the manuscript.
Competing Interests
The authors have declared that no competing interest exists.
References
1. Ferrari S, Palmerini E. Adjuvant and neoadjuvant combination chemotherapy for osteogenic sarcoma. Curr Opin Oncol. 2007;19:341-346
2. Bruland OS, Pihl A. On the current management of osteosarcoma. A critical evaluation and a proposal for a modified treatment strategy. Eur J Cancer. 1997;33:1725-1731
3. Mertens WC, Bramwell VC. Osteosarcoma and other tumors of bone. Curr Opin Oncol. 1997;9:360-365
4. Link MP. Adjuvant therapy in the treatment of osteosarcoma. Important Adv Oncol. 1986;1986:193-207
5. Longhi A, Errani C, De Paolis M. et al. Primary bone osteosarcoma in the pediatric age: state of the art. Cancer Treat Rev. 2006;32:423-436
6. Zheng XM, Moncollin V, Egly JM. et al. A general transcription factor forms a stable complex with RNA polymerase B (II). Cell. 1987;50:361-368
7. Liu Q, Zhou JP, Li B. et al. Basic transcription factor 3 is involved in gastric cancer development and progression. World J Gastroenterol. 2013;19:4495-4503
8. Symes AJ, Eilertsen M, Millar M. et al. Quantitative analysis of BTF3, HINT1, NDRG1 and ODC1 protein over-expression in human prostate cancer tissue. PLoS One. 2013;8:e84295
9. Kusumawidjaja G, Kayed H, Giese N. et al. Basic transcription factor 3 (BTF3) regulates transcription of tumor-associated genes in pancreatic cancer cells. Cancer Biol Ther. 2007;6:367-376
10. Zhang DZ, Chen BH, Zhang LF. et al. Basic Transcription Factor 3 Is Required for Proliferation and Epithelial-Mesenchymal Transition via Regulation of FOXM1 and JAK2/STAT3 Signaling in Gastric Cancer. Oncol Res. 2017;25:1453-1462
11. Jamil M, Wang W, Xu M. et al. Exploring the roles of basal transcription factor 3 in eukaryotic growth and development. Biotechnol Genet Eng Rev. 2015;31:21-45
12. Jeon YJ, Bang W, Cho JH. et al. Kahweol induces apoptosis by suppressing BTF3 expression through the ERK signaling pathway in non-small cell lung cancer cells. Int J Oncol. 2016;49:2294-2302
13. Carpenter RL, Lo HW. STAT3 Target Genes Relevant to Human Cancers. Cancers (Basel). 2014;6:897-925
14. Kamran MZ, Patil P, Gude RP. Role of STAT3 in cancer metastasis and translational advances. Biomed Res Int. 2013;2013:421821
15. He G, Karin M. NF-κB and STAT3 - key players in liver inflammation and cancer. Cell Res. 2011;21:159-168
16. Takezawa K, Okamoto I, Nishio K. et al. Role of ERK-BIM and STAT3-survivin signaling pathways in ALK inhibitor-induced apoptosis in EML4-ALK-positive lung cancer. Clin Cancer Res. 2011;17:2140-2148
17. Yu H, Pardoll D, Jove R. STATs in cancer inflammation and immunity: a leading role for STAT3. Nat Rev Cancer. 2009;9:798-809
18. Fan Y, Mao R, Yang J. NF-κB and STAT3 signaling pathways collaboratively link inflammation to cancer. Protein Cell. 2013;4:176-185
19. Chaisuparat R, Rojanawatsirivej S, Yodsanga S. Ribosomal protein S6 phosphorylation is associated with epithelial dysplasia and squamous cell carcinoma of the oral cavity. Pathol Oncol Res. 2013;19:189-193
20. Kim SH, Jang YH, Chau GC. et al. Prognostic significance and function of phosphorylated ribosomal protein S6 in esophageal squamous cell carcinoma. Mod Pathol. 2013;26:327-335
21. Robb VA, Astrinidis A, Henske EP. Frequent [corrected] hyperphosphorylation of ribosomal protein S6 [corrected] in lymphangioleiomyomatosis-associated angiomyolipomas. Mod Pathol. 2006;19:839-846
22. Khalaileh A, Dreazen A, Khatib A. et al. Phosphorylation of ribosomal protein S6 attenuates DNA damage and tumor suppression during development of pancreatic cancer. Cancer Res. 2013;73:1811-1820
23. Chen B, Tan Z, Gao J. et al. Hyperphosphorylation of ribosomal protein S6 predicts unfavorable clinical survival in non-small cell lung cancer. J Exp Clin Cancer Res. 2015;34:126
24. Yang-Kolodji G, Mumenthaler SM, Mehta A. et al. Phosphorylated ribosomal S6 (p-rpS6) as a post-treatment indicator of HER2 signalling targeted drug resistance. Biomarkers. 2015;20:313-322
25. Chen B, Zhang W, Gao J. et al. Downregulation of ribosomal protein S6 inhibits the growth of non-small cell lung cancer by inducing cell cycle arrest, rather than apoptosis. Cancer Lett. 2014;354:378-389
26. Gurgis FM, Ziaziaris W, Munoz L. Mitogen-activated protein kinase-activated protein kinase 2 in neuroinflammation, heat shock protein 27 phosphorylation, and cell cycle: role and targeting. Mol Pharmacol. 2014;85:345-356
27. Weston CR, Davis RJ. The JNK signal transduction pathway. Curr Opin Cell Biol. 2007;19:142-149
28. Kondo A, Otsuka T, Matsushima-Nishiwaki R. et al. Inhibition of SAPK/JNK leads to enhanced IL-1-induced IL-6 synthesis in osteoblasts. Arch Biochem Biophys. 2013;535:227-233
Author contact
![]() Corresponding author: Tao Jiang, Department of Orthopedic Surgery, The Second Xiangya Hospital, Central South University, Changsha 410005, Hunan Province, China. Tel: +86-13507442287; Fax: +86-0731-2278012; E-mail: jiangtao180516com
Corresponding author: Tao Jiang, Department of Orthopedic Surgery, The Second Xiangya Hospital, Central South University, Changsha 410005, Hunan Province, China. Tel: +86-13507442287; Fax: +86-0731-2278012; E-mail: jiangtao180516com

 Global reach, higher impact