Impact Factor ISSN: 1837-9664

 Global reach, higher impact
J Cancer 2019; 10(9):1975-1984. doi:10.7150/jca.30135 This issue Cite
Research Paper
Comparisons and Combined Application of Two-Dimensional and Three-Dimensional Real-time Shear Wave Elastography in Diagnosis of Thyroid Nodules
Rui-Jun Han1, Jing Du1 ![]() , Feng-Hua Li1
, Feng-Hua Li1 ![]() , Hao-Ru Zong1, Jia-Dong Wang2, Yu-Ling Shen2, Qin-Yi Zhou2
, Hao-Ru Zong1, Jia-Dong Wang2, Yu-Ling Shen2, Qin-Yi Zhou2
1. Department of Ultrasound, Renji Hospital, School of Medicine, Shanghai Jiaotong University, 160 Pujian Rd, Shanghai 200127, China.
2. Department of Head and Neck Surgery, Renji Hospital, School of Medicine, Shanghai Jiaotong University, 145 Middle Shandong Rd, Shanghai, 200001, China.
Received 2018-9-23; Accepted 2019-2-21; Published 2019-5-12
Abstract
Purpose Two-dimensional and three-dimensional real-time shear wave elastography (2D+3D SWE) represents a new technology for the quantification of tissue elasticity. This study investigated whether they could be performed to differentiate between benign and malignant thyroid nodules.
Methods Conventional B-mode ultrasound, 2D and 3D SWE were performed in 96 patients with 97 thyroid nodules with pathology results.
Results All the elastography values of 2D&3D SWE in malignant thyroid nodules were higher than those in benign nodules. These two elastography methods alone could not improve diagnostic value comparing to B-mode ultrasound significantly. However, B-mode US + 2D SWE (TI-RADS ≥ 4c or S-Emean ≥ 23.75 kPa, suspicious), B-mode US + 3D SWE (TI-RADS ≥ 4c or 3D-T-Emean ≥ 20.75 kPa, suspicious), B-mode US + 2D + 3D SWE (TI-RADS ≥ 4c or S-Emean ≥ 23.75 kPa or 3D-T-Emean ≥ 20.75 kPa, suspicious) had higher sensitivity and accuracy values than those of 3 methods alone but lower specificity values. Among them, B-mode ultrasound + 2D SWE had the highest sensitivity, NPV, accuracy and Youden's index (0.881, 0.788, 0.804 and 0.57).
Conclusions 2D SWE or 3D SWE alone could not improve the diagnostic value of differentiating malignant from benign thyroid nodules comparing to conventional B-mode ultrasound. But combination methods could improve the diagnostic value, especially B-mode US + 2D SWE.
Keywords: Thyroid nodule, Ultrasound, Three-dimensional image, Elasticity imaging techniques
Introduction
Thyroid cancer is the most common malignant disease of the endocrine system and the incidence of thyroid cancer has increased markedly [1-2]. The incidence of detected thyroid cancer cases has been rising almost 190% in the United States from 1975 to 2014 [3]. The global incidence of thyroid cancer is also increasing by 4% annually [4].
The accuracy of conventional B-mode ultrasound in differentiating malignant thyroid lesions from benign ones was only about 70%. Although conventional B-mode ultrasound using high-risk sonographic characteristics plus follow-up fine needle aspiration cytology (FNAC) can improve the accuracy, it's invasive and can't be the first choice for screening of thyroid nodules [5].
Stiffness is an important tissue property for clinical diagnosis; malignant lesions tend to be stiffer than benign lesions and normal tissue in generally [6]. Thus, different ultrasound imaging methods named elastosonography based on the measurement of tissue stiffness were used in the clinical diagnosis. Two-dimensional and three dimensional real-time shear wave elastography (2D and 3D SWE) (SuperSonic Imagine, Aix-en-Provence, France) represents a highly reproducible technology for the quantification of tissue elasticity, which measures the shear wave speed generated by an acoustic push pulse to estimate tissue stiffness [7]. Comparing with the other kind of elastosonography (assisted elastic ultrasound and ARFI), SWE is easier to operate, has higher reproducibility and higher accuracy. Previous studies have shown that 2D and 3D SWE could be performed in breast, optical and andrology field [8-11]. In thyroid field, several studies were performed only by 2D SWE [12-15].Only one study published was also performed by 3D SWE, but using different evaluation coefficients and absent of combined application analysis of B mode ultrasound, 2D and 3D SWE [16].
This prospective study aimed at comparing the quantitative elasticity values of thyroid nodules using 2D and 3D SWE, and evaluating the diagnostic performances of different SWE imaging methods combining with conventional B-mode ultrasound in differentiating between benign and malignant thyroid nodules.
Materials and Methods
Patients
The prospective study period was from April 2015 to October 2016, in accordance with The Code of Ethics of the World Medical Association (Declaration of Helsinki) for experiments involving humans Declaration and also approved by the local ethics committee and informed consents were obtained from all patients.
The inclusion criterion was the presence of one or more thyroid solid or mixed nodules with FNAC and/or surgery within 1 month after ultrasound examination and without diffuse diseases such as chronic or acute thyroiditis, hyperthyroidism, hypothyroidism, etc. As for the patients with FNAC (+) (tendency of malignant), surgical operations would be advised. As for the patients with FNAC (-) (tendency of benign), one year follow-up ultrasound examinations would be performed with the second FNAC.
Exclusion criteria: 1.neither histology results by surgery of the thyroid nodule nor by FNAC within the defined period above; 2.failure follow-up visits of the patients or absence of histology results in patients diagnosed as "nondiagnostic" or "indeterminate" on cytology; 3.nodules without enough thyroid tissue surrounding the nodule at the same depth; 4.nodules without successful SWE measures because of aspiration control difficulty or the cervical arteriopalmus impact or other reasons; 5.nodules with the eggshell calcification or the huge calcification (d ≥ 3mm) which could lead to the failure of SWE measures.
Conventional B-mode ultrasound
All patients received a conventional B-mode ultrasound examination of the thyroid gland using a 4-15MHz linear array broadband probe of AixPlorer ultrasound system (SuperSonic Imagine, Aix-en-Provence, France). All patients were positioned in supine position with dorsal flexion of the head. Both the conventional B-mode ultrasound and SWE ultrasound examinations were performed by the same experienced examiner blinded to the results of pathology. The ultrasound patterns of the thyroid nodules were recorded for all the patients, which were evaluated for the following parameters: size (the longest diameter), component (solid or mixed), echogenicity (i.e. hyerechoic, isoechoic, hypoechoic compared with normal thyroid parenchyma and marked hypoechoic with the surrounding neck muscles), border (i.e. clear or obscure), margins (regular or irregular), presence or absence of microcalcifications (hyperechoic spots < 1 mm without acoustic shadowing), presence or absence of macrocalcification (hyperechoic spots ≥ 1 mm), shape (taller than wide, wider than tall). Especially the suspicious ultrasound features should be recorded: marked hypoechogenicity, irregular margin or microlobulated, obscure border, microcalcifications, and a taller-than-wide shape [17-20].
After conventional B-mode ultrasound examination, the nodules were divided into different categories according to Thyroid Imaging Reporting and Data System for Ultrasound Features (TI-RADS) [19-22]. TI-RADS 3: none of suspicious features; TI-RADS 4a: 1 suspicious feature; TI-RADS 4b: 2 suspicious features; TI-RADS 4c: 3-4 suspicious features; TI-RADS 5: 5 suspicious features.
2D and 3D real-time shear wave elastography (SWE)
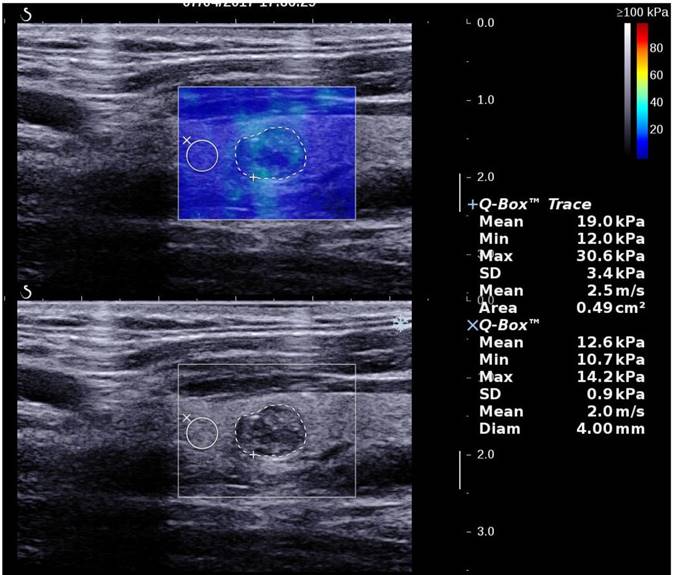
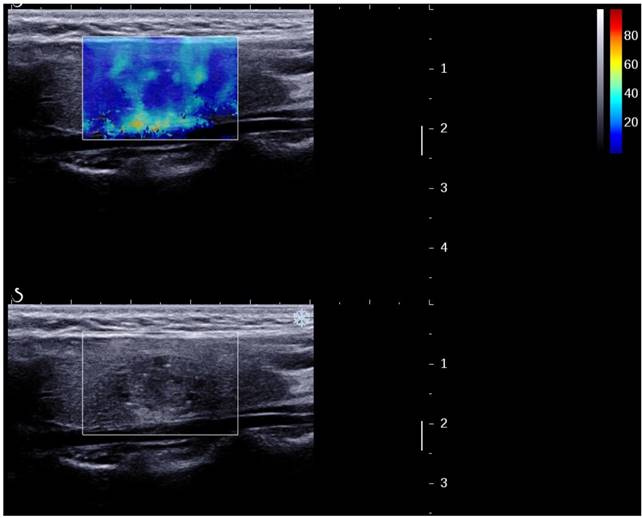
2D SWE examinations were performed by using the same probe of the AixPlorer US system in B-mode ultrasound examinations. This probe was applied in completely contact with the cervical skin with very light pressure to show the longest diameter of the thyroid nodule in sagittal section and kept more than 3 seconds. The region of interest (ROI) box of SWE color map was adjusted to include the nodule and the surrounding tissue (Fig. 1). The shear wave propagation velocity (SWV) of tissue in ROI can be measured, and turned to Young's modulus which is proportional to the tissue elasticity [23]. Results were expressed in kPa. The stiffer the tissue the higher Young's modulus was. A color map of tissue elasticity representing Young's modulus was obtained in ROI box ranging from 0 (dark blue, soft) to 100 kPa (red, hard). Quantitative elasticity values were measured using circular quantification ROIs (Q-box). One was adjusted to include all the portion of the thyroid nodule, the other was placed on the surrounding normal thyroid tissue. Three parameters were recorded for each nodule in sagittal: mean elasticity value of nodule (s-Emean), max elasticity value of nodule (s-Emax), ratio of mean elasticity value of nodule and surrounding normal thyroid tissue (s-Eratio). Then the relevant elasticity values were obtained in transverse section (t-Emax, t-Emean, t-Eratio).
A thyroid papillary carcinoma in sagittal section by 2D SWE with Young's modulus measured in the lesion and ratio with the surrounding tissue
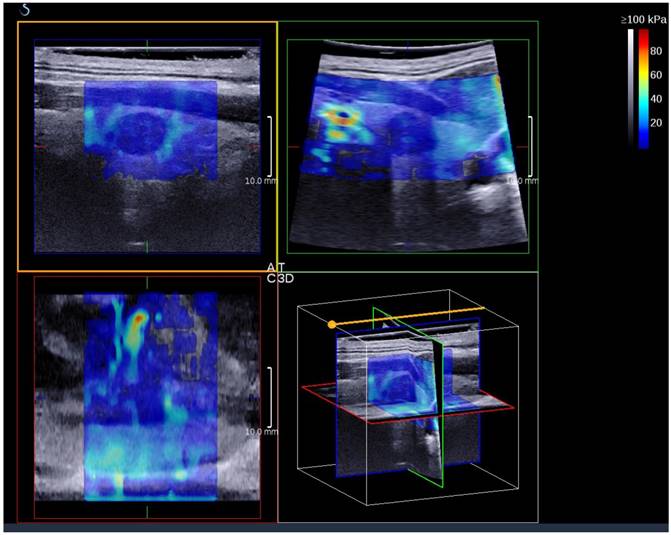
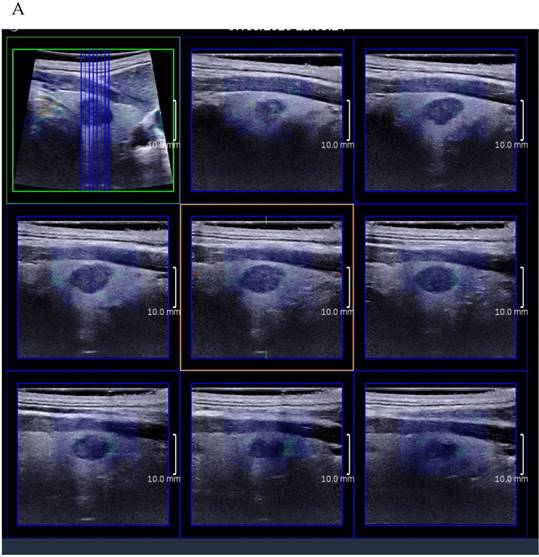
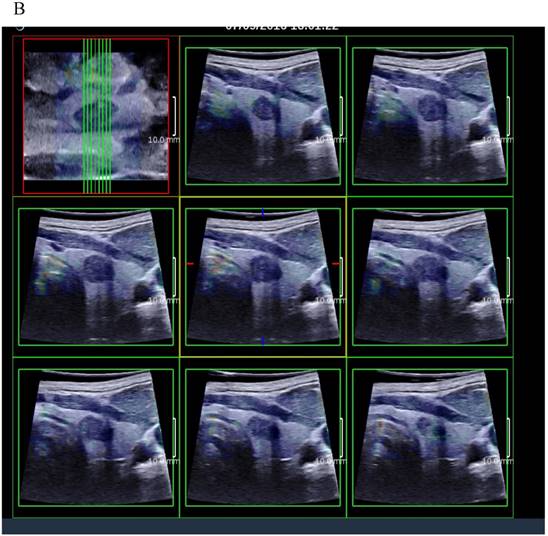
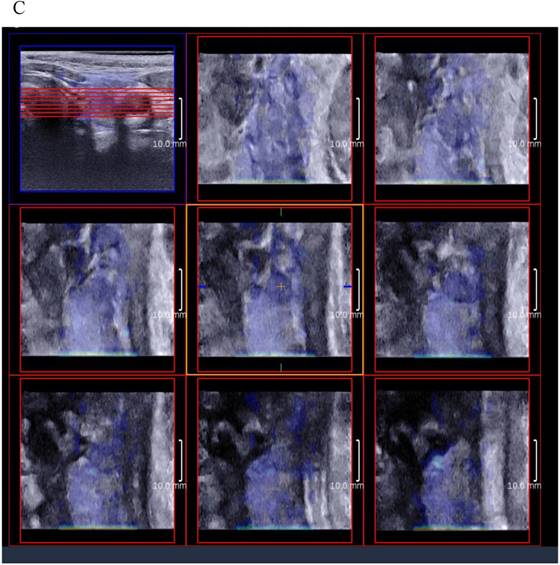
3D SWE examinations were performed by an SLV 16-5 probe of AixPlorer US system (SuperSonic Imagine, Aix-en-Provence, France). The volume imaging was automatically performed by using a slow-tilt movement of the sectorial mechanical probe, which was placed with very light pressure to show the longest diameter of nodule in transverse section and kept stably until the end of automatic scanning. Volume data were reconstructed and displayed as multi-slice images (sagittal, transverse, and coronal images) (Fig. 2). For each section, 8 slice images could be caught by fixing the top slice and the bottom one, which should touch the margin of nodule in order to include the most elastic information as possible (Fig. 3). In each slice, quantitative elasticity values were measured using Q-box as in 2D SWE. 3D-Emean was the mean value of Emean of all slices in each section, and 3D-Emax was the largest value of Emax of all slices.
A thyroid papillary carcinoma on the sagittal/transverse/coronal section by 3D SWE
(A) 8 slice images on the sagittal section by 3D SWE of a thyroid papillary carcinoma. (B) 8 slice images on the transverse section by 3D SWE of a thyroid papillary carcinoma. (C) 8 slice images on the coronal section by 3D SWE of a thyroid papillary carcinoma
Both the 2D SWE and 3D SWE were performed by one experienced examiner blinded to the results of pathology. The interval time was less than 5 minutes.
Cytology diagnosis by FNAC and surgical pathological diagnosis
FNAC was performed by 2 skilled radiologists using a 25-gauge needle attached to a 5ml syringe under US guidance. Each lesion was aspirated at least twice. 2 experienced pathologists reviewed all the obtained samples to confirm the cytopathological diagnosis basing on the Bethesda System for Reporting Thyroid cytology (BSRTC) [24]. Thyroid operations were proceeded within 1 month after ultrasound examinations and the pathological diagnosis were recorded afterwards.
Statistical analysis
The statistical analysis was performed by SPSS software (version 19; SPSS Inc., USA). All measured data were expressed as the mean value ± standard deviation (SD). P value < 0.05 was considered statistically significant.
All the elasticity values of between-group comparisons (benign and malignant) were performed by the Shapiro-Wilk test (W test) to assess for normal distributions. Normally distributed data were analyzed with the independent samples t-test., nonnormally distributed data with the Mann-Whitney U test. The relevant 2D SWE and 3D SWE elasticity values (Emean, Emax, Eratio) in the same thyroid nodule were compared by the paired t-test. Receiver operating characteristic curves (ROC) for conventional B-mode ultrasound, 2D SWE and 3D SWE were performed to evaluate diagnostic performance. Further, optimal cut-off values, the corresponding sensitivity, specificity and accuracy for conventional B-mode ultrasound, 2D SWE and 3D SWE were calculated. AUCs were compared using Z-test. Optimal cut-off values were indicated by the highest Youden's index. Correlations of relevant elasticity values were assessed by Pearson's correlation coefficient.
Results
118 patients with 120 thyroid solid nodules met the inclusion criteria. Among them, 22 patients with 23 thyroid nodules were excluded by the exclusion criteria. Therefore, a total of 96 patients with 97 nodules were performed all complete examinations and included in the final analysis.
Histology
The histology results of all 97 thyroid nodules in 96 patients revealed 38 benign lesions and 59 malignant lesions. 59 thyroid carcinomas were papillary carcinomas (n=54), follicular carcinomas (n=4), oxyphie cell adenoma (n=1). In 38 benign lesions, 8 were adenoma (diagnosis by surgery histology results), 10 were nodular goiter (diagnosis by surgery histology results). The other 20 were diagnosed as FNAC (-) (tendency of benign).
Conventional B-mode ultrasound
Clinical and conventional B-mode ultrasound features were shown in Table 1. In 96 patients, 27 were male and 69 were female (46.74 ± 14.03y). There weren't significant differences in sex, age and size between benign and malignant patients. As for the suspicious ultrasound features, the detection rates of marked hypoechogenicity, microcalcifications, obscure border, irregular margin and taller-than-wide shapes were significantly higher in the malignant than in the benign group ( P = 0.046, P = 0.005, P = 0.001, P = 0.042, P = 0.022, respectively).
Clinical and conventional B-mode ultrasound features
| Features | benign | malignant | P value |
|---|---|---|---|
| Number of nodules | 38 | 59 | / |
| Gender(male/female) | 8/30 | 20/38 | 0.137 |
| Age(year) | 48.8±15.3 | 45.4±12.7 | 0.239 |
| Size/longest diameter(mm) | 9.8±4.3 | 9.6±5.1 | 0.850 |
| Solid/mixed | 36/2 | 58/1 | 0.322 |
| Marked Hypoechogenicity | 14 | 34 | 0.046 |
| Microcalcification | 12 | 36 | 0.005 |
| Macrocalcification | 9 | 10 | 0.438 |
| Obscure border | 5 | 29 | 0.001 |
| Irregular margin | 8 | 26 | 0.042 |
| Taller-than- wide shape | 4 | 18 | 0.022 |
Table 2 showed the results of TI-RADS category according to conventional B-mode ultrasound features. The malignant rates of TI-RADS 3, 4a, 4b, 4c and 5 were 0%, 13.3%, 57.6%, 83.3% and 75.0%, respectively.
TI-RADS category according to conventional B-mode ultrasound features
| TI-RADS Category | benign | malignant | Malignant rate |
|---|---|---|---|
| TI-RADS 3 | 3 | 0 | 0% |
| TI-RADS 4a | 13 | 2 | 13.3% |
| TI-RADS 4b | 14 | 19 | 57.6% |
| TI-RADS 4c | 7 | 35 | 83.3% |
| TI-RADS 5 | 1 | 3 | 75.0% |
ROC curve analysis showed that the AUC for TI-RADS was 0.771 (95%CI: 0.670, 0.871; P < 0.001) in differentiating malignant from benign thyroid nodules. The best cut-off point was 4c for TI-RADS. The sensitivity, specificity, accuracy, PPV and NPV were 64.4%, 78.9%, 70.1%, 82.6% and 58.8% respectively. Youden's index was 0.433.
2D real-time shear wave elastography
The elastography values in sagittal and transverse sections of 2D real-time shear wave elastography (SWE) between benign and malignant nodules were represented in Table 3. All the elastography values (mean, max and nodule/surrounding tissue ratio) were higher in malignant nodules than in benign nodules, with statistical significance (P < 0.05).
The elastography values of 2D and 3D real-time shear wave elastography
| SWE (kPa) | benign | malignant | P value | |
|---|---|---|---|---|
| 2D | S-Emean | 21.22±6.29 | 32.28±16.86 | 0.000 |
| S-Emax | 37.72±14.49 | 68.40±51.76 | 0.000 | |
| S-Eratio* | 1.28±0.35 | 1.73±0.71 | 0.000 | |
| T-Emean | 19.25±8.18 | 29.32±18.50 | 0.004 | |
| T-Emax | 44.77±20.20 | 75.66±56.12 | 0.005 | |
| T-Eratio* | 1.33±0.38 | 1.79±0.92 | 0.023 | |
| 3D | 3D-S-Emean | 16.81±6.77 | 21.86±10.67 | 0.009 |
| 3D-S-Emax | 36.76±16.62 | 58.28±46.41 | 0.008 | |
| 3D-T-Emean | 16.88±7.89 | 22.86±10.43 | 0.002 | |
| 3D-T-Emax | 38.91±15.78 | 53.95±38.27 | 0.015 | |
| 3D-C-Emean | 15.79±7.21 | 20.18±9.31 | 0.008 | |
| 3D-C-Emax | 37.62±16.20 | 52.84±37.67 | 0.014 | |
Note: * value without unit
Table 4 showed the results of ROC curve analysis of 2D SWE. All the AUCs of elastography values in sagittal were higher than those in transverse section. AUCs of S-Emax, S-Emean and S-Eratio were higher than 0.7 in differentiating malignant from benign thyroid nodules (0.718, 0.752 and 0.729, respectively).
ROC analysis of elastography values in conventional ultrasound and 2D/3D SWE
| AUCs | P value | Cut-off point | Sensitivity | Specificity | Youden's index | |
|---|---|---|---|---|---|---|
| S-Emax | 0.718 | 0.000 | 54.85 | 0.475 | 0.895 | 0.369 |
| S-Emean | 0.752 | 0.000 | 23.75 | 0.695 | 0.763 | 0.458 |
| S-Eratio | 0.729 | 0.000 | 1.35 | 0.644 | 0.789 | 0.434 |
| T-Emax | 0.669 | 0.005 | 58.1 | 0.508 | 0.816 | 0.324 |
| T-Emean | 0.672 | 0.004 | 28.75 | 0.441 | 0.895 | 0.336 |
| T-Eratio | 0.638 | 0.022 | 1.85 | 0.373 | 0.947 | 0.320 |
| 3D-S-Emean | 0.653 | 0.011 | 18.25 | 0.610 | 0.711 | 0.321 |
| 3D-S-Emax | 0.644 | 0.017 | 35.90 | 0.661 | 0.632 | 0.293 |
| 3D-T-Emean | 0.673 | 0.004 | 20.75 | 0.542 | 0.789 | 0.331 |
| 3D-T-Emax | 0.634 | 0.027 | 44.05 | 0.508 | 0.711 | 0.219 |
| 3D-C-Emean | 0.640 | 0.020 | 17.6 | 0.576 | 0.711 | 0.287 |
| 3D-C-Emax | 0.629 | 0.032 | 41.85 | 0.576 | 0.684 | 0.260 |
| B-mode(TI-RADS) | 0.771 | 0.000 | 4c | 0.644 | 0.789 | 0.433 |
3D real-time shear wave elastography
The elastography values (± SD) in sagittal, transverse and coronal sections of 3D SWE between benign and malignant nodules were showed in Table 3. All the elastography values (mean, max and nodule/surrounding tissue ratio) were higher in malignant nodules than in benign nodules, with statistical significance (P < 0.05).
Table 4 showed the results of ROC curve analysis of 3D SWE. All the AUCs of elastography values were lower than 0.7 in differentiating malignant from benign nodules.
Comparisons and relationships of conventional B-mode ultrasound, 2D and 3D SWE
All the relevant elastography values in sagittal/transverse section of 2D were higher than those of 3D SWE. Among them, S-Emean & 3D-S-mean, T-Emean &3D-T-mean, T-Emax & 3D-T-Emax had significant difference (P < 0.05).
We found significant positive direct relationship between all relevant elastography values in sagittal/transverse section of 2D and 3D SWE: S-Emean & 3D-S-Emean (P < 0.001, correlation coefficient: 0.698); S-Emax & 3D-S-Emax (P < 0.001, correlation coefficient: 0.554); T-Emean &3D-T-mean (P<0.001, correlation coefficient: 0.450); T-Emax & 3D-T-Emax (P < 0.001, correlation coefficient: 0.577).
Among all the elastography values of 2D SWE, S-Emean had the largest AUC (0.752), which was chosen as the diagnostic value of 2D SWE to compare with conventional B-mode ultrasound (TI-RADS). No significant difference could be found between them (z = 0.27, P = 0.79).
3D-T-Emean was chosen as the diagnostic value of 3D SWE to compare with conventional B-mode ultrasound (TI-RADS) because of the largest AUC (0.673) in all 3D SWE elastography values. No significant difference could be found between them (z = 1.29, P = 0.10) as well.
Similarly, there wasn't significant difference between 2D-S-Emean and 3D-T-Emean (z = 1.06, P = 0.29).
Combination methods of B-mode ultrasound and SWE
B-mode ultrasound and 2D SWE were combined by overall consideration of TI-RADS and S-Emean. Either TI-RADS ≥ 4c or S-Emean≥ 23.75 kPa, the thyroid nodule would be suspicious malignant.
Similarly, overall consideration of TI-RADS and 3D-T-Emean was the method of combination B-mode ultrasound and 3D SWE (TI-RADS ≥ 4c or 3D-T-Emean ≥ 20.75 kPa: suspicious).
Especially, 2 ways to combination B-mode ultrasound, 2D and 3D SWE: B+2D + 3D SWE I (any one was positive, TI-RADS ≥ 4c or S-Emean ≥ 25.05 kPa or 3D-T-Emean ≥ 20.75 kPa: suspicious); B+2D+3D SWE II (any two of these methods were positive: suspicious).
Table 5 showed ROC curve analysis of these combination methods. B + 2D SWE, B-mode + 3D SWE, B + 2D + 3D SWE I had higher sensitivity and accuracy values than those of 3 singular methods and B + 2D + 3D SWE II, but had lower specificity values. On the contrary, B + 2D + 3D SWE II had higher specificity values than the other methods but lower specificity values except 2D SWE. Among them, B-mode ultrasound + 2D SWE had the highest sensitivity, NPV, accuracy and Youden's index (0.881, 0.788, 0.804 and 0.57) (Fig 4).
ROC analysis of combination methods
| Sensitivity | Specificity | PPV | NPV | Accuracy | Youden's index | |
|---|---|---|---|---|---|---|
| B-mode( TI-RADS ≥ 4c) | 0.644 | 0.789 | 0.826 | 0.588 | 0.701 | 0.433 |
| 2D SWE (S-Emean ≥ 23.75 kPa) | 0.695 | 0.763 | 0.820 | 0.617 | 0.722 | 0.458 |
| 3D SWE (3D-T-Emean ≥ 20.75 kPa) | 0.542 | 0.789 | 0.800 | 0.526 | 0.639 | 0.331 |
| B+2D SWE | 0.881 | 0.684 | 0.813 | 0.788 | 0.804 | 0.570 |
| B+3D SWE | 0.831 | 0.605 | 0.766 | 0.697 | 0.742 | 0.436 |
| B+2D+3D SWE I | 0.831 | 0.579 | 0.754 | 0.688 | 0.732 | 0.410 |
| B+2D+3D SWE II | 0.610 | 0.868 | 0.878 | 0.589 | 0.711 | 0.478 |
A papillary carcinoma missed by B-mode US (TI-RADS 4a) but suspicious by 2D SWE (S-Tmean=25.3 kPa).
Discussion
Our data demonstrated that all the elastography values of 2D and 3D SWE in malignant thyroid nodules were higher than in benign nodules with significant difference, in accordance with the histology structure and the other researches [12-13, 16].
By 2D SWE, all the AUCs of elastography values in sagittal section were higher than those in transverse section, among them, AUCs of S-Eratio, S-Emean and S-Emax were higher than 0.7 in differentiating malignant from benign thyroid nodules, which prompted that all the 3 elastography values in sagittal section had certain accuracy in differentiating between malignant and benign thyroid nodules.
However, all the AUCs of elastography values of 3D SWE were lower than 0.7 in differentiating malignant from benign thyroid nodules, prompting that all the elastography values of 3D SWE had low accuracy in differentiating between malignant and benign thyroid nodules.
To compare 2D SWE and 3D SWE, contrary to our expectation that all the relevant elastography values in sagittal/transverse section of 2D were higher than 3D SWE. However, only S-Emean & 3D-S-mean, T-Emean &3D-T-mean, T-Emax & 3D-T-Emax had significant difference. This result was different from the similar study in breast and in thyroid [8-9, 16]. It's possibly because that the thyroid nodules in this study were smaller than the breast lesions and the thyroid nodules (10mm or larger) in those studies mentioned above, then on 3D SWE, the automatic slices couldn't show the hardest portion of nodules every time, but on 2D SWE, the examiner could catch the hardest portion artificially. The second possible reason was that necks of some patients were too smaller for the probe on 3D SWE to touch completely and in the same pressure, then the elastography values would be underestimated somewhere, but this could be avoided on 2D SWE. The third possible reason could be relevant to the different pressure on 2D SWE and 3D SWE, even though the examiner tried to fix the probe very lightly, the different probe with different weight and different size could lead to different pressure, which affected the elastography values. The fourth possible reason was on 3D SWE, the automatic scanning running quickly, the SWE color map couldn't be optimal every time; on the contrary, the operators of 2D SWE would hold on several seconds until the SWE color map became stable.
S-Emean (≥ 23.75 kPa) was chosen as the diagnostic value of 2D SWE. AUC, sensitivity, specificity and accuracy were 0.752, 0.695, 0.763 and 0.722, similar to the results of past researches [14]. 3D-T-mean (≥ 20.75 kPa) was the diagnostic value of 3D SWE. AUC of TI-RADS was larger than that of S-Emean, which was larger than that of 3D-T-mean. However, no significant difference could be found between 2D SWE (S-Emean) and B-mode (TI-RADS). Similarly, there was no significant difference between 3D SWE (3D-T-mean) and B-mode ultrasound (TI-RADS); either between 2D SWE (S-Emean) and 3D SWE (3D-T-mean). 2D SWE or 3D SWE alone couldn't improve the diagnostic value individually comparing to conventional B-mode ultrasound. These results were different from the similar study by MD Zhao, etc, which promoted the diagnostic performances in terms of AUC were 0.612 for conventional US, 0.836 for 2D SWE (P<0.001 in comparison with conventional US), and 0.839 for 3D SWE (P < 0.001) [16]. The possible reasons for the difference were as follows. Firstly, we use different methods to evaluate the conventional B mode ultrasound. MD Zhao advised the 4a was the cut-off point and AUC of B mode was only 0.612, which was different in our research, because the Youden's index was only 0.223, this shouldn't indicate cut-off point by reappraising the data mentioned in that study. Our study promoted that 4c was the optimal cut-off point (Youden's index: 0.433, highest), AUC was 0.771 for B mode ultrasound. Secondly, the different inclusion criteria caused different results. The nodules were 10mm or larger in their study, but there wasn't restriction on size in our study, which met the medical demand nowadays, because more and more small thyroid nodules were found by booming ultrasound technology. Furthermore, different malignant proportion of nodules caused different results. The malignant nodules in our study were more than the benign ones because we tried to avoid unnecessary FNAC and surgery operations. This malignant proportion was higher than that in natural world and in the other studies. Thirdly, our study evaluated different coefficients by 2D SWE and 3D SWE.
Further study on combination of B-mode ultrasound with 2D SWE and 3D SWE demonstrated that B + 2D SWE, B-mode + 3D SWE, B + 2D + 3D SWE I (any one was positive: suspicious) had higher sensitivity and accuracy values than those of 3 singular methods alone and B + 2D + 3D SWE II (any two of these methods were positive: suspicious), but lower specificity values. Among them, B-mode ultrasound + 2D SWE had the highest sensitivity, NPV, accuracy and Youden's index. In conclusion, the combination of B-mode ultrasound with 2D/3D SWE improved diagnostic value significantly, and B-mode + 2D SWE could be the optimal combination method in differential diagnosis. Some earlier reports had the similar conclusion [14-15], but Wang F et al found that adding SWE to conventional US did not improve diagnostic performance [12].
In addition, significant positive direct relationships were found between the relevant elastography values in sagittal section of 2D SWE and of 3D SWE; also in transverse section of 2D SWE and of 3D SWE. These results meant that SWE technique had fine relevance in different sections of 2D and 3D methods.
This study had some pities and limitations. Firstly, all the malignant thyroid nodules were papillary carcinomas. Additional studies with a greater variety of malignant thyroid nodules should be established. Secondly, different size of nodules would affect the stiffness of parenchyma; further studies would analyze the diagnostic value of 2D&3D SWE in different size group. Thirdly, the methods used in combining conventional B-mode ultrasound with 2D&3D SWE could be improved with more studies. The last but not the least, because we tried to avoid unnecessary FNAC and surgery operations, the malignant proportion in this study was higher than that in the other studies. But we still persevere in choosing necessary and ethical medical means for patients as we take the Hippocratic oath every day.
In conclusion, 2D and 3D SWE technology could provide quantitative elastography values. The combination methods, B-mode + 2D SWE and B-mode + 2D SWE + 3D SWE could improve the diagnostic value of differentiating malignant from benign thyroid solid nodules comparing with conventional B-mode ultrasound.
Abbreviations
2D/3D SWE: Two-dimensional/three-dimensional real-time shear wave elastography; FNAC: Fine needle aspiration cytology; TI-RADS : Thyroid Imaging Reporting and Data System; SWV: Shear wave propagation velocity; S-Emean : Mean elasticity value in sagittal section; T-Emax: Max elasticity value in transverse section; E-ratio: Ratio of mean elasticity value of nodule and surrounding normal thyroid tissue; 3D-C-Emean: Mean elasticity value in coronal section of three-dimensional real-time shear wave elastography.
Acknowledgements
This study was supported by the Scientific Research Plan Project of Shanghai Science and Technology Commission (grant number. 16411968800).
Funding
This study was supported by the Scientific Research Plan Project of Shanghai Science and Technology Commission (grant number. 16411968800).
Competing Interests
The authors have declared that no competing interest exists.
References
1. American Thyroid Association (ATA) Guidelines Taskforce on Thyroid Nodules and Differentiated Thyroid Cancer, Cooper DS, Doherty GM, Haugen BR, et al. Revised American Thyroid Association management guidelines for patients with thyroid nodules and differentiated thyroid cancer. Thyroid. 2009;19(11):1167-1214
2. Jemal A, Siegel R, Ward E, Hao Y, Xu J, Murray T, Thun MJ. Cancer statistics. CA Cancer J Clin. 2008;58(2):71-96
3. Davies L, Welch HG. Current thyroid cancer trends in the United States. JAMA Otolaryngol Head Neck surg. 2014;140(4):317-322
4. Nix P, Nicloaides A, Coatesworth AP. Thyroid cancer review: presentation and investigation of thyroid cancer. International Journal of Clinical Practice. 2005;59(11):1340-1344
5. Lin JS, Bowles EJA, Williams SB, Morrison CC. Screening for thyroid cancer: updated evidence report and systematic review of the US Preventive services task force. JAMA. 2017;317(18):1888-1903
6. Han R, Li F, Wang Y, Zhang Y. Virtual touch tissue quantification (VTQ) in the diagnosis of thyroid nodules with coexistent chronic autoimmune Hashimoto's thyroiditis: A preliminary study. Eur J Radiol. 2015;84(2):327-331
7. Cosgrove DO, Berg WA, Dore CJ, Skyba DM, Henry JP, Gay J, Cohen-Bacrie C, BE1 study Group. Shear wave elastography for breast masses is highly reproducible. Eur Radiol. 2012;22(5):1023-1032
8. Lee SH, Chang JM, Kim WH, Bae MS, Cho N, Yi A, Koo HR, Kim SJ, Kim JY, Moon WK. Differentiation of benign from malignant solid breast masses: comparison of two-dimensional and three-dimensional shear-wave elastography. Eur Radiol. 2013;23(4):1015-1026
9. Choi HY, Sohn YM, Seo M. Comparison of 3D and 2D shear-wave elastography for differentiating benign and malignant breast masses: focus on the diagnostic performance. Clin Radiol. 2017;72(10):878-886
10. Marco J, Trottmann M, Rubenthaler J, D'Anastasi M, Stief CG, Reiser MF, Clevert DA. Three-dimensional vs. two-dimensional shear-wave elastography of the testes-preliminary study on a healthy collective. Clin Hemorheol Microcirc. 2016;64(3):447-456
11. Zhu J, Qi L, Miao Y, Ma T, Dai C, Qu Y, He Y, Gao Y, Zhou Q, Chen Z. 3D mapping of elastic modulus using shear wave optical micro-elastography. Sci Rep. 2016;20(6):35499
12. Wang F, Chang C, Gao Y, Chen YL, Chen M, Feng LQ. Does shear wave elastography provide additional value in the evaluation of thyroid nodules that are suspicious for malignancy? J Ultrasound Med. 2016;35(11):2397-2404
13. Chen M, Zhang KQ, Xu YF, Zhang SM, Cao Y, Sun WQ. Shear wave elastography and contrast-enhanced ultrasonography in the diagnosis of thyroid malignant nodules. Mol Clin oncol. 2016;5(6):724-730
14. Nattabi HA, Sharif NM, Yahya N, Ahmad R, Mohamad M, Zaki FM, Yusoff AN. Is diagnostic performance of quantitative 2D-shear wave elastography optimal for clinical classification of benign and malignant thyroid nodules?: A systematic review and meta-analysis. Acad Radiol. 2017 [Epub ahead of print]
15. Liu Z, Jing H, Han X, Shao H, Sun YX, Wang QC, Cheng W. Shear wave elastography combined with the thyroid imaging reporting and data system for malignancy risk stratification in thyroid nodules. Oncotarget. 2017;8(26):43406-43416
16. Zhao CK, Chen SG, Alizad A, He YP, Wang Q, Wang D, Yue WW, Zhang K, Qu S, Wei Q, Xu HX. Three-Dimensional Shear Wave Elastography for Differentiating Benign From Malignant Thyroid Nodules. J Ultrasound Med. 2018;37(7):1777-1788
17. Mazziotti G, Sorvilol F, Iorio S, Carbone A, Romeo A, Piscopo M, Capuano S, Amato G, Carella C. Grey-scale analysis allows a quantitative evaluation of thyroid echogenicity in the patients with Hashimoto's thyroiditis. Clinical Endocrinoloty. 2003;59(2):223-229
18. Horvath E, Majlis S, Rossi R, Franco C, Niedmann JP, Castro A, Dominquez M. An ultrasonogram reporting system for thyroid nodules stratifying cancer risk for clinical management. J Clin Endocrinol Metab. 2009;94(5):1748-1752
19. J.Fernandez Sancher. TI-RADS classification of thyroid nodules based on a score modified according to ultrasound criteria for malignancy. Rev Argent Radiol. 2014;78(3):138-148
20. Kwak JY, Han KH, Yoon JH, Moon HJ, Son EJ, Park SH, Jung HK, Choi JS, Kim EK. Thyroid imaging reporting and data system for US Features of Nodules: A step in establishing better stratification of cancer risk. Radiology. 2011;260(3):892-899
21. Kwak JY, Jung I, Baek JH, Baek SM, Choi N, Choi YJ, Jung SL, Kim EK, Kim JA, Kom JH, Kim KS, Lee JH, Moon HJ, Moon WJ, Park JS, Ryu JH, Shin JH, Son EJ, Sung JY, Na DG. Image reporting and characterization system for ultrasound features of thyroid nodules: multicentric Korean retrospective study. Korean J Radiol. 2013;14(1):110-117
22. Xu SY, Zhan WW, Wang WH. Evaluation of Thyroid Nodules by a Scoring and Categorizing Method Based on Sonographic Features. J ultrasound med. 2015;34(12):2179-2185
23. Li X, Wang JN, Fan ZY, Kang S, Liu YJ, Zhang YX, Wang XM. Determination of the elasticity of breast tissue during the menstrual cycle using real-time shear wave elastography. Ultrasound Med Biol. 2015;41(12):3140-3147
24. Yoon JH, Lee HS, Kim EK, Moon HJ, Kwak JY. Thyroid Nodules: Nondiagnostic Cytologic Results according to Thyroid Imaging Reporting and Data System before and after Application of the Bethesda System. Radiology. 2015;276(2):579-587
Author contact
![]() Corresponding authors: Jing Du. E-mail: beautydujingcom; Feng-Hua Li. E-mail: lifenghuacom
Corresponding authors: Jing Du. E-mail: beautydujingcom; Feng-Hua Li. E-mail: lifenghuacom