Impact Factor ISSN: 1837-9664

 Global reach, higher impact
J Cancer 2019; 10(10):2319-2331. doi:10.7150/jca.29178 This issue Cite
Research Paper
PPARα gene is a diagnostic and prognostic biomarker in clear cell renal cell carcinoma by integrated bioinformatics analysis
Yongwen Luo1,2,3*, Liang Chen1*, Gang Wang2,3,4, Guofeng Qian5, Xuefeng Liu6, Yu Xiao1,2,3,4, Xinghuan Wang1,7, Kaiyu Qian2,3 ![]()
1. Department of Urology, Zhongnan Hospital of Wuhan University, Wuhan, China
2. Department of Biological Repositories, Zhongnan Hospital of Wuhan University, Wuhan, China
3. Human Genetics Resource Preservation Center of Wuhan University, Wuhan, China
4. Laboratory of Precision Medicine, Zhongnan Hospital of Wuhan University, Wuhan, China
5. Department of Endocrinology, the First Affiliated Hospital of Zhejiang University, Hangzhou, China
6. Department of Pathology, Lombardi Comprehensive Cancer Center, Georgetown University Medical School, Washington DC, USA
7. Medical Research Institute, Wuhan University, Wuhan, China
*These authors contributed equally to this work.
Received 2018-8-12; Accepted 2019-4-11; Published 2019-5-22
Abstract
Genetic alterations in lipid metabolism genes are correlated with progression and poor prognosis of Clear cell renal cell carcinoma (ccRCC). PPARα play a critical role in lipid metabolism. This study aimed to identify that PPARα is a diagnosis and prognostic biomarker in ccRCC by integrated bioinformatics analysis. UALCAN database was used to explore the differential expression status and prognostic value of PPARα gene in various tumor types, qRT-PCR and immunohistochemical staining experiments were utilized for validation. Next, ccRCC data were obtained from TCGA. Correlation between PPARα expression levels and patients' clinicopathological characteristics was assessed, and the clinically diagnosis and prognostic value of PPARα were explored in ccRCC. According to the gene set enrichment analysis (GSEA) analysis, PPARα gene associated biological pathways were identified. PPARα has prognostic significance only in ccRCC tumors. Expression of PPARα was associated with ccRCC stages. PPARα was significantly down-regulated in ccRCC and associated with survival. Gender, tumor dimension, grade and stage showed a significant relevance with PPARα expression. Lower PPARα expression revealed significantly poorer survival and progression compared with higher PPARα expression. Adjusted by other clinical risk factors, PPARα remained an independent prognostic factor. Moreover, Low PPARα expression was a potential diagnostic biomarker of ccRCC. A nomogram was constructed based on PPARα expression and other clinicopathological risk factors, and it performed well in predict patients survival. GSEA analysis showed that PPARα gene associated biological pathways were enriched in mTOR pathway, AKT pathway, IGF1-mTOR pathway and Wnt signaling pathways. In conclusion, PPARα expression was decreased in ccRCC tumors. Lower expression of PPARα is closely correlated with poorer survival. It can be used as a clinically diagnosis and prognostic biomarker in ccRCC.
Keywords: PPARα, clear cell renal cell carcinoma (ccRCC), biomarkers, gene set enrichment analysis (GSEA), nomogram
Introduction
Renal cell cancer (RCC) accounts for 2 - 3 % of all cancers, with ninth most common malignancy in Western countries [1]. The incidence rates of RCC increased by about 2 % over the last two decades, both in Europe and worldwide [2]. In 2012, there were about 84,400 new cases of RCC and 34,700 kidney cancer related deaths in the European Union [3]. Approximately 80% - 90% of RCC are clear cell renal cell cancer (ccRCC) [4]. New therapies have improved survival of patients indeed, however, median overall survival and progression-free are nearly 2 years, most patients eventually become surrender or resistance [5]. Therefore, more effectively diagnostic biomarkers and therapeutic targets are pressing needed.
Peroxisome proliferators-activated receptor alpha (PPARα) is located on the nucleus and belongs to the type II nuclear hormone receptor superfamily. It is a type of transcription factor that depends on ligand activation [6, 7]. PPARα was originally discovered as a peroxisomal proliferative factor and a fatty acid 8-oxidation regulator whose transcriptional activity is activated by binding to ligand fatty acids and their derivatives. Activated PPARα interacts with PPARα-responsive elements in target genes and binds to specific DNA sequences, thereby regulating a series of related gene transcriptions [8]. In recent years, the role of PPARα in tumors has caused great concern and the anti-tumor activity of PPARα has become a research hotspot. Holand et al. [9] first discovered that PPARα is highly expressed in human endometrial cancer tissues. Subsequently, many studies have shown that PPARα is abnormal expressed in many tumor tissues such as ovarian cancer, melanoma, breast cancer, lung carcinoma and hepatocarcinoma [10-14]. However, the expression of PPARα in ccRCC and its role in tumor progression are not clear.
The Cancer Genome Atlas (TCGA) database is a large cancer database that integrates multiple cancers genome sequencing data with clinical data, which includes genomic sequencing data of 33 kinds of cancers and 26 tissue types. Researchers are able to assess the prognostic value of various genes in tumors according to data mining in TCGA.
Therefore, in this study, we aimed to acknowledge the role of PPARα in ccRCC based on analysis ccRCC data from the TCGA database. By exploring the correlation between PPARα and the clinicopathological features of ccRCC, and analyzing the relationship between PPARα and prognosis, we observed the value of PPARα in clinical diagnosis, treatment and prognosis of ccRCC, and provided the basis for the clinical research of ccRCC.
Material and methods
UALCAN data analysis
UALCAN (http://ualcan.path.uab.edu/index.html) is a user-friendly, interactive website for analyzing cancer transcriptome data. UALCAN can: (a) provide users with very comprehensive cancer transcriptome data (TCGA and MET500 transcriptome sequencing), (b) allow users to identify biomarkers or to perform validation of potential genes of interest in silico, (c) provide publication quality graphs and plots depicting gene expression and patient survival information based on gene expression, (d) evaluate gene expression in molecular subtypes of breast and prostate cancer, (e) provide additional information about the selected genes using links to HPRD, GeneCards, Pubmed, TargetScan and The human protein atlas.
GEO Data collection
Expressing profiles of mRNA data of ccRCC cancer were downloaded from Gene Expression Omnibus (GEO) database (http://www.ncbi.nlm.nih.gov/geo/). Dataset GSE36895 (Affymetrix Human Genome U133 Plus 2.0 Array), Dataset GSE53757 (Affymetrix Human Genome U133 Plus 2.0 Array) and dataset GSE6344 (Affymetrix Human Genome U133A Array) were used for validation [15, 16]. For the microarray analyses, we used RMA background correction for the raw expression data at first, and log2 transformation and normalization were performed for processed signals. Then we used “affy” R package to summarize the median-polish probe sets. Probes were annotated by the Affymetrix annotation files. Limma package in R package was used to screen the differentially expressed genes (DEGs) between tumor tissues and normal ones.
TCGA Data collection and Data preprocessing
Published raw counts of mRNA expression data and corresponding clinical information of patients were obtained from The Cancer Genome Atlas (TCGA) (https://tcga-data.nci.nih.gov/tcga/). “EdgSeq” a package of R software (version 3.3.2, R Foundation for Statistical Computing, Vienna, Austria), was used in the normalization of mRNA-seq data. Expression matrix was formed with the expression value after normalization of each mRNA of each sample. The normalized data were arranged in the order of tumor tissues and paracancerous normal tissues. Then make comparisons between tumor tissues and paracancerous normal tissues to screen the differentially expressed genes. |log2FC|>1 and FDR<0.05 were used as the cut-off threshold.
Construction and assessment of the nomogram
The nomogram, calibration plots and decision curve were generated using “rms”and “rmda” packages of R software (version3.4.0). Nomogram was used as a predict device to assess patients prognosis, which has the ability to generate an individual probability of a clinical event by integrating various prognostic factors [17, 18]. Calibration was used to assess the performance of the 5-year OS nomogram. Nomogram-predicted survival and observed outcome were plotted on the x-axis and y-axis respectively, and the 45-degree line represented the best prediction. The Harrell's concordance index (C-index) was performed to estimate the predictive accuracy of the OS nomogram. The value of the C-index ranges from 0.5 to 1.0, with 0.5 indicating a random chance and 1.0 indicating a perfect ability to correctly discriminate the outcome with the model. Additionally, decision curve analysis (DCA) was also performed to assess the clinical utility of the nomogram. The DCA could be used to assess and compare prediction models which incorporated clinical consequences [19, 20]. The x-axis indicated the percentage of threshold probability, and the y-axis represented the net benefit.
Gene set enrichment analysis
Median expression value of PPARα expression level was used as the cut-off point. 538 ccRCC samples from TCGA database were divided into high expression group and low expression group. GSEA (http://software.broadinstitute.org/gsea/index.jsp) [21] was conducted to analyze PPARα gene associated biological pathways. Annotated gene sets c2.cp.biocarta.v6.0.symbols.gmt was chosen as the reference gene sets. Gene size ≥ 20, FDR < 0.01, |enrichment score (ES) | > 0.65 and were used as the cut-off criteria.
Human renal cancer and paracancerous tissue samples
The renal cancer and paracancerous tissue samples were obtained from patients after surgery at Zhongnan Hospital of Wuhan University, informed consent was collected from all subjects, and the histology diagnosis was confirmed pathologically by two pathologists independently. All the tissues were immediately stored in liquid nitrogen or fixed in 4% PFA after collection from the operation room. The informed consent was signed by all subjects. All specimens' collection and treatment were carried out in accordance with the approved guidelines according to the Ethics Committee at Zhongnan Hospital of Wuhan University (approval number: 2015029).
RNA isolation and quantitative real-time PCR
Total RNA was isolated by HiPure Total RNA Mini Kit (Magen, China) from ccRCC cancer and paracancerous tissues. Quantity of isolated RNA was measured by NanoDrop. The reverse transcription reaction was performed with ReverTra Ace qPCR RT Kit (Toyobo, China). 1μl of the resulting cDNAs were used as templates for each reaction of the RT-PCR with iQTM SYBR® Green Supermix (Bio-Rad, USA) in a final volume of 20 μl. Primers used for PPARα: 5'-ATGGTGGACACGGAAAGCC-3' (forward), 5'-CGATGGATTGCGAAATCTCTTGG-3' (reverse), annealing temperature was 60°C. Primers used for GAPDH (loading control): 5'-TGCACCACCAACTGCTTAG-3' (forward), 5'-GATGCAGGGATGATGTTC-3' (reverse), annealing temperature was 60°C. Fold enrichment was calculated with the -ΔΔCt method relative to GAPDH.
IHC staining assays
IHC was performed with renal tumor tissue sections, as described previously [22]. Briefly, after deparaffinization, hydration and antigen retrieval, the samples were incubated with a primary antibody to PPARα (1:100 dilution; abcam cat# ab24509) overnight at 4°C. After a washing procedure, a broad-spectrum secondary antibody was incubated. The sections were photographed with the Olympus BX53 biomicroscope. All staining was independently assessed by two pathologists.
Statistical analysis
All statistical analyses were performed with R software 3.4.0. Statistical significance was set at probability values of p < 0.05. Two-tailed Student's t-test was used for significance of differences between subgroups. χ2 test was applied to analyze the correlation between PPARα expression and clinicopathological parameters. Kaplan-Meier survival curves were built to analyze survival differences between the high expression group and low expression group and compared by log rank test. Univariate and multivariate Cox proportional-hazard models were performed to estimate the hazard ratios of prognostic factors, Wald test was applied to compare whether an independent variable has a statistically significant relationship with a dependent variable. The Akaike information criterion (AIC) and Harrell's concordance index (C-index) were compared for the predictive accuracy of the prognostic models.
Results
PPARα expression in various cancer and association with survival
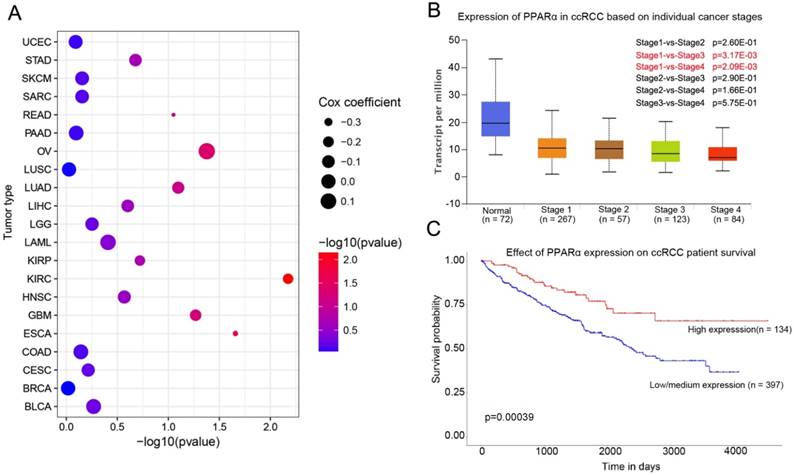
PPARα mRNA expression in various tumor types and corresponding normal tissues were assessed using the UALCAN database. The results showed that PPARα mRNA was significantly down-regulated in urothelial carcinoma (BLCA), breast invasive carcinoma (BRCA), colon adenocarcinoma (COAD), kidney renal clear cell carcinoma (KIRC), prostate adenocarcinoma (PRAD), kidney renal papillary cell carcinoma (KIPR), uterine corpus endometrial carcinoma (UCEC), pheochromocytoma and paraganglioma (PCPG), and cholangio carcinoma (CHOL) (Supplementary Table S1, p < 0.05). The differential expression was up-regulated only in lung squamous cell carcinoma (LUSC) (p < 0.05; Supplementary Table S1). We further analyzed the association of PPARα expression and patients' survival. The results showed that PPARα only has prognostic significance in ccRCC (Figure 1C). Moreover, expression of PPARα was associated with ccRCC stages (Figure 1B). The OncoLnc database (http://www.oncolnc.org/) also showed expression of PPARα was associated with survival of ccRCC patients, which was an independent protect factor (p =0.0067; cox coefficient = -0.217; Figure 1A). Then we validated it in TCGA database. TCGA ccRCC specimens consisted of 538 tumor specimens and 72 normal kidney specimens. The expression levels of PPARα were lower in tumor specimens compared with normal kidney tissues (11.5 ± 0.0272 vs 12.6 ± 0.0765, p < 0.0001, Figure S1A). Moreover, we validated it in GEO database, we selected GSE53757 and GSE6344 for validation and the result was consistent with TCGA (Figure S1B-C). The qRT-PCR results of 20 paired tumor and normal tissues from our department of biological repositories were also consistent with TCGA and GEO (Figure S1D).
PPARα expression in various cancer and correlation with stages and survival in ccRCC. (A) Bubble chart showing the correlation between PPARα and different tumor types in the Oncolnc database. The x-axis represents -log10 (p value), and y-axis represents the abbreviation of diverse cancer types (the full name of each cancer could be found in the Oncolnc database). The size and color of the bubble indicates the Cox coefficient and -log10 (p value), respectively. (B) Box plot showing the correlation between PPARα and kidney renal clear cell cancer stages in UALCAN database. (C) Kaplan-Meier survival curves revealing PPARα expression and survival probability in renal clear cell cancer.
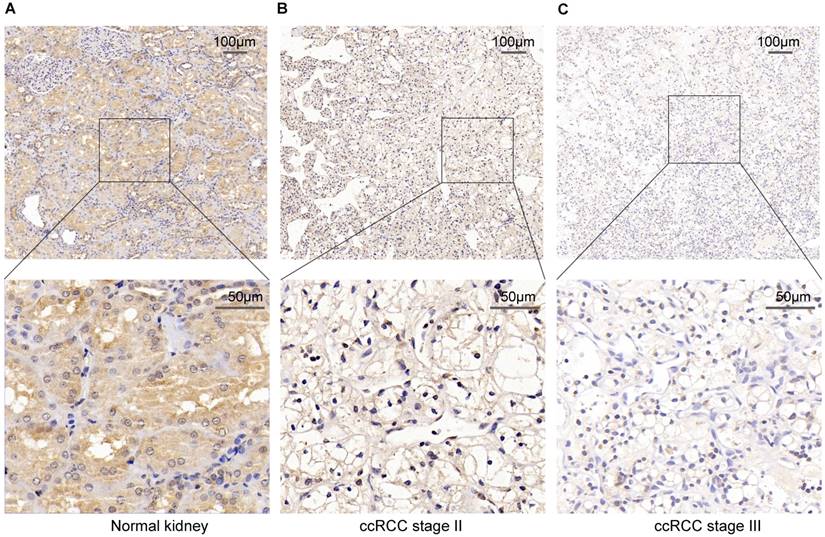
To verify the above result, we used IHC staining to analysis the PPARα protein expression. The result also represented that PPARα protein expression was lower in ccRCC tumor tissues than the adjacent normal tissues. As the tumor progressed, PPARα protein expression was further decreased (Figure 2). Therefore, the above data analysis results showed that PPARα may be a potential specific prognosis marker for ccRCC.
PPARα protein expression in ccRCC tumor tissues and the adjacent normal tissues using Immunohistochemical staining (IHC). (A) High IHC staining of PPARα are in the adjacent normal specimen. (B) Moderate IHC staining of PPARα are in the ccRCC stage Ⅱ tumor specimen. (C) Low IHC staining of PPARα are in the ccRCC stage Ⅲ tumor specimen. Images are presented at ×100 (upper) and ×400 (lower) magnification.
Relationship between PPARα expression levels and patients' clinicopathological characteristics
Clinicopathological data of ccRCC patients were collected including race, age, gender, tumor dimension, laterality, neoadjuvant therapy, stage and grade from TCGA database. Tumor grade and stage classification were carried out according to Fuhrman classification system and the 2010 AJCC TNM classification [23, 24]. After removing patients with incomplete clinicopathological information, 512 ccRCC patients were divided into high PPARα expression group and lower PPARα expression group according to the median value of PPARα expression level. The PPARα expression groups and clinicopathological data were listed in Table 1. PPARα expression status was not correlated with age (p = 0.746), race (p = 0.223), laterality (p = 0.600) and neoadjuvant therapy (p = 0.324). However, gender (p = 0.013), tumor dimension (p = 0.034), stage (p < 0.001) and grade (p < 0.001) showed significantly relevant with PPARα expression (Table 1).
Association between the expression of PPARα and clinicopathological characteristics
| Total patients | PPARα expression | |||
|---|---|---|---|---|
| Variable | No(%) | Low group | High group | P |
| Race | 0.223 | |||
| Black or frican american | 52(10.2) | 29(55.8) | 23(44.2) | |
| White | 452(88.3) | 221(48.9) | 231(51.1) | |
| Asian | 8(1.5) | 6(75.0) | 2(25.0) | |
| Age, Mean ± SD, (years) | 60.6 ±12.1 | 60.6 ±12.4 | 60.4±11.9 | 0.746 |
| Age | 0.774 | |||
| <65 | 324(63.3) | 165(50.9) | 159(49.1) | |
| ≥65 | 188(36.7) | 99(52.7) | 89(47.3) | |
| Gender | 0.013 | |||
| Male | 332(64.8) | 185(55.7) | 147(44.3) | |
| Female | 180(35.2) | 79(43.9) | 101(56.1) | |
| Tumor dimension, Mean ± SD | 1.68 ±0.655 | 1.61 ±0.611 | 1.74 ±0.693 | 0.034 |
| Laterality | 0.600 | |||
| Left | 238(46.5) | 118(49.6) | 120(50.4) | |
| Right | 273(53.3) | 137(50.2) | 136(49.8) | |
| Bilateral | 1(0.2) | 1(100) | 0(0) | |
| Neoadjuvant therapy | 0.324 | |||
| No | 495(96.7) | 245(49.5) | 250(50.5) | |
| Yes | 17(3.3) | 11(64.7) | 6(35.3) | |
| Stage | <0.001 | |||
| Ⅰ | 259(50.7) | 114(43.2) | 145(56.8) | |
| Ⅱ | 52(11.0) | 26(44.1) | 26(55.9) | |
| Ⅲ | 119(23.0) | 68(56.1) | 51(43.9) | |
| Ⅳ | 82(15.3) | 56(68.3) | 26(31.7) | |
| Grade | <0.001 | |||
| 1 | 14(2.64) | 4(28.6) | 10(71.4) | |
| 2 | 220(44.3) | 101(43.8) | 119(56.2) | |
| 3 | 204(38.9) | 102(49.5) | 102(50.5) | |
| 4 | 74(14.2) | 57(76.0) | 17(24.0) |
Kaplan-Meier survival analysis and subgroup analysis
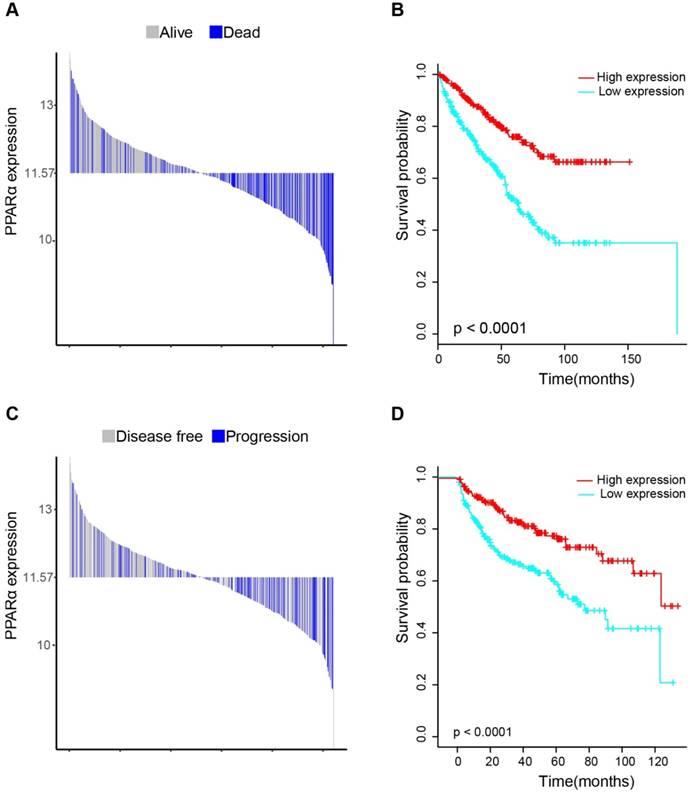
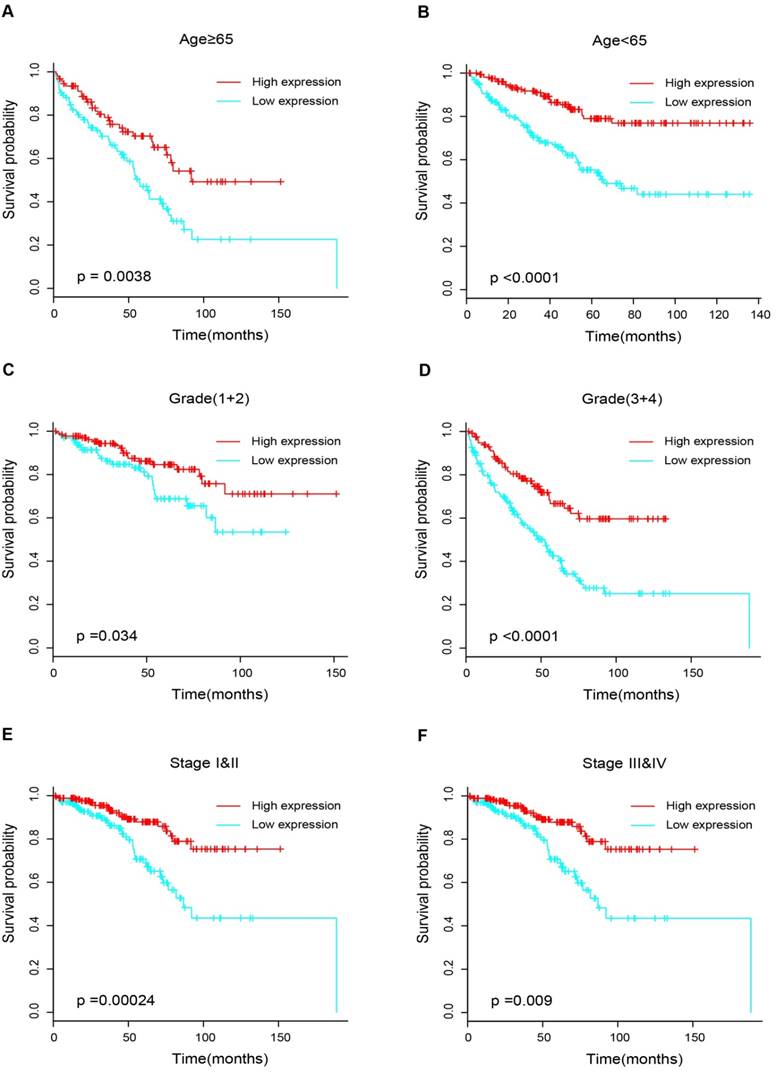
17 patients with follow up time < 1 month were excluded to avoid the interference of unrelated causes of death. All 495 patients were analyzed to explore the clinical significance of PPARα expression. Patients with ccRCC were divided into high expression group and low expression group using median value as a cut-off. We assessed the distribution of PPARα expression and survival status, patients in low expression group had poorer overall survival (OS) and disease free survival (DFS), while patients in high expression group showed a favorable OS and DFS (Figure 3A). Then we performed Kaplan-Meier survival analyses, patients in low expression group revealed significantly poorer survival and progression than those in high expression group (p < 0.0001, Figure 3B). We further analyzed patients with various clinicopathological risk factors. Importantly, PPARα remained a statistically significant prognostic factor stratified by age, grade, stage (shown in Figure 4).
Distribution of PPARα expression and Kaplan-Meier survival analysis between patients at low and high expression group of PPARα. (A-C) represent the bar distribution of each patient's PPARα expression (dichotomized at the median). The results show that patients with PPARα expression <11.573 had poorer overall survival (OS) and disease-free survival (DFS), when compared with patients with PPARα expression >11.573. (B-D) show Kaplan-Meier survival analysis between patients at low and high expression group of PPARα. Patients in low expression group revealed significantly poorer survival and progression than those in high expression group. The p value is determined by the log-rank test.
Kaplan-Meier survival subgroups analysis of PPARα to evaluate prognostic values. The patients were stratified into six subgroups based on age≥65 (A), age<65(B), grade 1&2 (C), grade 3&4 (D), stage I & II (E) and stage III & IV (F).
Univariate and multivariate cox regression analyses for PPARα prognostic ability
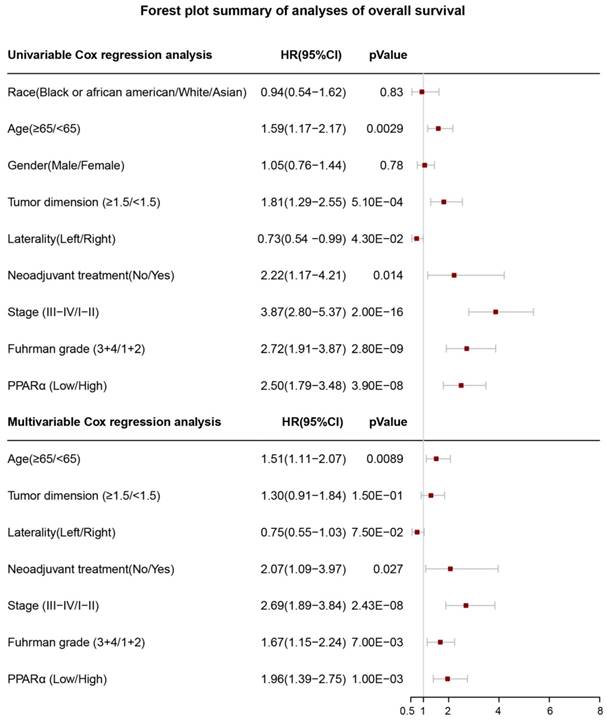
In order to investigate whether PPARα performed a clinically independent prognostic value in ccRCC patients, we conducted univariate and multivariate Cox regression analyses. The PPARα expression and other clinicopathological data, including race, age, gender, tumor dimension, laterality, neoadjuvant therapy, grade and stage were included as covariates. The result revealed that even adjusted by age and other covariates, the PPARα remained to be significantly correlated with patients' survival (Figure 5). Moreover it was also correlated with patients' DFS (Figure S2).
Forest plot summary of analyses of overall survival (OS). Univariable and multivariable analyses of race, age, gender, tumor demension, laterality, neoadjuvant therapy, stage, Fuhrman grade and PPARα expression group for overall survival (OS) in ccRCC patients. The red squares on the transverse lines represent the hazard ratio (HR), and the gray transverse lines represent 95% CI.
Low PPARα expression as a potential diagnostic biomarker of ccRCC
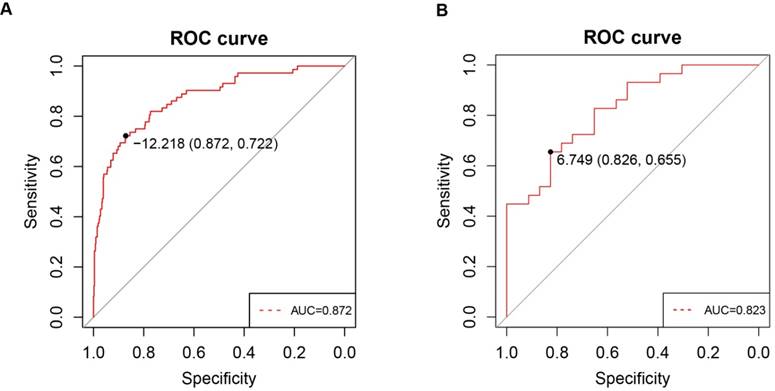
To investigate whether PPARα expression in clinic patients could be used to diagnose ccRCC, we explored correlations between the clinic specimens and PPARα expression. A strong correlation was found between PPARα expression and ccRCC (r = -0.415; p < 2.2e-16). A ROC curve was generated to verify the diagnostic performance of PPARα expression levels in ccRCC. The AUC of PPARα expression for the diagnosis of ccRCC was 0.872 (95 % CI, 0.826 - 0.918; p < 0.001) with a sensitivity of 87.2 %, a specificity of 72.2 % and a diagnostic threshold value of 12.21(Figure 6A), then another GEO microarray GSE36895 was performed for validation, The AUC was 0.823 (95 % CI, 0.713 - 0.934; p < 0.001) with a sensitivity of 82.6 %, a specificity of 65.5 % and a diagnostic threshold value of 6.75 (Figure 6B) .
ROC curve analysis of PPARα diagnosis. Receiver operating characteristic (ROC) curves and area under the curve (AUC) statistics are used to evaluate the capacity to discriminate ccRCC from normal controls with excellent specificity and sensitivity in (A) TCGA dataset and (B) GSE36895 microarray dataset.
Construction of nomograms prognostic model based on PPARα expression
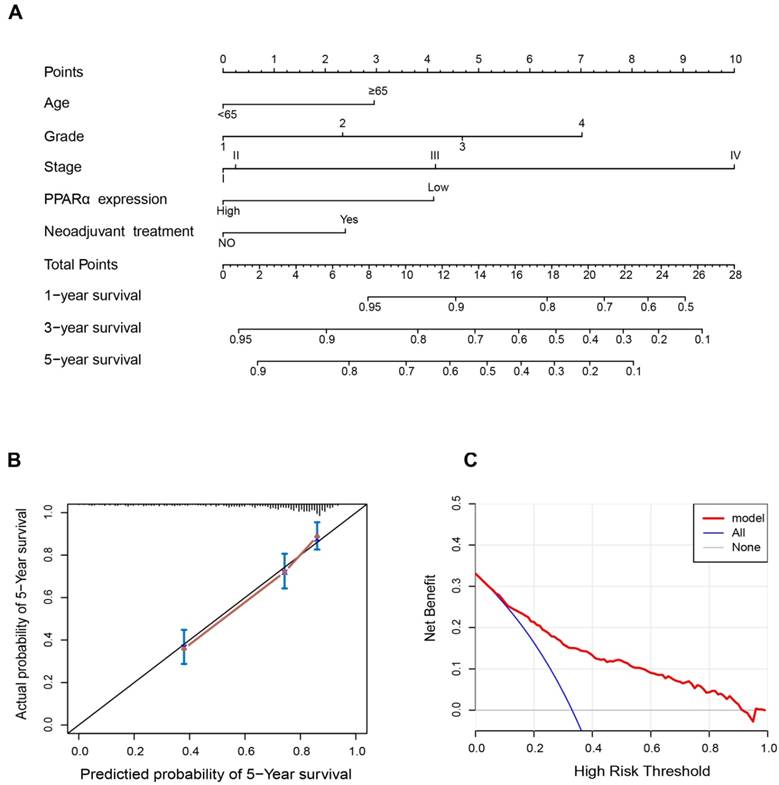
Since PPARα performed a strong prognostic value, we explored its potential to improve prognostic accuracy of ccRCC clinicopathological factors. After incorporating PPARα gene, the accuracy and efficiency of the age, grade and stage to predict OS of ccRCC patients were improved (Table 2). The combination of PPARα gene and other prognostic factors represented lower AICs and higher c-indices than other prognostic factors alone. Based on the above results, we integrated both PPARα expression and other clinicopathological prognostic foctors including age, neoadjuvant treatment, grade and stage, then constructed a nomogram predictive model to better predict clinical outcomes. All included risk factors were quantified as numeric scores. We could predict survival rate of ccRCC patients according to total points of all risk factors (Figure 7A). The calibration plot indicated that the nomogram showed good performance for OS of 5-year survival (Figure 7B). The Harrell's concordance index for OS was 0.776 (95% CI, 0.68 - 0.89). Decision Curve Analysis (DCA) was used to estimate the potential of clinical utility of the nomogram. The net benefit of DCA was calculated by subtracting the ratio of false-positive patients from the ratio of true-positive patients. The nomogram performed high potential of clinical utility, as better net benefits were obtained compared with the treat-all or the treat-none option (Figure 7C).
Comparison of the predictive accuracy of the prognostic models.
| Model | Overall survival | |
|---|---|---|
| C-index | AIC | |
| PPARα | 0.621±0.024 | 1894.73 |
| Age | 0.548± 0.02 | 1853.80 |
| PPARα+ Age | 0.636±0.024 | 1825.79 |
| Neoadjuvant treatment | 0.515± 0.01 | 1857.81 |
| PPARα+Neoadjuvant treatment | 0.631± 0.023 | 1825.13 |
| Grade | 0.622± 0.021 | 1827.25 |
| PPARα+Grade | 0.671±0.023 | 1803.68 |
| Stage | 0.692±0.02 | 1790.10 |
| PPARα+Stage | 0.728±0.023 | 1773.80 |
Nomogram and calibration plots for the prediction of outcomes in patients with clear cell renal cell carcinoma (ccRCC). (A) Nomogram for the prediction of OS at 1, 3 and 5 years after nephrectomy. (B) The calibration plots for predicting OS at 5 years, Diagonal line: ideal model, vertical bars: 95% confidence interval. (C) Decision curve analysis (DCA) for assessment of the clinical utility of the nomogram. The x-axis indicates the percentage of threshold probability, and the y-axis indicates the net benefit.
Identification of PPARα gene associated biological pathways
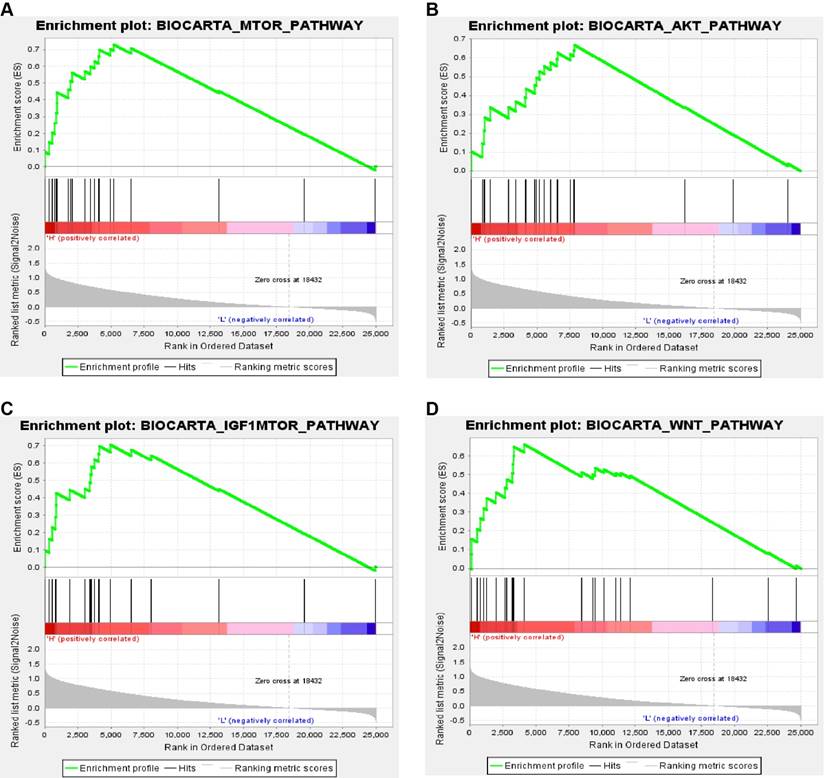
In order to explore biological function of PPARα expression, GSEA was used to map into biocarta pathways database. Under the cut-off criteria gene size ≥ 20, FDR < 0.01, and |enrichment score (ES) | > 0.65. Results revealed that high expression samples were enriched in mTOR pathway, AKT pathway, IGF1-mTOR pathway and Wnt signaling pathways (Figure 8).
Gene set enrichment analysis (GSEA) associated with PPARα expression. The gene sets of (A) “MTOR_PATHWAY”, (B) “AKT_PATHWAY”, (C) “IGF1-MTOR _PATHWAY” and (D) “WNT_PATHWAY were enriched in ccRCC samples with PPARα highly expressed.
Discussion
In this study, we firstly investigated the diagnostic and prognostic value of PPARα in ccRCC patients, the results showed PPARα is a specific diagnostic and prognostic biomarker in ccRCC patients, significantly low expressed in ccRCC specimens and correlated with age, gender, stage and grade. Lower PPARα expression correlated with poorer survival and progression. When adjusted by other clinicopathological risk factors, PPARα remained a statistically significant prognostic factor. Moreover, incorporation of PPARα expression into other clinical prognostic variables could improve the predictive accuracy of the other prognostic factors. Then we combined PPARα with other clinicopathological prognostic variables to construct a now nomogram, which could provide a better prediction for survival in ccRCC patients.
Previous studies revealed that PPARα is associated with multiple tumor types. The biological role of PPARα in lung cancer has been extensively investigated within the past decade. Kaipainen et al. [25] used a mouse xenograft model to explore the role of PPAR suppressing tumor growth. The result demonstrated that PPAR deficiency in the host animals inhibits tumor growth of Lewis lung carcinoma (LLC) cells and lung and liver metastasis of B16 melanoma cells. Interestingly, the same research group found that PPAR agonists such as fenofibrate and WY-14,643 have the same antitumorigenic and antiangiogenic effects via host PPAR [12]. Also, Skrypnyk et al. [26] found that bezafibrate and Wyeth-14,643 as PPAR ligands, effectively suppresses metastatic NSCLC growth and tumor angiogenesis. Moreover, activated PPARα by N-Acetyl-Cysteine (NAC) increases p53 expression and reduces NFκB/p65 levels leading to suppression of NSCLC cell growth [27]. In this process NAC/PPAR signaling is required for the inhibition of 3-phosphoinositide-dependent protein kinase1 (PDK1) that is essential for the growth of human lung carcinoma cells [27]. Maggiora et al. [13] observed clofibrate as a PPAR agonist increases PPARα expression and induces human hepatocarcinoma HepG2 cell apoptosis. Baker et al. [14] found loss of PPARα expression is associated with basal-like or basal phenotype (BP) class of breast cancers. Fenofibrate, an agonist of PPARα, leads to apoptosis of triple-negative breast cancer (TNBC) cells. Positive expression of PPARα was associated ER and PR positive status (p < 0.05) and with the good Nottingham prognostic index group (p < 0.001). Univariate survival analysis showed an association between lack of expression of PPARα and poor outcome in terms of shorter disease-free survival and shorter breast cancer-specific survival. Huang et al. [28] found PPARα agonist fenofibrate can significantly suppressed tumor growth independent of angiogenesis and inflammation. Wu et al. [29] analysis three ccRCC gene expression profiles of GEO database, and they found PPARα is an up-regulated gene in ccRCC tumors compared with paracancerous tissues. All of the researches mentioned above demonstrate that PPARα might play the role of onco-suppressor gene in various cancer types. This is in accordance with the findings from our research, which illustrated a correlation between low PPARα expression levels and unfavorable prognosis in ccRCC patients.
However in some publications, PPARα is observed that it is correlated with progression of tumor. Spaner's research suggested PPARα antagonist MK886 induces chronic lymphocytic leukemia (CLL) cell death and xenografts tumor growth by reducing PPARα mediated interleukin-10 (IL-10) and phospho-STAT3 levels in CD5 (+) Daudicells [30]. Another research reports PPARα was upregulated in CLL, a highly selective, potent small molecule antagonist of PPARα, NXT629 inhibited agonist-induced transcription of PPARα-regulated genes. Furthermore, NXT629 induced apoptosis of CLL cells even in the presence of a protective microenvironment. In addition, in two xenograft mouse models of CLL, NXT629 reduced the number of viable CLL cells in vivo [31]. Overall, these findings suggest that PPARα promotes CLL, inhibiting that PPARα gene regulation could be a new therapeutic approach to treating CLL. Some scholars have found that PPARα mRNA was highly expresses in liver cancer cells compared with noncancerous tissues, PPARα might be associated with its carcinogenesis and characteristic features of energy production [32]. Moreover in PPARα-null mice model, PPARα promotes c-MYC expression and inhibits the expression of let-7C miRNAs, resulting in enhanced hepatocellular proliferation [33]. Omran et al. [34] found that inhibition of PPARα induces cell cycle arrest and apoptosis, and synergizes with Glycolysis inhibition in kidney cancer cells. The role of PPARa in tumorigenesis remains controversial, and may depend on the tumor type and cancer cell type. The discrepancy maybe derived from selectively-activated target gene of PPARα associated biological pathways in specific tissues; the dose of ligands or from these ligands whether is PPARα-dependent or independent.
The innovations of our research rely on the following aspects. First, that is the first research to explore the diagnostic and prognostic value of PPARα gene in ccRCC patients by integrated bioinformatics analysis. Our study has found that PPARα expression status was negatively correlated with tumor dimension (p = 0.034), stage (p < 0.001) and grade (p < 0.001) in ccRCC, which suggested that PPARα might play an antitumor effects in ccRCC. Further, Kaplan-Meier survival analyses and Cox regression analyses demonstrated that decreased PPARα expression is significantly related to shorter OS and poorer DFS in patients with ccRCC. Moreover, ROC curve analysis showed PPARa can be a favorable diagnostic biomarker in ccRCC. Secondly, we constructed a now nomogram by integrating PPARα expression and other clinicopathological prognostic factors. The Harrell's concordance index of now nomogram was approximately 0.78, suggesting a good prognostic ability. Thirdly, we identified significant changes of biological pathways between high expression and low expression groups of PPARa gene in ccRCC. Four pathways associated with tumorigenesis were enriched, including in mTOR pathway, AKT pathway, IGF1-mTOR pathway and Wnt signaling pathways. It suggested that PPARa may pay a tumor promotion and antitumor effects through these four pathways in different tumor types.
In summary, our research reveals that PPARα expression is decreased in ccRCC tumors and lower expression of PPARα is closely correlated with poorer survival. It can be used as a clinically independent prognostic factor in ccRCC. Moreover, according to integrating PPARa and other prognostic factors, we construct a predictive model that can further better stratify and predict clinical outcomes of ccRCC patients. Above all, we have reason to believe that decreased PPARα may promote ccRCC progression; however, further investigation is needed to elucidate the detailed molecular mechanisms underlying the tumor suppressive function of PPARα in ccRCC. A limitation of the present study is its database mining design. A multicenter and prospective study is needed to validate these results.
Abbreviations
PPARα: Peroxisome proliferators-activated receptor alpha; RCC: Renal cell carcinoma; ccRCC: Clear cell renal cell carcinoma; TCGA: The cancer genome atlas; GEO: Gene expression omnibus; KEGG: Kyoto encyclopedia of genes and genomes; GO: Gene ontology; OS: Overall survival; DFS: Disease-free survival; DCA: Decision curve analysis; ROC: Receiver operating characteristic curve; AUC: Area under curve; GSEA: Gene set enrichment analysis.
Supplementary Material
Supplementary figures and tables.
Acknowledgements
The excellent technical assistance of Shanshan Zhang and Danni Shan, Zhongnan Hospital of Wuhan University, is gratefully acknowledged. We would like to acknowledge the BioCarta database. We also would like to acknowledge the UALCAN, GEO and TCGA databases for free use. This study was supported by grant from the Health commission of Hubei Province scientific research project (grant number WJ2019H080). The funder had no role in study design, data collection and analysis, decision to publish, or preparation of the manuscript.
Author contributions
Y.L., L.C. and K.Q. conceived and designed the study, Y.L., L.C., G.W. and K.Q. performed the analysis procedures, Y.L., L.C., G.Q., X.L., and K.Q. analyzed the results, L.C., G.W., G.Q. and X.W. contributed analysis tools, Y.L., L.C. and Y.X. performed biological experiments. Y.L., L.C. and K.Q. contributed to the writing of the manuscript. All authors reviewed the manuscript.
Competing Interests
The authors have declared that no competing interest exists.
References
1. Siegel RL, Miller KD, Jemal A. Cancer statistics, 2018. CA: a cancer journal for clinicians. 2018;68:7-30
2. Rossi SH, Klatte T, Usher-Smith J, Stewart GD. Epidemiology and screening for renal cancer. World journal of urology. 2018;3:1-13
3. Ferlay J, Steliarova-Foucher E, Lortet-Tieulent J, Rosso S, Coebergh JW, Comber H. et al. Cancer incidence and mortality patterns in Europe: estimates for 40 countries in 2012. European journal of cancer (Oxford, England: 1990). 2013;49:1374-403
4. Ljungberg B, Bensalah K, Canfield S, Dabestani S, Hofmann F, Hora M. et al. EAU guidelines on renal cell carcinoma: 2014 update. Eur Urol. 2015;67:913-24
5. Vera-Badillo FE, Templeton AJ, Duran I, Ocana A, de Gouveia P, Aneja P. et al. Systemic therapy for non-clear cell renal cell carcinomas: a systematic review and meta-analysis. European urology. 2015;67:740-9
6. Michalik L, Desvergne B, Wahli W. Peroxisome-proliferator-activated receptors and cancers: complex stories. Nat Rev Cancer. 2004;4:61-70
7. A unified nomenclature system for the nuclear receptor superfamily. Cell. 1999; 97: 161-3.
8. Kliewer SA, Umesono K, Noonan DJ, Heyman RA, Evans RM. Convergence of 9-cis retinoic acid and peroxisome proliferator signalling pathways through heterodimer formation of their receptors. Nature. 1992;358:771-4
9. Holland CM, Saidi SA, Evans AL, Sharkey AM, Latimer JA, Crawford RA. et al. Transcriptome analysis of endometrial cancer identifies peroxisome proliferator-activated receptors as potential therapeutic targets. Molecular cancer therapeutics. 2004;3:993-1001
10. Grabacka M, Plonka PM, Urbanska K, Reiss K. Peroxisome proliferator-activated receptor alpha activation decreases metastatic potential of melanoma cells in vitro via down-regulation of Akt. Clinical cancer research: an official journal of the American Association for Cancer Research. 2006;12:3028-36
11. Yokoyama Y, Xin B, Shigeto T, Umemoto M, Kasai-Sakamoto A, Futagami M. et al. Clofibric acid, a peroxisome proliferator-activated receptor alpha ligand, inhibits growth of human ovarian cancer. Molecular cancer therapeutics. 2007;6:1379-86
12. Panigrahy D, Kaipainen A, Huang S, Butterfield CE, Barnes CM, Fannon M. et al. PPARalpha agonist fenofibrate suppresses tumor growth through direct and indirect angiogenesis inhibition. Proceedings of the National Academy of Sciences of the United States of America. 2008;105:985-90
13. Maggiora M, Oraldi M, Muzio G, Canuto RA. Involvement of PPARalpha and PPARgamma in apoptosis and proliferation of human hepatocarcinoma HepG2 cells. Cell biochemistry and function. 2010;28:571-7
14. Baker BG, Ball GR, Rakha EA, Nolan CC, Caldas C, Ellis IO. et al. Lack of expression of the proteins GMPR2 and PPARalpha are associated with the basal phenotype and patient outcome in breast cancer. Breast cancer research and treatment. 2013;137:127-37
15. von Roemeling CA, Radisky DC, Marlow LA, Cooper SJ, Grebe SK, Anastasiadis PZ. et al. Neuronal pentraxin 2 supports clear cell renal cell carcinoma by activating the AMPA-selective glutamate receptor-4. Cancer research. 2014;74:4796-810
16. Gumz ML, Zou H, Kreinest PA, Childs AC, Belmonte LS, LeGrand SN. et al. Secreted frizzled-related protein 1 loss contributes to tumor phenotype of clear cell renal cell carcinoma. Clinical cancer research: an official journal of the American Association for Cancer Research. 2007;13:4740-9
17. Dennis G Jr, Sherman BT, Hosack DA, Yang J, Gao W, Lane HC. et al. DAVID: Database for Annotation, Visualization, and Integrated Discovery. Genome Biol. 2003;4:P3
18. Iasonos A, Schrag D, Raj GV, Panageas KS. How to build and interpret a nomogram for cancer prognosis. Journal of clinical oncology: official journal of the American Society of Clinical Oncology. 2008;26:1364-70
19. Han DS, Suh YS, Kong SH, Lee HJ, Choi Y, Aikou S. et al. Nomogram predicting long-term survival after d2 gastrectomy for gastric cancer. J Clin Oncol. 2012;30:3834-40
20. Vickers AJ, Elkin EB. Decision curve analysis: a novel method for evaluating prediction models. Med Decis Making. 2006;26:565-74
21. Vickers AJ, Cronin AM, Elkin EB, Gonen M. Extensions to decision curve analysis, a novel method for evaluating diagnostic tests, prediction models and molecular markers. BMC medical informatics and decision making. 2008;8:53
22. Kobayashi H, Komatsu S, Ichikawa D, Kawaguchi T, Hirajima S, Miyamae M. et al. Overexpression of denticleless E3 ubiquitin protein ligase homolog (DTL) is related to poor outcome in gastric carcinoma. Oncotarget. 2015;6:36615-24
23. Fuhrman SA, Lasky LC, Limas C. Prognostic significance of morphologic parameters in renal cell carcinoma. The American journal of surgical pathology. 1982;6:655-63
24. Edge SB, Compton CC. The American Joint Committee on Cancer: the 7th edition of the AJCC cancer staging manual and the future of TNM. Annals of surgical oncology. 2010;17:1471-4
25. Kaipainen A, Kieran MW, Huang S, Butterfield C, Bielenberg D, Mostoslavsky G. et al. PPARalpha deficiency in inflammatory cells suppresses tumor growth. PloS one. 2007;2:e260
26. Skrypnyk N, Chen X, Hu W, Su Y, Mont S, Yang S. et al. PPARalpha activation can help prevent and treat non-small cell lung cancer. Cancer research. 2014;74:621-31
27. Hann SS, Zheng F, Zhao S. Targeting 3-phosphoinositide-dependent protein kinase 1 by N-acetyl-cysteine through activation of peroxisome proliferators activated receptor alpha in human lung cancer cells, the role of p53 and p65. Journal of experimental & clinical cancer research: CR. 2013;32:43
28. Huang J, Das SK, Jha P, Al Zoughbi W, Schauer S, Claudel T. et al. The PPARalpha agonist fenofibrate suppresses B-cell lymphoma in mice by modulating lipid metabolism. Biochimica et biophysica acta. 2013;1831:1555-65
29. Wu F, Wu S, Gou X. Identification of biomarkers and potential molecular mechanisms of clear cell renal cell carcinoma. Neoplasma. 2018;65:242-52
30. Spaner DE, Lee E, Shi Y, Wen F, Li Y, Tung S. et al. PPAR-alpha is a therapeutic target for chronic lymphocytic leukemia. Leukemia. 2013;27:1090-9
31. Messmer D, Lorrain K, Stebbins K, Bravo Y, Stock N, Cabrera G. et al. A Selective Novel Peroxisome Proliferator-Activated Receptor (PPAR)-alpha Antagonist Induces Apoptosis and Inhibits Proliferation of CLL Cells In Vitro and In Vivo. Molecular medicine (Cambridge, Mass). 2015;21:410-9
32. Kurokawa T, Shimomura Y, Bajotto G, Kotake K, Arikawa T, Ito N. et al. Peroxisome proliferator-activated receptor alpha (PPARalpha) mRNA expression in human hepatocellular carcinoma tissue and non-cancerous liver tissue. World journal of surgical oncology. 2011;9:167
33. Gonzalez FJ, Shah YM. PPARalpha: mechanism of species differences and hepatocarcinogenesis of peroxisome proliferators. Toxicology. 2008;246:2-8
34. Abu Aboud O, Wettersten HI, Weiss RH. Inhibition of PPARalpha induces cell cycle arrest and apoptosis, and synergizes with glycolysis inhibition in kidney cancer cells. PloS one. 2013;8:e71115
Author contact
![]() Corresponding author: Dr. Kaiyu Qian, qky1009edu.cn, Tel +86-2767811450.
Corresponding author: Dr. Kaiyu Qian, qky1009edu.cn, Tel +86-2767811450.