3.2
Impact Factor
ISSN: 1837-9664
J Cancer 2019; 10(12):2679-2686. doi:10.7150/jca.32299 This issue Cite
Research Paper
Relationship of prognostic nutritional index with prognosis of gastrointestinal stromal tumors
Department of Gastrointestinal Surgery, the First Affiliated Hospital, Zhejiang University School of Medicine, Hangzhou (310003), China
Received 2018-12-15; Accepted 2019-5-10; Published 2019-6-2
Abstract
Background: The prognostic nutritional index (PNI) is a useful parameter that indicates the immunonutritional status of patients with malignant tumors. In this retrospective study, we aimed to investigate the value of PNI to predict the outcome of gastrointestinal stromal tumors (GISTs).
Material and methods: This study enrolled 431 GIST patients who underwent curative resection from January 2000 to December 2012. A receiver operating characteristic (ROC) curve analysis was used to identify the cutoff value of PNI, neutrophil to lymphocyte ratio (NLR) and platelet to lymphocyte ratio (PLR). Survival curves were produced using the Kaplan-Meier method and were compared using a log-rank test. The Cox proportional hazards model was used to identify independent prognostic factors.
Results: Of the 431 patients, 209 (48.5%) were male and 222 (51.5%) were female. The median age was 56 (range 20-80 years old). The PNI cutoff value was 47.45, with a sensitivity of 61.1 % and a specificity of 69.9 %. Compared to the PNI-low group (PNI < 47.45), the PNI-high group (PNI ≥47.45) had a significantly longer recurrence-free survival (RFS) (5-year RFS rate 89.9% versus 70.8%, p<0.001). Patients with higher PNI (p<0.001), lower NLR (p<0.001) and lower PLR (p=0.002) had significant better prognosis. PNI was found to be an independent prognostic factor of RFS (hazard ratio [HR] =1.967, 95% confidence interval [95% CI]: 1.243-3.114, p=0.004).
Conclusions: PNI is a simple and useful marker that can predict the prognosis of GIST.
Keywords: Gastrointestinal stromal tumor, Prognostic nutritional index, Prognosis
Introduction
Gastrointestinal stromal tumors (GISTs) are the most common mesenchymal neoplasm in the gastrointestinal tract. Surgical resection is the primary treatment for resectable GISTs. However, the prognosis of GISTs is still poor, and more than half of GIST patients suffer from recurrence within 5 years of curative surgery [1, 2].
Some tumor-specific parameters have been used to stratify the recurrence risk for GISTs, including primary tumor site, size, mitotic index, and tumor rupture [3-5]. Other parameters such as age and gender are reported to be associated with prognosis of GISTs and are currently under investigation for inclusion in a classification system to improve predictive accuracy [6]. Recently, the relationship between nutritional status and cancer-related inflammation has been shown to play an important role in long-term outcomes for some malignant tumors, due to the alternation of tumor cell biology in the tumor microenvironment [7-9]. In addition, some cancer-related inflammation blood parameters, including the neutrophil-to-lymphocyte ratio (NLR) and the platelet-to-lymphocyte ratio (PLR), have been shown to be significantly associated with prognosis in GIST patients [10-12]. Malnutrition is highly prevalent in malignant tumor patients. Some nutritional parameters, including albumin, body mass index (BMI), and skeletal muscle volume have been investigated to assess the nutritional risk for gastrointestinal cancer and were found to be significant prognostic factors [13-15].
The prognostic nutritional index (PNI), which was originally proposed to evaluate the perioperative immunonutritional status and surgical risk for gastrointestinal surgery [16], has been reported to be significantly associated with prognosis and postoperative complications for various gastrointestinal malignant tumors [17-21]. However, few studies have investigated the association between immunonutritional status and prognosis in GIST patients. Therefore, we aimed to investigate the value of PNI in predicting outcomes in GIST patients after surgical resection.
Material and Methods
Patients
In total, 431 primary, localized GIST patients were enrolled from January 2000 to December 2012 at the First Affiliated Hospital, Zhejiang University School of Medicine. The pathological diagnosis of GIST was made based on a combination of histopathological evaluation and immunohistochemistry for CD117 or Discovered On GIST 1 (DOG1). The GIST risk classification was performed based on the modified National Institute of Health (NIH) risk classification system [3]. According to the classification system, high risk GISTs were defined as one or more of: (1) tumor rupture; (2) tumor size>10cm; (3) mitotic index (/50 HPFs)>10; (4) tumor size>5.0 and mitotic index (/50 HPFs)>5; (5) tumor size≤5.0cm, mitotic index (/50 HPFs)>5 and non-gastric GISTs; (6) tumor size range 5.1-10cm, mitotic index (/50 HPFs)≤5 and non-gastric GISTs. The inclusion criteria included: (1) age 18-80 years old; (2) Eastern Cooperative Oncology Group (ECOG) performance status score 0-2; (3) surgical resection with negative margins (R0 resection); (4) survival more than 1 month after surgery; and (5) no neoadjuvant or adjuvant tyrosine kinase inhibitor (TKI) therapy. The exclusion criteria included: (1) history of other primary malignancy; (2) incomplete clinical record or data, particularly preoperative hematological tests; and (3) presence of hematological disorders or infection at the time of a blood test; This study was approved by the Institutional Review Board of the First Affiliated Hospital, Zhejiang University School of Medicine.
Data Collection
Clinicopathological characteristics were retrospectively obtained from the medical records and included age, sex, and primary tumor site, size, and mitotic index (number of mitoses/50 high-power fields). Peripheral blood test data within 1 week of surgery were also collected, and included hemoglobin, neutrophil, lymphocyte, monocyte, and platelet counts, as well as serum albumin levels.
PNI was calculated as 10 × serum albumin (g/dl) + 0.005 × total lymphocyte count (per mm3) [16]. NLR was calculated as neutrophil count/lymphocyte count and PLR was calculated as platelet count/lymphocyte count.
Follow-up
The patients had follow-up appointments every 3-6 months for 2 years after surgery, every 6-12 months for 3-5 years, and then annually after 5 years. The last follow-up was performed in December, 2017. The follow-up appointments included routine peripheral blood tests, abdominal ultrasonography, and computed tomography (CT), as well as endoscopy and abdominal magnetic resonance imaging (MRI) when necessary.
Statistical analyses
Categorical data were analyzed using the chi-square test. Continuous variables were expressed as means and standard deviations, and were analyzed using the Mann-Whitney U test. The PNI cutoff value was determined according to the receiver operating characteristic (ROC) curve analysis, which was performed based on the recurrence status at 5-year follow-up. The Youden index, calculated as sensitivity - (1 - specificity), was estimated to determine the optimal cutoff value for PNI [22]. The recurrence-free survival (RFS) was set as the primary end point, which was defined as the time from surgery to the tumor recurrence. Patients who died without tumor recurrence or who were alive without evidence of recurrence on the date of last follow up were censored. Survival curves were calculated using the Kaplan-Meier method and compared using the log-rank test. The Cox proportional hazard model was used for multivariate analysis to determine independent prognosis factors for RFS. A p<0.05 was considered to be statistically significant, and confidence intervals (CI) were calculated at the 95 % level. All statistical analyses were performed with SPSS ver. 19 (SPSS, Chicago, IL, USA).
Results
Patient clinicopathological characteristics
The clinicopathological characteristics of the patients are shown in Table 1. Overall, 209 (48.5%) patients were male and 222 (51.5%) patients were female. The median age of the patients was 56 years (range 20-80). The most common tumor location was the stomach (46.9%), followed by the small intestine (including duodenum, 39.7%), colorectum (10.7%), and extra-gastrointestinal stromal tumors (E-GIST, 2.8%), including one primary tumor located in the liver, one in the seminal vesicle, two in the prostate, four in the omentum, and four in the retroperitoneum. Tumor rupture occurred in three (0.7%) patients. According to the modified NIH GIST risk classification, 60 (14.0%), 176 (41.0%), 52 (12.1%), and 141 (32.9%) patients were categorized into very low, low, intermediate, and high-risk groups, respectively.
Relationship between PNI and clinicopathological characteristics of GISTs patients
| Factor | Total (n = 431) | PNI ≥ 47.45 (n = 279) | PNI < 47.45 (n = 152) | p value |
|---|---|---|---|---|
| Age [n (%)] | ||||
| < 65 | 323 (74.9) | 211 (75.6) | 112 (73.7)) | 0.656 |
| ≥ 65 | 108 (25.1) | 68(24.4) | 40 (26.3) | |
| Sex [n (%)] | ||||
| Male | 209 (48.5) | 123 (44.1) | 86 (56.6) | 0.013 |
| Female | 222 (51.5) | 156 (55.9) | 66 (43.4) | |
| Tumor site [n (%)] | ||||
| Stomach | 202 (46.9) | 153 (54.8) | 49 (32.2) | <0.001 |
| Intestine | 171 (39.7) | 80 (28.7) | 91 (59.9) | |
| Colorectum | 46 (10.7) | 38 (13.6) | 8 (5.3) | |
| E-GIST | 12 (2.8) | 8 (2.9) | 4 (2.6) | |
| Tumor size (cm) [n (%)] | ||||
| 0-2.0 | 67 (15.5) | 56 (20.1) | 11 (7.2) | 0.002 |
| 2.1-5.0 | 212 (49.2) | 134 (48.0) | 78 (51.3) | |
| 5.1-10.0 | 112 (26.0) | 69 (24.7) | 43 (28.3) | |
| >10 | 40(9.3) | 20 (7.2) | 20 (13.2) | |
| Mitotic index (per 50 HPF) [n (%)]* | ||||
| 0-5 | 344 (81.3) | 229 (83.6) | 115 (77.2) | 0.041 |
| 6-10 | 51 (12.1) | 33 (12.0) | 18 (12.1) | |
| >10 | 28 (6.6) | 16 (4.4) | 12 (10.7) | |
| Risk classification [n (%)]** | ||||
| Very low | 60 (14.0) | 49 (17.7) | 11 (7.2) | <0.001 |
| Low | 176 (41.0) | 112 (40.4) | 64 (42.1) | |
| Intermediate | 52 (12.1) | 43 (15.5) | 9 (5.9) | |
| High | 141 (32.9) | 73 (26.4) | 68 (44.7) | |
| Hemoglobin (g/L) | 122.51±26.24 | 98.18±24.72 | <0.001 | |
| Platelet (109/L) | 211.06±76.31 | 215.70±97.35 | 0.929 | |
| Neutrophil (109/L) | 3.43±1.25 | 4.10±2.03 | 0.006 |
HPF: high-power fields; E-GIST: extra-gastrointestinal stromal tumor; *: mitotic index (per 50 HPF) of 8 patients were not clear. **among the 8 patients with unclear mitotic index, 6 patients had clear risk classification based on tumor size, site and rupture status, while 2 patients had unclear risk classification.
ROC Analysis
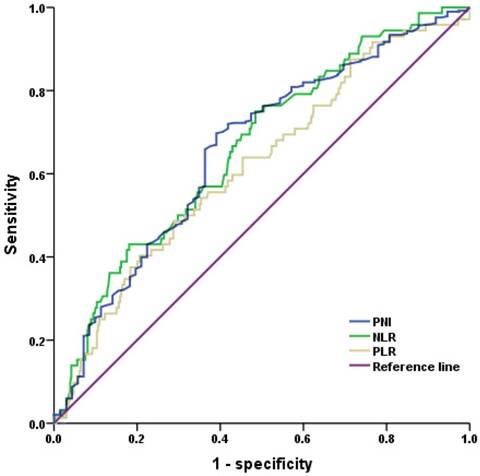
The area under curve (AUC) for PNI was 0.662. The optimal PNI cutoff value was 47.45, corresponding to the maximal Youden index, with a sensitivity of 61.1 % and a specificity of 69.9 % (Figure 1). According to the cutoff value, 279 (64.7%) and 152 (35.3%) patients were categorized into PNI-high (PNI≥47.45) and PNI-low (PNI<47.45) groups. Among the 141 high-risk GIST patients, 73 (51.8%) and 68 (48.2%) patients were categorized into PNI-high and PNI-low groups, respectively. The AUC for NLR was also 0.662 and the optimal cutoff value was 2.18, with a sensitivity of 75.0 % and a specificity of 51.5 %. The AUC for PLR was 0.618 and the optimal cutoff value was 203.21, with a sensitivity of 40.3 % and a specificity of 79.4 % (Figure 1).
Receiver operating characteristic (ROC) analysis of PNI (prognostic nutritional index), NLR (neutrophil-to-lymphocyte ratio) and PLR (platelet-to-lymphocyte ratio). The area under the curve for PNI, NLR and PLR were 0.662, 0.662 and 0.618, respectively.
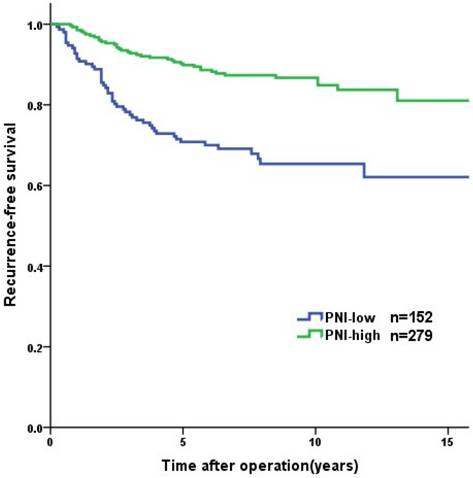
Recurrence-free survival of the GISTs patients (n = 431). The patients in PNI-high group had significant longer RFS than those in PNI-low group (p<0.001).
Correlation between PNI and clinicopathological characteristics
The relationships between PNI and the clinicopathological characteristics are summarized in Table 1. There was no significant difference in age between PNI-high and PNI-low groups (p=0.656). However, more male patients had a lower PNI compared to female patients (p=0.013). Patients with tumors in the small intestine were more likely to have a low PNI than a high PNI (p<0.001). The tumor size was significantly larger and the mitotic index was significantly higher in the PNI-low group compared to the PNI-high group (p=0.004, p=0.041), and the proportion of high-risk patients was significantly greater in PNI-low group (p<0.001). The preoperative hemoglobin in peripheral blood was significantly lower in PNI-low group (p<0.001), while the neutrophil count was significantly higher in PNI-low group (p=0.006). The platelet count in peripheral blood was similar between PNI-high and PNI-low groups (p=0.929).
Survival analysis, univariate and multivariate analysis
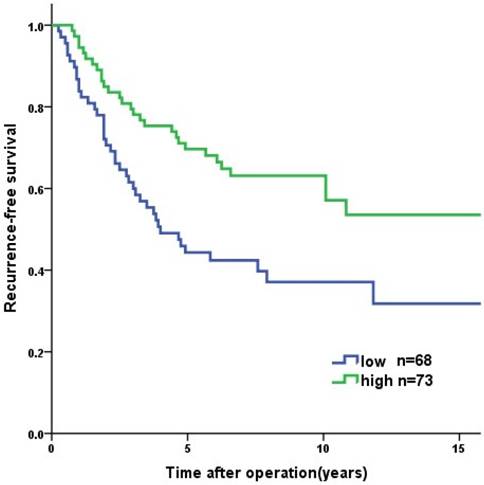
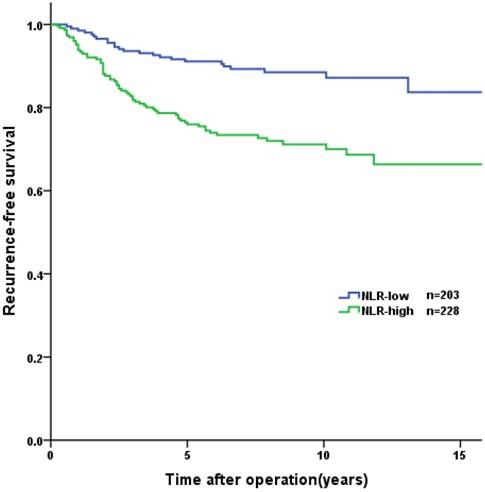
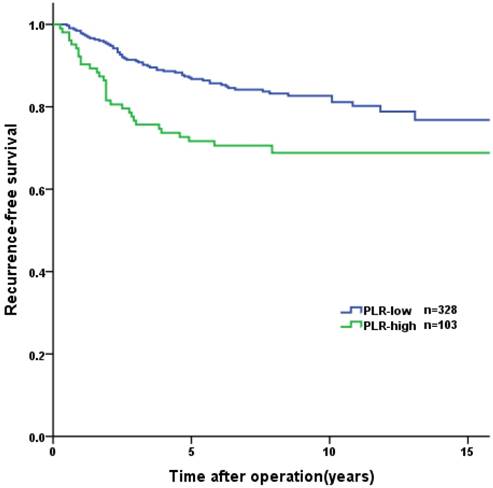
Overall, the 1-year, 3-year, and 5-year RFS rates were 96.0%, 87.4%, and 83.1%, respectively. Tumor recurrence occurred in 89 (20.6%) patients, among whom 70 (78.7%) occurred in high-risk GIST patients. The patients in the PNI-high group had a significantly longer RFS than patients in the PNI-low group (3-year RFS rate of 92.8% versus 77.6%, 5-year RFS rate of 89.9% versus 70.8%, p<0.001, Figure 2). In the survival analysis of high-risk GIST patients, the 1-year, 3-year and 5-year RFS rates were 89.4%, 69.4% and 57.6%, respectively. The high-risk patients in the PNI-high had a significantly longer RFS compared to patients in the PNI-low group (3-year RFS rate 78.1% versus 60.0%, 5-year RFS rate 69.7% versus 44.3%, p=0.004, Figure 3). The patients with lower NLR or PLR had a significantly longer RFS than patients with higher NLR or PLR (p<0.001, p=0.002, Figure 4, 5).
The results of the univariate and multivariate analyses are shown in Table 2. In the univariate analysis, age (hazard ratio [HR] =1.751, 95% confidence interval [95% CI]: 1.132-2.709, p=0.012), sex (HR =1.748, 95% CI: 1.142-2.675, p=0.010), tumor site (p<0.001), size (p<0.001), mitotic index (p<0.001), PNI (HR =2.776, 95% CI: 1.825-4.222, p<0.001), NLR (HR =2.736, 95% CI: 1.712-4.370, p<0.001) and PLR (HR =1.975, 95% CI: 1.276-3.057, p=0.002) were found to be significant predictors for RFS. The multivariate analysis showed that tumor site (p=0.003), tumor size (p<0.001), mitotic index (p<0.001), and PNI (HR =1.967, 95% CI: 1.243-3.114, p=0.004) were independent prognostic factors for RFS.
Discussion
In this study, we found that PNI was an independent predictive factor of RFS in GIST patients receiving R0 resection. To the best of our knowledge, this is the first study to investigate the value of PNI in predicting GIST outcomes. Although NLR and the PLR have been shown to be significantly associated with prognosis in GIST patients [10-12], this study indicated PNI may be superior to NLR and PLR in predicting GIST outcomes.
Recurrence-free survival of the high risk GISTs patients (n = 141). The patients in PNI-high group had significant longer RFS than those in PNI-low group (p=0.004).
Kaplan-Meier curves for recurrence-free survival according to NLR. The patients in NLR-low group had significant longer RFS than those in NLR-low group (p<0.001).
Kaplan-Meier curves for recurrence-free survival according to PLR. The patients in PLR-low group had significant longer RFS than those in PLR-low group (p<0.001).
Univariate and multivariate analysis of the prognostic factors for recurrence-free survival
| Variables | Univariate analysis | Multivariate analysis | |||||
|---|---|---|---|---|---|---|---|
| Hazard ratio | 95 % CI | p value | Hazard ratio | 95 % CI | p value | ||
| Age, years | |||||||
| < 65 | 1 | 0. 012 | 1 | 0.243 | |||
| ≥ 65 | 1.751 | 1.132-2.709 | 1.341 | 0.819-2.196 | |||
| Sex | |||||||
| Female | 1 | 0. 010 | 1 | 0.375 | |||
| Male | 1.748 | 1.142-2.675 | 1.237 | 0.773-1.979 | |||
| Tumor site | |||||||
| Stomach | 1 | <0.001 | 1 | 0.003 | |||
| Intestine | 2.483 | 1.504-4.098 | 1.465 | 0.339-6.322 | |||
| Colorectum | 3.547 | 1.913-6.577 | 2.966 | 0.696-12.646 | |||
| EGIST | 1.345 | 0.316-5.721 | 4.411 | 0.979-19.979 | |||
| Tumor size (cm) | |||||||
| 0-2.0 | 1 | <0.001 | 1 | <0.001 | |||
| 2.1-5.0 | 2.899 | 0.877-9.580 | 2.187 | 0.633-7.560 | |||
| 5.1-10.0 | 7.970 | 2.451-25.921 | 4.280 | 1.251-14.650 | |||
| ≥ 10 | 23.022 | 6.942-76.353 | 18.755 | 5.468-64.324 | |||
| Mitotic index (per 50 HPF) | |||||||
| 0-5 | 1 | <0.001 | 1 | <0.001 | |||
| 6-10 | 2.921 | 1.649-5.171 | 3.271 | 1.084-5.930 | |||
| > 10 | 13.957 | 8.391-23.215 | 8.951 | 5.135-15.601 | |||
| PNI | |||||||
| ≥ 47.45 | 1 | <0.001 | 1 | 0.004 | |||
| < 47.45 | 2.776 | 1.825-4.222 | 1.967 | 1.243-3.114 | |||
| NLR | |||||||
| < 2.18 | 1 | 1 | 0.642 | ||||
| ≥ 2.18 | 2.736 | 1.712-4.370 | <0.001 | 1.146 | 0.645-2.138 | ||
| PLR | |||||||
| < 203.21 | 1 | 1 | 0.181 | ||||
| ≥ 203.21 | 1.975 | 1.276-3.057 | 0.002 | 1.411 | 0.852-2.338 | ||
The 5-year RFS rate in GIST patients after R0 resection without adjuvant imatinib therapy was reported to be 70.5%-79% [2, 11, 12, 23]. Based on the modified NIH GIST risk classification, nearly 40% of GISTs are categorized as high-risk, which has a significantly worse prognosis that very low-, low-, and intermediate-risk GISTs [23]. Therefore, the malignancy potential of GISTs varies greatly and the prognostic outcome of patients may differ significantly, especially in high-risk GIST patients. Thus, identifying more potential prognostic factors in predicting GIST recurrence is crucial, especially for high-risk GIST patients. Recently, a number of studies have attempted to identify factors that could effectively sub-divide high-risk GIST patients, for a more precise prediction of outcomes. In these studies, tumor necrosis and tumor serosal invasion were reported to be significantly associated with worse prognosis in high-risk GIST patients [24, 25]. In this study, we found that lower PNI predicted shorter RFS in high-risk GIST patients, which indicated that high-risk GIST patients with a low PNI may have impaired immunonutritional status.
PNI is calculated from albumin levels and lymphocyte counts in the peripheral blood and is a parameter of immunonutritional status. PNI can be easily determined from routine blood tests, and was reported to be associated with the prognosis of various cancers, especially digestive tract cancers [17-19]. Therefore, PNI could be considered a useful and convenient biomarker to assess the prognostic outcomes of GIST patients before surgery. In previous studies for gastric cancer, the ROC analysis was performed to identify the cutoff value of PNI [18, 26]. The AUCs ranged from 0.648 to 0.732, the sensitivity ranged from 59.6% to 82.3% and the specificity ranged from 57.9% to 65.3% [18, 26]. In our study, the AUC for PNI was 0.662, with a sensitivity of 61.1 % and a specificity of 69.9 %. The sensitivity and specificity, in accord with data of previous studies, however, were not relatively high. Given the convenience to access, PNI may still have clinical meaning.
Malnutrition is highly prevalent among malignant tumor patients. Nutritional risk is a predictor of postoperative mortality and complications for gastrointestinal cancer patients [9, 27]. Albumin is widely applied to assess nutritional status. Hypoalbuminemia was demonstrated to be a prognostic factor for various digestive cancers [15]. For unresectable or metastatic GISTs, patients treated with imatinib therapy, and normal albumin levels and neutrophil counts in the peripheral blood, were independently associated with better survival [28]. The preoperative neutrophil count in the peripheral blood was also shown to be significantly associated with prognosis of localized GISTs without adjuvant imatinib therapy [10-12]. Although there is no association between the lymphocyte count and prognosis of GISTs, intratumoral CD3+ tumor-infiltrating lymphocytes and natural killer cells were highly enriched in GIST patients, and were shown to predict prognosis [29]. In addition, imatinib was indicated to activate CD8+ T cells and induce regulatory T cells apoptosis within the tumor by reducing tumor-cell expression of the immunosuppressive enzyme indoleamine 2,3-dioxygenase (Ido) [30]. PNI involves a combination of albumin levels with lymphocyte counts in the peripheral blood. In this study, we found that GIST patients in the PNI-high group had a significantly better RFS than those in the PNI-low group.
PNI can be decreased by several mechanisms. In gastric cancer, decline of PNI can be explained by gastric outlet obstruction, dietary restriction, malabsorption, chronic blood loss, and tumor consumption due to progression [18, 31]. GISTs can result in various digestive symptoms, and 25% of GIST patients have gastrointestinal bleeding, 16% have dyspepsia, 12.1% have nausea or vomiting, and 8.9% have constipation or diarrhea [32]. These factors may result in nutritional status impairment. The preoperative hemoglobin in peripheral blood was significantly lower in PNI-low group, the gastrointestinal bleeding maybe more common in PNI-low group. In this study, tumor size was significantly larger and the mitotic index was significantly higher in the PNI-low group than in the PNI-high group, which implies that the burden of advanced GISTs may also lead to a decline in PNI.
There are several limitations to this study. First, it is a single-institution retrospective study. In addition, GIST patients treated with adjuvant TKI therapy were excluded. Therefore, some patients with intermediate or high-risk tumors were excluded, which may be a selection bias.
In conclusion, PNI is a simple and useful marker for predicting the long-term outcomes of GIST patients.
Acknowledgements
Ying Mei, Welda E.H. Tjhoi, Chunhui Shou, Qiutao Zhu, Weili Yang, Hang Yu contributed to this manuscript by collecting data and Qing Zhang, Xiaosun Liu contributed to this manuscript by writing assistance.
Funding
This study was supported by the grant of The Major Science and Technology Project of Zhejiang Province (2014C03040-1) and Research Fund for Zhejiang Province Public Welfare Technology Application Research Project (2015C33174).
Competing Interests
The authors have declared that no competing interest exists.
References
1. DeMatteo RP, Lewis JJ, Leung D, Mudan SS, Woodruff JM, Brennan MF. Two hundred gastrointestinal stromal tumors: recurrence patterns and prognostic factors for survival. Annals of surgery. 2000;231:51-8
2. Joensuu H, Vehtari A, Riihimaki J, Nishida T, Steigen SE, Brabec P. et al. Risk of recurrence of gastrointestinal stromal tumour after surgery: an analysis of pooled population-based cohorts. The Lancet Oncology. 2012;13:265-74
3. Fletcher CDM, Berman JJ, Corless C, Gorstein F, Lasota J, Longley BJ. et al. Diagnosis of gastrointestinal stromal tumors: A consensus approach. Human pathology. 2002;33:459-65
4. Joensuu H. Risk stratification of patients diagnosed with gastrointestinal stromal tumor. Human pathology. 2008;39:1411-9
5. Miettinen M, Lasota J. Gastrointestinal stromal tumors: pathology and prognosis at different sites. Seminars in diagnostic pathology. 2006;23:70-83
6. Kramer K, Knippschild U, Mayer B, Bogelspacher K, Spatz H, Henne-Bruns D. et al. Impact of age and gender on tumor related prognosis in gastrointestinal stromal tumors (GIST). BMC cancer. 2015;15:57-57
7. Asher V, Lee J, Bali A. Preoperative serum albumin is an independent prognostic predictor of survival in ovarian cancer. Medical oncology (Northwood, London, England). 2012;29:2005-9
8. McMillan DC. Systemic inflammation, nutritional status and survival in patients with cancer. Current opinion in clinical nutrition and metabolic care. 2009;12:223-6
9. Schwegler I, von Holzen A, Gutzwiller JP, Schlumpf R, Muhlebach S, Stanga Z. Nutritional risk is a clinical predictor of postoperative mortality and morbidity in surgery for colorectal cancer. The British journal of surgery. 2010;97:92-7
10. Goh BKP, Chok AY, Allen JC, Quek R, Teo MCC, Chow PKH. et al. Blood neutrophil-to-lymphocyte and platelet-to-lymphocyte ratios are independent prognostic factors for surgically resected gastrointestinal stromal tumors. Surgery (United States). 2016;159:1146-56
11. Perez DR, Baser RE, Cavnar MJ, Balachandran VP, Antonescu CR, Tap WD. et al. Blood Neutrophil-to-Lymphocyte Ratio is Prognostic in Gastrointestinal Stromal Tumor. Ann Surg Oncol. 2013:593-9
12. Racz JM, Cleghorn MC, Jimenez MC, Atenafu EG, Jackson TD, Okrainec A. et al. Predictive Ability of Blood Neutrophil-to-Lymphocyte and Platelet-to-Lymphocyte Ratios in Gastrointestinal Stromal Tumors. Ann Surg Oncol. 2015:2343-50
13. Endo T, Momoki C, Yamaoka M, Hachino S, Iwatani S, Kiyota S. et al. Validation of Skeletal Muscle Volume as a Nutritional Assessment in Patients With Gastric or Colorectal Cancer Before Radical Surgery. Journal of clinical medicine research. 2017;9:844-59
14. Guner A, Kim SY, Yu JE, Min IK, Roh YH, Roh C. et al. Parameters for Predicting Surgical Outcomes for Gastric Cancer Patients: Simple Is Better Than Complex. Annals of surgical oncology. 2018;25(11):3239-3247
15. Gupta D, Lis CG. Pretreatment serum albumin as a predictor of cancer survival: a systematic review of the epidemiological literature. Nutrition journal. 2010;9:69-69
16. Onodera T, Goseki N, Kosaki G. [Prognostic nutritional index in gastrointestinal surgery of malnourished cancer patients]. Nihon Geka Gakkai zasshi. 1984;85:1001-5
17. Kanda M, Fujii T, Kodera Y, Nagai S, Takeda S, Nakao A. Nutritional predictors of postoperative outcome in pancreatic cancer. The British journal of surgery. 2011;98:268-74
18. Migita K, Takayama T, Saeki K, Matsumoto S, Wakatsuki K, Enomoto K. et al. The prognostic nutritional index predicts long-term outcomes of gastric cancer patients independent of tumor stage. Annals of Surgical Oncology. 2013;20:2647-54
19. Tokunaga R, Sakamoto Y, Nakagawa S, Miyamoto Y, Yoshida N, Oki E. et al. Prognostic Nutritional Index Predicts Severe Complications, Recurrence, and Poor Prognosis in Patients With Colorectal Cancer Undergoing Primary Tumor Resection. Diseases of the colon and rectum. 2015;58:1048-57
20. Liu X, Qiu H, Liu J, Chen S, Xu D, Li W. et al. A Novel Prognostic Score, Based on Preoperative Nutritional Status, Predicts Outcomes of Patients after Curative Resection for Gastric Cancer. J Cancer. 2016;7:2148-56
21. Zhao Y, Deng Y, Peng J, Sui Q, Lin J, Qiu M. et al. Does the Preoperative Prognostic Nutritional Index Predict Survival in Patients with Liver Metastases from Colorectal Cancer Who Underwent Curative Resection? J Cancer. 2018;9:2167-74
22. Perkins NJ, Schisterman EF. The inconsistency of "optimal" cutpoints obtained using two criteria based on the receiver operating characteristic curve. Am J Epidemiol. 2006;163:670-5
23. Wang M, Xu J, Zhang Y, Tu L, Qiu WQ, Wang CJ. et al. Gastrointestinal stromal tumor: 15-years' experience in a single center. BMC Surg. 2014;14:93-93
24. Liu X, Qiu H, Zhang P, Feng X, Chen T, Li Y. et al. Prognostic role of tumor necrosis in patients undergoing curative resection for gastric gastrointestinal stromal tumor: a multicenter analysis of 740 cases in China. Cancer Medicine. 2017;6:2796-803
25. Zhao WY, Xu J, Wang M, Zhang ZZ, Tu L, Wang CJ. et al. Evaluation of high-risk clinicopathological indicators in gastrointestinal stromal tumors for prognosis and imatinib treatment outcome. BMC Gastroenterology. 2014;14:1-8
26. Sakurai K, Tamura T, Toyokawa T, Amano R, Kubo N, Tanaka H. et al. Low Preoperative Prognostic Nutritional Index Predicts Poor Survival Post-gastrectomy in Elderly Patients with Gastric Cancer. Ann Surg Oncol. 2016;23:3669-76
27. Fukuda Y, Yamamoto K, Hirao M, Nishikawa K, Maeda S, Haraguchi N. et al. Prevalence of Malnutrition Among Gastric Cancer Patients Undergoing Gastrectomy and Optimal Preoperative Nutritional Support for Preventing Surgical Site Infections. Annals of surgical oncology. 2015;22(Suppl 3):S778-85
28. Blanke CD, Demetri GD, Von Mehren M, Heinrich MC, Eisenberg B, Fletcher JA. et al. Long-term results from a randomized phase II trial of standard- versus higher-dose imatinib mesylate for patients with unresectable or metastatic gastrointestinal stromal tumors expressing KIT. Journal of Clinical Oncology. 2008;26:620-5
29. Rusakiewicz S, Semeraro M, Sarabi M, Desbois M, Locher C, Mendez R. et al. Immune in filtrates are prognostic factors in localized gastrointestinal stromal tumors. Cancer Research. 2013;73:3499-510
30. Balachandran VP, Cavnar MJ, Zeng S, Bamboat ZM, Ocuin LM, Obaid H. et al. Imatinib potentiates antitumor T cell responses in gastrointestinal stromal tumor through the inhibition of Ido. Nature medicine. 2011;17:1094-100
31. Zheng H-L, Lu J, Li P, Xie J-W, Wang J-b, Lin J-X. et al. Effects of Preoperative Malnutrition on Short- and Long-Term Outcomes of Patients with Gastric Cancer: Can We Do Better? Annals of Surgical Oncology. 2017;24:3376-85
32. Mucciarini C, Rossi G, Bertolini F, Valli R, Cirilli C, Rashid I. et al. Incidence and clinicopathologic features of gastrointestinal stromal tumors. A population-based study. BMC Cancer. 2007;7:1-7
Author contact
![]() Corresponding author: Jiren Yu, M.D., Department of Gastrointestinal Surgery, the First Affiliated Hospital, Zhejiang University School of Medicine, No. 79, Qingchun Road, 310003 Hangzhou, Zhejiang Province, China. E-mail:yujr0909edu.cn. Tel: 0086-0571-87236147. Fax: 0086-0571-87072577.
Corresponding author: Jiren Yu, M.D., Department of Gastrointestinal Surgery, the First Affiliated Hospital, Zhejiang University School of Medicine, No. 79, Qingchun Road, 310003 Hangzhou, Zhejiang Province, China. E-mail:yujr0909edu.cn. Tel: 0086-0571-87236147. Fax: 0086-0571-87072577.

 Global reach, higher impact