Impact Factor ISSN: 1837-9664

 Global reach, higher impact
J Cancer 2019; 10(12):2754-2763. doi:10.7150/jca.31755 This issue Cite
Research Paper
Changes in Expression of Multiple Checkpoint Molecules and Infiltration of Tumor Immune Cells after Neoadjuvant Chemotherapy in Gastric Cancer
Yue Yu1, Xiaopeng Ma2, Yanjuan Zhang2, Yun Zhang2, Jianming Ying3, Wen Zhang1, Qiaofeng Zhong1, Aiping Zhou1, ![]() , Yixin Zeng4,5,
, Yixin Zeng4,5, ![]()
1. Department of Medical Oncology, National Cancer Center/National Clinical Research Center for Cancer/Cancer Hospital, Chinese Academy of Medical Sciences and Peking Union Medical College, Beijing, China.
2. BeiGene (Beijing) Co., Ltd, Beijing, China
3. Department of Pathology, National Cancer Center/National Clinical Research Center for Cancer/Cancer Hospital, Chinese Academy of Medical Sciences and Peking Union Medical College, Beijing, China.
4. State Key Laboratory of Molecular Oncology, National Cancer Center /National Clinical Research Center for Cancer/Cancer Hospital, Chinese Academy of Medical Sciences and Peking Union Medical College, Beijing, China.
5. Department of Experimental Research, State Key Laboratory of Oncology in Southern China, Collaborative Innovation Center for Cancer Medicine, Sun Yat-sen University Cancer Center, Guangzhou, Guangdong Province, China.
Received 2018-11-24; Accepted 2019-4-28; Published 2019-6-2
Abstract
It remains unclear that how tumor immune micro-environment will change following neoadjuvant chemotherapy (NACT) in locally advanced gastric cancer (LAGC). In this study, we aimed to characterize the changes in tumor-infiltrating immune cells and checkpoint molecules following NACT and investigate the prognostic value of these changes in LAGC. Paired tumor samples (pre-NACT and post-NACT) of 60 patients were retrospectively identified and analyzed by multiplex immunohistochemistry with a panel including CD4, CD8, FOXP3, PD-1, PD-L1, and TIM3. Following NACT, the overall median expression levels of CD4, CD8, PD1, PD-L1 and TIM3 were significantly increased (P = 0.008 for PD-L1 and P < 0.001 for all the other markers), while the median FOXP3 expression level remained stable (P = 0.120). Individually, the majority of patients presented increased expression of the markers, while 8.5%, 11.9%, 16.9%, 25.4%, 22.0% and 42.2% of patients had decreased expression of CD4, CD8, PD-1, PD-L1, TIM3 and FOXP3, respectively. Changes in expression between baseline and post-NACT of TIM3, PD-1, and PD-L1 showed strongly positive pairwise correlations with each other (P < 0.001). Multivariate analysis demonstrated that high upregulation levels of CD8 (HR = 0.73, P = 0.028), PD-1 (HR = 0.76, P = 0.027), and PD-L1 (HR = 0.67, P = 0.038) following NACT were beneficial prognostic factors of OS. NACT increase the expression of multiple checkpoint molecules and infiltration of CD4+, CD8+ immune cells in LAGC with the levels of changes in checkpoint molecules positively related with each other. This may raise the possibility of applying immunotherapy with chemotherapy or even dual checkpoint inhibitors in LAGC.
Keywords: tumor-infiltrating immune cells, checkpoint molecules, neoadjuvant chemotherapy, locally advanced gastric cancer, prognosis
Introduction
Gastric cancer is the fifth most common cancer and the third leading cause of cancer deaths worldwide [1]. The median overall survival (OS) time of patients with metastatic disease is only slightly more than one year, even with the application of targeted therapy [2]. Patients with locally advanced disease are also associated with poor prognosis, as the 5-year OS rate is less than 40% following radical surgery [3]. Therefore, there is a pressing need for the development of new treatment modalities for gastric cancer.
Cancer immunotherapy, which has provided long-term clinical benefits for metastatic disease in different types of tumors, is the new frontier in oncology [4-7]. In gastric cancer, pembrolizumab, a programmed cell death 1 (PD-1) checkpoint inhibitor, has been approved to treat programmed cell death-ligand 1 (PD-L1) positive tumor after failure of at least two lines of treatment. Nevertheless, the majority of cases fail to respond to immune checkpoint inhibitors [8]. Immune factors, such as PD-L1 expression and tumor-infiltrating lymphocytes, have been demonstrated to be associated with the efficacy of immunotherapy [9-11]. Patients prepared for immunotherapy usually received at least one line of chemotherapy as front-line treatment; however, in the real world, a second biopsy is not always feasible before immunotherapy. Since many chemotherapeutic agents can influence PD-L1 expression and tumor immune cells infiltration [12-14], the tissue acquired at the initial diagnosis may not accurately reflect the immune status after chemotherapy, thus providing inaccurate information on the prediction of the efficacy of immunotherapy.
Tumor immune cell infiltration and PD-1/PD-L1 expression can evolve with different chemotherapy regimens in multiple types of cancer [15-17]. In a post hoc study of a phase II neoadjuvant chemotherapy trial, the authors discovered that in breast cancer, tumor-infiltrating lymphocyte count and PD-L1 expression were decreased following neoadjuvant chemotherapy, although the decrease of PD-L1 expression was not significantly different [15]. Another study on head and neck squamous cell carcinoma revealed that PD-L1 expression and tumor-infiltrating cluster of differentiation 8 (CD8) positive mean densities were significantly increased after docetaxel, platinum and fluorouracil combined induction therapy (P = 0.003 and 0.01, respectively) [16]. It remains largely unknown how conventional chemotherapeutic agents may affect tumor immune microenvironment in gastric cancer. Current study aims to investigate tumor immune cells and checkpoint molecules with paired pre- and post-NACT samples in patients with locally advanced gastric cancer to characterize the effect of chemotherapy on tumor immune microenvironment and the association between immune compartments and clinical outcome.
Patients and Methods
Patients selection
Patients who were pathologically diagnosed with gastric cancer and received NACT prior to surgical resection at National Cancer Center (NCC)/National Clinical Research Center for Cancer/Cancer Hospital, Chinese Academy of Medical Sciences and Peking Union Medical College (CAMS & PUMC) between January 2013 and March 2017 were screened for eligibility. Cases that met all of the following criteria were included: 1). diagnosed as stage cII-III disease by endoscopic ultrasonography and image examination; 2). received platinum and fluoropyrimidine with or without taxane as NACT; 3) HER2 negative tumor; 4). with enough paired pre- and post- NACT tumor tissue samples for multiplex immunohistochemistry staining. Cases with conditions below were excluded: 1). squamous cell carcinoma 2). HER2 positive tumor; 3).received prior radiotherapy or other concurrent therapies. This retrospective study was approved by the Ethics Committee of NCC/CAMS & PUMC and is in accordance with the Helsinki Declaration.
Medical records were reviewed for all patients identified. Data for demographic characteristics, tumor characteristics, treatment regimens, treatment responses, and survival were collected. Evaluations of clinical responses were made by Response Evaluation Criteria in Solid Tumors (RECIST) version 1.1. The image examinations commonly used were computed tomography (CT) and magnetic resonance imaging (MRI). Radiological images were collected every 2 to 3 cycles, according to the specific treatment regimen and the patient's clinical condition.
Multispectral fluorescent immunohistochemistry for immune markers
Paired tumor samples were retrospectively identified and analysed by multiplex immunohistochemistry with a panel including cluster of differentiation 4 (CD4), CD8, PD-1, PD-L1, T-cell immunoglobulin and mucin domain 3 (TIM3) and transcription factor forkhead box P3 (FOXP3).
Formalin-fixed, paraffin-embedded (FFPE) tissue blocks were cut into 4-μm sections, deparaffinized in xylene, and rehydrated in a graded series of ethanol. Antigen retrieval was performed using Citric or Tris-EDTA buffer and microwave treatment. Blocking was performed with 3% H2O2 blocking solution at room temperature for 10 minutes, followed by the addition of goat serum. The first primary antibody, CD4 (Zsbio, ZA-0519), was then added, followed by the addition of SignalStain® Boost HC Detection Reagent (HRP, rabbit or mouse, Cell Signaling, cat 8125s and 8114s) as the secondary antibody. The slides were washed, and the designated tyramide signal amplification (TSA)-dye (Opal 7 color kit, Perkin Elmer, Hopkington, MA, USA) was applied. Slides were then microwaved to strip the primary and secondary antibodies, washed, and blocked again using goat serum solution. The second primary antibody, PD-1 (Cell Signaling, 86163s) was applied, and the process was repeated from the third to the sixth primary antibody, as CD8 (Zsbio, ZA-0508), TIM3 (Cell Signaling, 45208s), PD-L1 (Cell Signaling, 13684s) and FOXP3 (eBioscience, 14-7979-82), respectively (Detailed information of the primary antibody is presented in Table 1). In the final cycle, 4',6-diamidino-2-phenylindole, dihydrochloride (DAPI) was applied for counterstaining, rather than another primary antibody. After DAPI was washed off, slides were mounted using glycerine.
Detailed information of primary antibody
| Position | Antibody (Dilution) | Company | Clone number | Catalog number |
|---|---|---|---|---|
| 1 | CD4 (1:100) | Zsbio | UMAB64 | ZA-0519 |
| 2 | PD-1 (1:100) | Cell Signaling | D4W2J | 86163s |
| 3 | CD8 (1:200) | Zsbio | EP334 | ZA-0508 |
| 4 | TIM3 (1:500) | Cell Signaling | D5D5R | 45208s |
| 5 | PD-L1 (1:200) | Cell Signaling | E1L3N | 13684s |
| 6 | FOXP3 (1:100) | eBioscience | eBio7979 | 14-7979-82 |
| 7 | Opal™ Multicolor IHC Kits | Perkin Elmer |
CD4, cluster of differentiation 4; CD8, cluster of differentiation 8; PD-1, programmed cell death 1; PD-L1, programmed cell death-ligand 1; Tim-3, T cell immunoglobulin and mucin domain 3; FOXP3, transcription factor forkhead box P3.
In addition, a single-colour slide was generated for each antibody. Multiplexed and single-colour control slides were loaded onto the PerkinElmer Vectra automated multispectral microscope. Representative fields from the single-colour slides were imaged, and InForm Image Analysis software (Ver 2.2) was used to generate a spectral library for unmixing. Tumor areas on each slide were then selected and imaged. Channels were unmixed using the spectral library, tissues were segmented and scored, and cells of interest were counted. DAPI-stained cells were counted in each selected area, and the total number of cells on each slide was calculated as the sum of DAPI-stained cells in all selected areas. Marker-stained cells were then counted. The percentage of positivity, which was calculated by the total number of marker-stained cells divided by the total number of cells, was used for the evaluation of pre- and post-NACT marker expression levels.
Statistical analysis
All statistical analyses were performed by R software and its packages (Open Access, Version 3.4.2). Univariate and multivariate survival analyses were carried out using the Cox proportional-hazard model. The significance of differences in survival was evaluated by log-rank test, and differences of protein expression between different groups were evaluated by Wilcoxon rank-sum tests. The association between the chemotherapy group and response following NACT was analysed by Fisher's exact test. The correlations of protein expression were evaluated using Spearman's correlation coefficient and Spearman's correlation test. All P values were two-sided, and values of less than 0.05 were considered statistically different.
Results
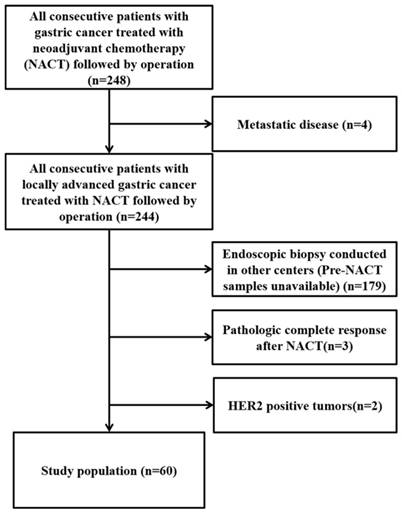
From January 2013 to March 2017, all consecutive gastric cancer patients treated with NACT followed by surgery (n=248) were assessed for eligibility. Finally, 60 who met the inclusion criteria and were enrolled in this study (Figure 1).
Consort flow diagram of the study population.
Patients' characteristics
Patients' characteristics are shown in Table 2. By the final follow-up date, as of April 20th, 2018, a total of 32 deaths (53.3%) had occurred at the time of analysis, with a median follow-up time of 22.9 months (ranged from 5.1 to 59.0 months). The median age of the entire cohort was 58 years (ranged from 27 to 84 years). 75.0% patients were male, and 71.7% patients had poorly differentiated carcinomas. Patients received a median of 4 cycles (ranged from 2 to 6 cycles) of NACT, among which 56.7% (n = 34) were treated with platinum and fluorouracil combined therapy (Group 1), and the others (n = 26, 43.3%) were treated with platinum, fluorouracil and taxane (Group 2). Tumor regression grading (TRG) was evaluated according to the Mandard TRG system, with grades 2, 3 and 4 representing rare residual cancer cells, fibrosis outgrowing residual cancer and residual cancer outgrowing fibrosis, respectively[18, 19].
Patient characteristics
| Characteristics | Number of patients | Percent (%) |
|---|---|---|
| 60 | 100 | |
| Gender | ||
| Male | 45 | 75.0 |
| Female | 15 | 25.0 |
| Age (years) | ||
| ≤55 | 25 | 41.7 |
| >55 | 35 | 58.3 |
| Tumor differentiation | ||
| Poorly differentiated | 43 | 71.7 |
| Well or moderately differentiated | 12 | 20.0 |
| Unknown | 5 | 8.3 |
| Clinical tumor (cT) stage | ||
| cT1-3 | 5 | 8.3 |
| cT4 | 55 | 91.7 |
| Clinical lymph node (cN) stage | ||
| cN0-2 | 40 | 66.7 |
| cN3 | 20 | 33.3 |
| Clinical TNM stage | ||
| Stage Ⅱ | 6 | 10.0 |
| Stage Ⅲ | 54 | 90.0 |
| Chemotherapy regimen | ||
| Platinum and fluorouracil (Group 1) | 34 | 56.7 |
| Platinum, fluorouracil and taxane (Group 2) | 26 | 44.3 |
| Clinical response to NACT | ||
| PR | 27 | 45.0 |
| SD | 32 | 53.3 |
| ND | 1 | 1.7 |
| Tumor regression grading (Mandard system) | ||
| Grade 2 or 3 | 23 | 38.3 |
| Grade 4 | 37 | 61.7 |
| Downstaging | ||
| Yes | 29 | 48.3 |
| No | 31 | 51.7 |
Changes in immune marker expression following NACT
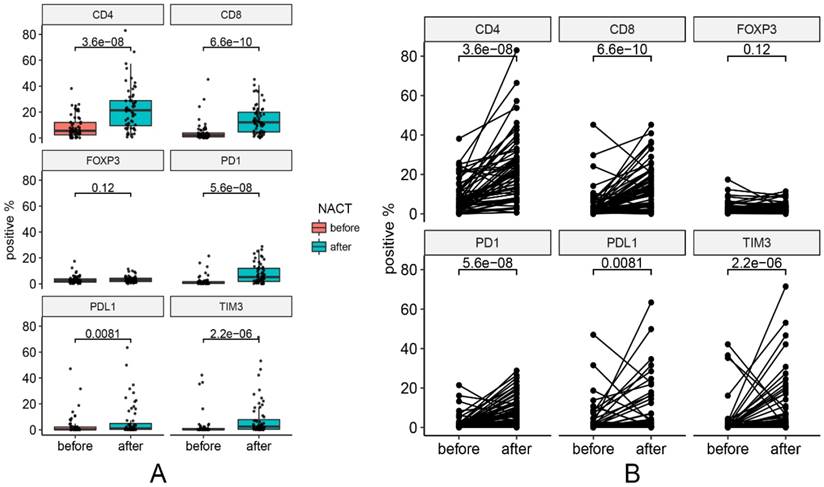
One pre-NACT sample that was not qualified for analysis was excluded from the analysis. Changes in marker expression are presented in Figure 2. Figure 3 contains representative images of pre-NACT and post-NACT marker expression. Of the entire cohort, the median expression levels of PD-1 (0.68% vs. 5.19%, P < 0.001), PD-L1 (0.26% vs. 1.06%, P = 0.008), CD4 (5.50% vs. 21.38%, P < 0.001), CD8 (2.20% vs. 12.09%, P < 0.001) and TIM3 (0.24% vs. 2.47%, P < 0.001) significantly increased, while the median expression level of FOXP3 remained stable after NACT (2.31% vs. 3.09%, P = 0.120) (Figure 2). The majority of patients presented increased expression of immune markers, while approximately 8.5% (5/59), 11.9% (7/59), 16.9% (10/59), 25.4% (15/59), 22.0% (13/59) and 42.2% (25/59) of patients had decreased expression of CD4, CD8, PD-1, PD-L1, TIM3 and FOXP3, respectively. In subgroup analysis, the trends of changes in the immune markers in each chemotherapy group were in accordance with the entire cohort except that the upregulation of PD-L1 in Group 2 showed no statistical difference (P = 0.13) (Figure S1). According to the correlations between levels of the changes in marker expression, there was a strongly positive correlation between the change in PD-1 and the change in PD-L1 (Spearman correlation coefficient r=0.73, P < 0.001). In addition, the changes in PD-1 and TIM3 (r=0.65, P < 0.001) and the changes in PD-L1 and TIM3 (r=0.73, P < 0.001) were also positively correlated.
Changes in marker expression pre- and post-NACT. (A) Median levels of marker expression pre- and post-NACT. (B) Changes of each pair in marker expression pre- and post-NACT.
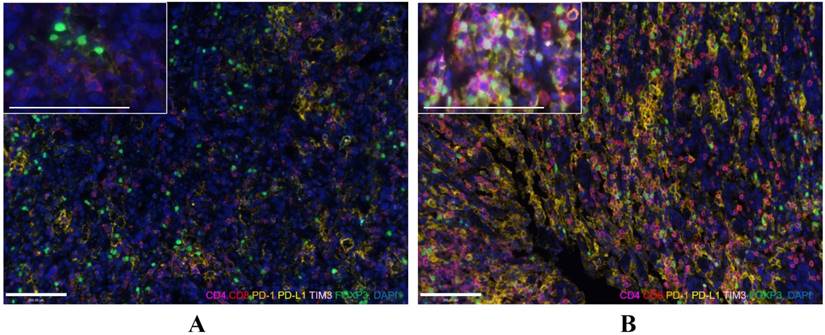
Representative images of pre-NACT (A) and post-NACT (B) marker expression (200×, and 400× for enlarged view). Immunofluorescence staining of CD4 (magenta), CD8 (red), PD-1 (orange), PD-L1 (yellow), TIM3 (pink), and FOXP3 (green) and DAPI staining of nuclear DNA (blue). Bar represents 100µm.
Relationship between the expression of immune markers and the response to NACT
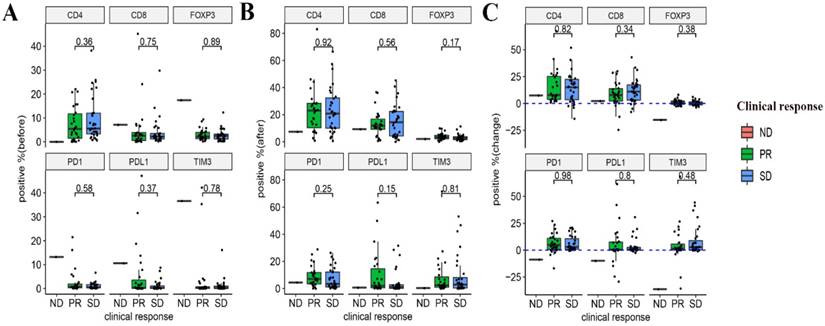
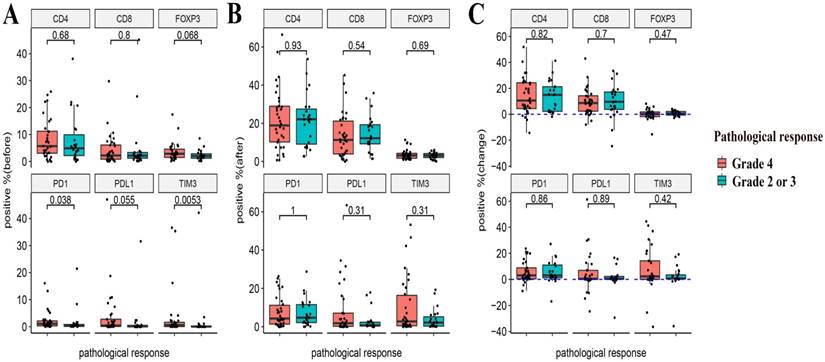
The relationship between the pre- and post-NACT expression of the markers, as well as their levels of changes following NACT and the efficacy of NACT were evaluated. Neither the expression of the six markers at baseline and post-NACT nor levels of changes in their expression correlated with the clinical response (Figure 4). In terms of pathological response, grade 2 or 3 tumor regression seemed to be associated with lower baseline expression of PD-1 and TIM3 (P = 0.038 and P = 0.0053, respectively). Neither post-NACT expression of these six markers nor changes of their levels correlated with the pathological response (Figure 5).
Relationships between the expression of immune markers and the clinical response to NACT. (A) Pre-NACT marker expression and clinical response. (B) Post-NACT marker expression and clinical response. (C) Changes in marker expression levels and clinical response.
Relationships between the expression of immune markers and the pathological response to NACT. (A) Pre-NACT marker expression and pathological response. (B) Post-NACT marker expression and pathological response. (C) Changes in marker expression levels and pathological response.
Relationship between marker expression and prognosis
The median PFS of the entire group was 20.0 months (95%CI: [12.4-27.6] months), and the median OS was 30.5 months (95%CI: [16.6-44.4] months). Both pre-NACT marker expression levels and the changes between pre and post-NACT were analysed as continuous variables.
None of the pre-NACT marker expression levels were associated with PFS (Table 3). In terms of OS, only higher pre-NACT PD-L1 expression was associated with worse outcome (HR: 1.2 95%CI: [1.0-1.5], P = 0.045) (Table 4). The baseline expression of other markers showed no significant correlations with outcome (Table 4).
Univariate and multivariate analyses of progression-free survival
| Variables | Univariate analysis | Multivariate analysis | ||
|---|---|---|---|---|
| HR (95%CI) | P value | HR (95%CI) | P value | |
| Gender | ||||
| Male | 1 | |||
| Female | 1.90(0.96-5.90) | 0.064 | ||
| Age (years) | ||||
| ≤55 | 1 | |||
| >55 | 1.50(0.73-2.90) | 0.280 | ||
| Tumor differentiation | ||||
| Poorly differentiated | 1 | |||
| Well or moderately differentiated | 0.55(0.27-1.10) | 0.090 | ||
| Chemotherapy regimen | ||||
| Platinum and fluorouracil (Group 1) | 1 | |||
| Platinum, fluorouracil and taxane (Group 2) | 0.83(0.43-1.60) | 0.580 | ||
| NACT response | ||||
| PR | 1 | |||
| SD | 0.97(0.51-1.90) | 0.930 | ||
| Tumor regression grading (Mandard system) | ||||
| Grade 2 or 3 | 1 | |||
| Grade 4 | 2.20(1.10-4.70) | 0.029 | 2.06(0.94-4.52) | 0.070 |
| Downstaging | ||||
| Yes | 1 | |||
| No | 2.40(1.20-4.80) | 0.011 | 1.70(0.81-3.55) | 0.159 |
| CD4 (continuous, 10 units) | ||||
| Pre-NACT | 1.00(0.91-1.20) | 0.550 | ||
| Change | 0.89(0.72-1.10) | 0.290 | ||
| CD8 (continuous, 10 units) | ||||
| Pre-NACT | 1.10(0.88-1.30) | 0.540 | ||
| Change | 0.80(0.66-0.98) | 0.030 | 0.79(0.63-0.99) | 0.041 |
| PD-1 (continuous, 10 units) | ||||
| Pre-NACT | 1.00(0.87-1.20) | 0.680 | ||
| Change | 0.85(0.71-1.00) | 0.069 | ||
| PD-L1 (continuous, 10 units) | ||||
| Pre-NACT | 1.10(0.91-1.30) | 0.310 | ||
| Change | 0.78(0.59-1) | 0.075 | ||
| TIM3 (continuous, 10 units) | ||||
| Pre-NACT | 0.99(0.83-1.20) | 0.910 | ||
| Change | 0.90(0.71-1.10) | 0.360 | ||
| FOXP3 (continuous, 10 units) | ||||
| Pre-NACT | 0.97(0.81-1.20) | 0.810 | ||
| Change | 0.88 (0.72-1.10) | 0.200 | ||
Univariate analysis of overall survival
| Variables | Univariate analysis | |
|---|---|---|
| HR (95%CI) | P value | |
| Gender | ||
| Male | 1 | |
| Female | 5.60(1.60-8.00) | 0.002 |
| Age (years) | ||
| ≤55 | 1 | |
| >55 | 1.00(0.50-2.10) | 0.930 |
| Tumor differentiation | ||
| Poorly differentiated | 1 | |
| Well or moderately differentiated | 0.41(0.19-0.90) | 0.025 |
| Chemotherapy regimen | ||
| Platinum and fluorouracil (Group 1) | 1 | |
| Platinum, fluorouracil and taxane (Group 2) | 0.84(0.42-1.70) | 0.620 |
| NACT response | ||
| PR | 1 | |
| SD | 1.00(0.51-2.10) | 0.940 |
| Tumor regression grading (Mandard system) | ||
| Grade 2 or 3 | 1 | |
| Grade 4 | 2.60(1.10-5.90) | 0.029 |
| Downstaging | ||
| Yes | 1 | |
| No | 2.80(1.30-5.90) | 0.008 |
| CD4 (continuous, 10 units) | ||
| Pre-NACT | 1.10(0.98-1.30) | 0.081 |
| Change | 0.90(0.71-1.10) | 0.400 |
| CD8 (continuous, 10 units) | ||
| Pre-NACT | 1.10(0.93-1.40) | 0.210 |
| Change | 0.75(0.59-0.95) | 0.016 |
| PD-1 (continuous, 10 units) | ||
| Pre-NACT | 1.10(0.94-1.30) | 0.200 |
| Change | 0.77(0.62-0.95) | 0.014 |
| PD-L1 (continuous, 10 units) | ||
| Pre-NACT | 1.20(1.00-1.50) | 0.045 |
| Change | 0.67(0.48-0.94) | 0.020 |
| TIM3 (continuous, 10 units) | ||
| Pre-NACT | 1.00(0.86-1.30) | 0.700 |
| Change | 0.82(0.62-1.10) | 0.170 |
| FOXP3 (continuous, 10 units) | ||
| Pre-NACT | 0.97(0.79-1.20) | 0.800 |
| Change | 0.88(0.68-1.10) | 0.290 |
Univariate analysis revealed that higher upregulation of CD8 had a substantially beneficial prognostic effect on PFS (HR: 0.80, 95%CI: [0.66-0.98], P = 0.030) (Table 3). The levels of changes in the other markers showed no significant correlations with PFS. Results from multivariate analysis showed that high upregulation of CD8 remained the only independent protective prognostic factor for PFS (HR: 0.79, 95%CI: [0.63-0.99], P = 0.041). In terms of OS, patients with higher upregulation of CD8 (HR: 0.75, 95%CI: [0.59-0.95], P = 0.016), PD-1 (HR: 0.77, 95%CI: [0.62-0.95], P = 0.014) and PD-L1 (HR: 0.67, 95%CI [0.48-0.94], P = 0.020) were associated with prolonged survival (Table 4), while the levels of the changes of all the other markers were not correlated with survival benefits. Multivariate analysis uncovered that high upregulation of CD8 (HR: 0.73, 95%CI: [0.55-0.97], P = 0.028), PD-1 (HR: 0.76, 95%CI: [0.60-0.97], P = 0.027) and PD-L1 (HR: 0.67, 95%CI: [0.45-0.98], P = 0.038) were independent beneficial prognostic factors of OS (Table 5).
Multivariate analysis of overall survival
| Variables | HR (95%CI) | P value |
|---|---|---|
| Analysis with CD8 expression | ||
| CD8 change | 0.73(0.55-0.97) | 0.028 |
| Gender | ||
| Male | 1 | |
| Female | 2.51(1.06-5.92) | 0.036 |
| Tumor differentiation | ||
| Poorly differentiated | 1 | |
| Well or moderately differentiated | 0.59(0.26-1.33) | 0.203 |
| Downstaging | ||
| Yes | 1 | |
| No | 1.18(0.49-2.87) | 0.709 |
| Tumor regression grading (Mandard system) | ||
| Grade 2 or 3 | 1 | |
| Grade 4 | 2.46(0.93-6.49) | 0.070 |
| Analysis with PD-1 expression | ||
| PD-1 change | 0.76(0.60-0.97) | 0.027 |
| Gender | ||
| Male | 1 | |
| Female | 1.72(0.72-4.13) | 0.224 |
| Tumor differentiation | ||
| Poorly differentiated | 1 | |
| Well or moderately differentiated | 0.47(0.20-1.08) | 0.075 |
| Downstaging | ||
| Yes | 1 | |
| No | 1.14(0.47-2.74) | 0.772 |
| Tumor regression grading (Mandard system) | ||
| Grade 2 or 3 | 1 | |
| Grade 4 | 2.63(0.98-7.06) | 0.054 |
| Analysis with PD-L1 expression | ||
| PD-L1 | 0.67(0.45-0.98) | 0.038 |
| Gender | ||
| Male | 1 | |
| Female | 1.47(0.57-3.79) | 0.429 |
| Tumor differentiation | ||
| Poorly differentiated | 1 | |
| Well or moderately differentiated | 0.50(0.22-1.17) | 0.109 |
| Downstaging | ||
| Yes | 1 | |
| No | 1.30(0.56-3.01) | 0.537 |
| Tumor regression grading (Mandard system) | ||
| Grade 2 or 3 | 1 | |
| Grade 4 | 2.69(1.01-7.17) | 0.048 |
Clinical variables and prognosis
In the univariate analysis, grade 4 tumor regression (HR: 2.20, 95%CI: [1.10-4.70], P = 0.029) and failing to downstage after NACT (HR: 2.40, 95%CI: [1.20-4.80], P = 0.011) were poor prognostic factors for PFS (Table 3). Grade 4 tumor regression (HR: 2.60, 95%CI: [1.10-5.90], P = 0.029), failing to downstage (HR: 2.80, 95%CI: [1.30-5.90], P = 0.008) and female (HR: 5.06, 95%CI: [1.60-8.00], P = 0.002) were poor prognostic factors of OS (Table 4). Well or moderately differentiated tumors (HR: 0.41, 95%CI: [0.19-0.90], P = 0.025) was a good prognostic factor of OS (Table 4). However, none of these factors reached statistical significance in the multivariate analysis (Table 3).
Discussion
PD-L1 and tumor-infiltrating immune cells can alter various following diverse treatment regimens in different malignancies [12-14, 17]. Even in different stage of the same type of tumor, the trend of change may not be consistent [17, 20]. Our study was the first to report discordancy in expression of multiple checkpoint molecules, other than solely PD-L1, as well as tumor immune cell markers following NACT in locally advanced gastric cancer. It is also distinguished from other previous reports by uncovering the fact that the change of another checkpoint molecule, TIM3, has a strong positive correlation with the change of PD-1 and PD-L1.
Our research showed that the expression of multiple checkpoint molecules and the infiltration of CD4+, CD8+ immune cells were significantly increased following NACT. When considering individual patient, immune modulation seemed to be different because a minority of patients presented with decreased expression of these markers. This likely reflected the heterogeneity of gastric cancer and did not interfere with the overall results.
The overall upregulation of the CD4 and CD8, together with the immunosuppressive markers PD-1 and PD-L1, might indicate a dynamic bi-directional shift of the tumor micro-environment during chemotherapy in gastric cancer. The changes in expression of CD4+, CD8+ immune cells, majorly composed by CD4+, CD8+ T lymphocytes, might imply an increase in T lymphocytes infiltration that resulted from a stimulatory immune response [12]. However, following the initial immune stimulation, PD-L1 overexpression is induced by interferon (IFN)-γ produced by activated T lymphocytes as negative feedback, which gradually re-programmes the tumor milieu from an active immune environment to a relatively balanced environment [21]. Simultaneously elevated infiltration of tumor immune cells and expression of checkpoint molecules have been described in multiple tumors, such as ovarian cancer and head and neck squamous cell carcinoma [13, 16]. In a chemotherapy-treated mouse xenograft model, CD8+ T-cell function was inhibited despite the increased number of CD8+ T-cells, and this inhibition was accompanied by the presence of PD-L1 [22]. Depletion of PD-L1 restored CD8+ T lymphocyte function and improved the antitumor response [22, 23]. Furthermore, tumor-bearing mice that were treated with a combination of paclitaxel and a PD-L1/PD-1 inhibitor survived longer than mice treated with paclitaxel alone [22]. The preliminary data discussed above provide evidence for the synergistic effect of the incorporation of chemotherapy and PD-1/PD-L1 checkpoint inhibitors.
An interesting finding of our study is the upregulation of TIM3 expression and its positive correlations with PD-1 and PD-L1 expression following NACT. TIM3 is an immune checkpoint receptor expressed on interferon (IFN)-γ-secreting T helper (Th)-1 cells, natural killer (NK) cells and CD8+ cells [24-26]. It suppresses the activation of T and NK cells upon engagement with its ligand, galectin-9 [24-26]. Upregulation of TIM3 might be associated with adaptive resistance to PD-1 blockade. Koyama et al revealed that in two fully immunocompetent mouse xenograft models of lung adenocarcinoma, the expression of TIM3 on T-cell was notably upregulated when tumors progression following response to anti-PD-1 therapy[27]. Addition of a TIM3 blocking antibody following failure of PD-1 blockade brought about a survival advantage [27]. In vitro, combined targeted therapy against TIM3 and PD-1 in colorectal cancer and hepatitis B virus-related hepatocellular carcinoma achieved remarkable effects on reversing tumor-induced T-cell exhaustion and dysfunction, and this effect was stronger than the effect of targeting either pathway alone [28, 29]. The strongly positive correlations between TIM3, PD-1 and PD-L1 expression in our research imply that dual targeted immunotherapy against PD-(L)1 and TIM3 might be a potentially beneficial choice for patients with gastric cancer. Multiple studies have also been initiated to investigate the safety and efficacy of combination of various immunotherapies (anti-TIM3 and anti-PD-1) with or without chemotherapy in tumors including gastric cancer. The results are worth expecting (ClinicalTrials.gov Identifier: NCT03469557, NCT02608268, NCT02817633, NCT03448835 and NCT03399071).
The changes of expression in all the immune markers in each chemotherapy group were in accordance with the entire cohort except that the upregulation of PD-L1 in Group 2 showed no significant difference. This may due to the effect of steroids on tumor immune micro-environment. Different from preclinical studies, in clinical practice, corticosteroids needed to be administrated before taxane to avoid adverse events. Corticosteroids can modulate the immune system in different ways [30, 31]. As taxane has been proven to significantly increase the expression of PD-L1 in preclinical experiment [22], we speculated that it might be the steroid that mitigated the elevation of PD-L1 expression in our research.
The prognostic value of immune markers remains controversial in gastric cancer. Wang et al found that gastric cancer patients with high level of pre-treatment CD8+ T lymphocytes was associated with a prolonged survival (P = 0.0058) [32], while Thompson et al revealed that a high CD8+ T lymphocyte density was correlated with worse PFS and OS [33]. Zhang et al found that pre-treatment PD-L1 positive was a negative independent prognostic factor for stage Ⅱ and Ⅲ gastric cancer patients (HR 2.696, 95%CI [1.468-4.951], P=0.001) [34]. Nevertheless, Böger et al revealed that high levels of PD-L1 and PD-1 expression in baseline sample were associated with significantly better outcomes (P<0.001) [35]. In our study, baseline CD8 level was not associated with survival. Higher level of pre-NACT PD-L1 seemed to correlate with a worse outcome. We provide a new interpretation that it is the levels of the changes, other than the specific baseline or post-treatment levels of CD8 and checkpoint molecule expression are of prognostic significance. This possible interpretation has not been thoroughly discussed in previous reports. In our research, multivariable analysis demonstrated that high upregulation of CD8, PD-1 and PD-L1 expression were independent protective prognostic factors for OS. As discussed above, significant upregulation of CD8 and checkpoint molecules may represent strong adaptive immunogenic reactions following NACT, which might be the intrinsic reason for survival benefits. Therefore, the levels of the changes in CD8 and checkpoint molecule expression might be more reliable predictors for prognosis in chemotherapy-involved conditions because these changes may reflect the dynamic process of the adaptive immune system.
The limitation of our study lies in the retrospective nature of the experiments. Inter- and intra-tumoral heterogeneity has been reported in gastric cancer and may introduce the possibility of bias [36]. The limited biopsy samples by endoscopy prevent us from analysing the pre-NACT immune profile in whole tumors. We did not analyze marker expression on tumor cells and on immune cells separately due to the relatively low PD-1 and PD-L1 positive rate. Apart from these limitations, our study revealed the concomitant elevation in expression of different checkpoint molecules and tumor immune cell markers following NACT, and it is also unique in uncovering positive pairwise correlations between level of changes in TIM3, PD-1 and PD-L1.
In conclusion, NACT can substantially increase the expression of various checkpoint molecules and the infiltration of CD4+ and CD8+ immune cells in most locally advanced gastric cancer patients with the levels of changes in checkpoint molecules positively correlated with each other. This provides a clue for applying immunotherapy with chemotherapy or dual checkpoint inhibitors in gastric cancer. The high upregulation of CD8, PD-1 and PD-L1 may be beneficial prognostic factors for patients.
Supplementary Material
Supplementary figure.
Acknowledgements
The authors thank Le Wang, PhD (National Cancer Center /National Clinical Research Center for Cancer /Cancer Hospital, Chinese Academy of Medical Sciences and Peking Union Medical College) for assistance with the statistical analysis. This work was supported by BeiGene (Beijing) Co., Ltd.
Abbreviations
NACT: neoadjuvant chemotherapy; LAGC: locally advanced gastric cancer; CD4: cluster of differentiation 4; CD8: cluster of differentiation 8; FOXP3: transcription factor forkhead box P3; PD-1: programmed cell death-1; PD-L1: programmed cell death-ligand 1; TIM3: T-cell immunoglobulin and mucin domain 3; OS: overall survival; NCC: National Cancer Center; CAMS & PUMC: Chinese Academy of Medical Sciences and Peking Union Medical College; RECIST: Response Evaluation Criteria in Solid Tumors; FFPE: Formalin-fixed, paraffin-embedded; EDTA: ethylene diamine tetraacetic acid; TSA: tyramide signal amplification; DAPI: 4',6-diamidino-2-phenylindole, dihydrochloride; PFS: progression-free survival; IFN: interferon; NK: natural killer.
Competing Interests
Authors Xiaopeng Ma, Yanjuan Zhang and Yun Zhang are employees of BeiGene (Beijing) Co., Ltd. The other authors report no conflict of interests.
References
1. Ferlay J, Soerjomataram I, Dikshit R, Eser S, Mathers C, Rebelo M. et al. Cancer incidence and mortality worldwide: sources, methods and major patterns in GLOBOCAN 2012. International journal of cancer. 2015;136:E359-86
2. Bang YJ, Van Cutsem E, Feyereislova A, Chung HC, Shen L, Sawaki A. et al. Trastuzumab in combination with chemotherapy versus chemotherapy alone for treatment of HER2-positive advanced gastric or gastro-oesophageal junction cancer (ToGA): a phase 3, open-label, randomised controlled trial. Lancet (London, England). 2010;376:687-97
3. Ychou M, Boige V, Pignon JP, Conroy T, Bouche O, Lebreton G. et al. Perioperative chemotherapy compared with surgery alone for resectable gastroesophageal adenocarcinoma: an FNCLCC and FFCD multicenter phase III trial. Journal of clinical oncology: official journal of the American Society of Clinical Oncology. 2011;29:1715-21
4. Horn L, Spigel DR, Vokes EE, Holgado E, Ready N, Steins M. et al. Nivolumab Versus Docetaxel in Previously Treated Patients With Advanced Non-Small-Cell Lung Cancer: Two-Year Outcomes From Two Randomized, Open-Label, Phase III Trials (CheckMate 017 and CheckMate 057). Journal of clinical oncology: official journal of the American Society of Clinical Oncology. 2017;35:3924-33
5. Reck M, Rodriguez-Abreu D, Robinson AG, Hui R, Csoszi T, Fulop A. et al. Pembrolizumab versus chemotherapy for PD-L1-positive non-small-cell lung cancer. The New England journal of medicine. 2016;375:1823-33
6. Balar AV, Galsky MD, Rosenberg JE, Powles T, Petrylak DP, Bellmunt J. et al. Atezolizumab as first-line treatment in cisplatin-ineligible patients with locally advanced and metastatic urothelial carcinoma: a single-arm, multicentre, phase 2 trial. Lancet (London, England). 2017;389:67-76
7. Turajlic S, Gore M, Larkin J. First report of overall survival for ipilimumab plus nivolumab from the phase III Checkmate 067 study in advanced melanoma. Annals of oncology: official journal of the European Society for Medical Oncology. 2018;29:542-3
8. Fuchs CS, Doi T, Jang RW-J, Muro K, Satoh T, Machado M. et al. KEYNOTE-059 cohort 1: efficacy and safety of pembrolizumab (pembro) monotherapy in patients with previously treated advanced gastric cancer. Journal of clinical oncology: official journal of the American Society of Clinical Oncology. 2017;35:4003
9. Kerr KM, Hirsch FR. Programmed Death Ligand-1 Immunohistochemistry: Friend or Foe? Archives of pathology & laboratory medicine. 2016;140:326-31
10. Kerr KM, Nicolson MC. Non-Small Cell Lung Cancer, PD-L1, and the Pathologist. Archives of pathology & laboratory medicine. 2016;140:249-54
11. Wu SP, Liao RQ, Tu HY, Wang WJ, Dong ZY, Huang SM. et al. Stromal PD-L1-Positive Regulatory T cells and PD-1-Positive CD8-Positive T cells Define the Response of Different Subsets of Non-Small Cell Lung Cancer to PD-1/PD-L1 Blockade Immunotherapy. Journal of thoracic oncology: official publication of the International Association for the Study of Lung Cancer. 2018;13:521-32
12. Bohm S, Montfort A, Pearce OM, Topping J, Chakravarty P, Everitt GL. et al. Neoadjuvant Chemotherapy Modulates the Immune Microenvironment in Metastases of Tubo-Ovarian High-Grade Serous Carcinoma. Clinical cancer research: an official journal of the American Association for Cancer Research. 2016;22:3025-36
13. Mesnage SJL, Auguste A, Genestie C, Dunant A, Pain E, Drusch F. et al. Neoadjuvant chemotherapy (NACT) increases immune infiltration and programmed death-ligand 1 (PD-L1) expression in epithelial ovarian cancer (EOC). Annals of oncology: official journal of the European Society for Medical Oncology. 2017;28:651-7
14. Song Z, Yu X, Zhang Y. Altered expression of programmed death-ligand 1 after neo-adjuvant chemotherapy in patients with lung squamous cell carcinoma. Lung cancer (Amsterdam, Netherlands). 2016;99:166-71
15. Pelekanou V, Barlow WE, Nahleh ZA, Wasserman B, Lo YC, von Wahlde MK. et al. Tumor infiltrating lymphocytes and PD-L1 expression in pre- and post-treatment breast cancers in the SWOG S0800 Phase II neoadjuvant chemotherapy trial. Molecular cancer therapeutics. 2018;17:1324-31
16. Leduc C, Adam J, Louvet E, Sourisseau T, Dorvault N, Bernard M. et al. TPF induction chemotherapy increases PD-L1 expression in tumour cells and immune cells in head and neck squamous cell carcinoma. ESMO open. 2018;3:e000257
17. Sheng J, Fang W, Yu J, Chen N, Zhan J, Ma Y. et al. Expression of programmed death ligand-1 on tumor cells varies pre and post chemotherapy in non-small cell lung cancer. Scientific reports. 2016;6:20090
18. Zhu Y, Sun Y, Hu S, Jiang Y, Yue J, Xue X. et al. Comparison of five tumor regression grading systems for gastric adenocarcinoma after neoadjuvant chemotherapy: a retrospective study of 192 cases from National Cancer Center in China. BMC gastroenterology. 2017;17:41
19. Noble F, Lloyd MA, Turkington R, Griffiths E, O'Donovan M, O'Neill JR. et al. Multicentre cohort study to define and validate pathological assessment of response to neoadjuvant therapy in oesophagogastric adenocarcinoma. The British journal of surgery. 2017;104:1816-28
20. Han JJ, Kim DW, Koh J, Keam B, Kim TM, Jeon YK. et al. Change in PD-L1 Expression After Acquiring Resistance to Gefitinib in EGFR-Mutant Non-Small-Cell Lung Cancer. Clin Lung Cancer. 2016;17:263-70 e2
21. Abiko K, Mandai M, Hamanishi J, Yoshioka Y, Matsumura N, Baba T. et al. PD-L1 on tumor cells is induced in ascites and promotes peritoneal dissemination of ovarian cancer through CTL dysfunction. Clinical cancer research: an official journal of the American Association for Cancer Research. 2013;19:1363-74
22. Peng J, Hamanishi J, Matsumura N, Abiko K, Murat K, Baba T. et al. Chemotherapy Induces Programmed Cell Death-Ligand 1 Overexpression via the Nuclear Factor-kappaB to Foster an Immunosuppressive Tumor Microenvironment in Ovarian Cancer. Cancer research. 2015;75:5034-45
23. Zhang P, Ma Y, Lv C, Huang M, Li M, Dong B. et al. Upregulation of programmed cell death ligand 1 promotes resistance response in non-small-cell lung cancer patients treated with neo-adjuvant chemotherapy. Cancer science. 2016;107:1563-71
24. Hastings WD, Anderson DE, Kassam N, Koguchi K, Greenfield EA, Kent SC. et al. TIM-3 is expressed on activated human CD4+ T cells and regulates Th1 and Th17 cytokines. European journal of immunology. 2009;39:2492-501
25. Zhu C, Anderson AC, Schubart A, Xiong H, Imitola J, Khoury SJ. et al. The Tim-3 ligand galectin-9 negatively regulates T helper type 1 immunity. Nature immunology. 2005;6:1245-52
26. Gallois A, Silva I, Osman I, Bhardwaj N. Reversal of natural killer cell exhaustion by TIM-3 blockade. Oncoimmunology. 2014;3:e946365
27. Koyama S, Akbay EA, Li YY, Herter-Sprie GS, Buczkowski KA, Richards WG. et al. Adaptive resistance to therapeutic PD-1 blockade is associated with upregulation of alternative immune checkpoints. Nat Commun. 2016;7:10501
28. Liu F, Zeng G, Zhou S, He X, Sun N, Zhu X. et al. Blocking Tim-3 or/and PD-1 reverses dysfunction of tumor-infiltrating lymphocytes in HBV-related hepatocellular carcinoma. Bulletin du cancer. 2018;105:493-501
29. Liu J, Zhang S, Hu Y, Yang Z, Li J, Liu X. et al. Targeting PD-1 and Tim-3 Pathways to Reverse CD8 T-Cell Exhaustion and Enhance Ex Vivo T-Cell Responses to Autologous Dendritic/Tumor Vaccines. Journal of immunotherapy (Hagerstown, Md: 1997). 2016;39:171-80
30. Ugor E, Prenek L, Pap R, Berta G, Ernszt D, Najbauer J. et al. Glucocorticoid hormone treatment enhances the cytokine production of regulatory T cells by upregulation of Foxp3 expression. Immunobiology. 2018;223:422-31
31. Cain DW, Cidlowski JA. Immune regulation by glucocorticoids. Nat Rev Immunol. 2017;17:233-47
32. Wang Y, Zhu C, Song W, Li J, Zhao G, Cao H. PD-L1 Expression and CD8(+) T Cell Infiltration Predict a Favorable Prognosis in Advanced Gastric Cancer. J Immunol Res. 2018;2018:4180517
33. Thompson ED, Zahurak M, Murphy A, Cornish T, Cuka N, Abdelfatah E. et al. Patterns of PD-L1 expression and CD8 T cell infiltration in gastric adenocarcinomas and associated immune stroma. Gut. 2017;66:794-801
34. Zhang L, Qiu M, Jin Y, Ji J, Li B, Wang X. et al. Programmed cell death ligand 1 (PD-L1) expression on gastric cancer and its relationship with clinicopathologic factors. International journal of clinical and experimental pathology. 2015;8:11084-91
35. Boger C, Behrens HM, Mathiak M, Kruger S, Kalthoff H, Rocken C. PD-L1 is an independent prognostic predictor in gastric cancer of Western patients. Oncotarget. 2016;7:24269-83
36. Gullo I, Carneiro F, Oliveira C, Almeida GM. Heterogeneity in Gastric Cancer: From Pure Morphology to Molecular Classifications. Pathobiology. 2018;85:50-63
Author contact
![]() Corresponding authors: Yixin Zeng, MD, PhD, State Key Laboratory of Molecular Oncology, National Cancer Center/National Clinical Research Center for Cancer/Cancer Hospital, Chinese Academy of Medical Sciences and Peking Union Medical College, No. 17 Panjiayuan Nanli, Chaoyang District, Beijing 100021, China; Department of Experimental Research, State Key Laboratory of Oncology in Southern China, Collaborative Innovation Center for Cancer Medicine, Sun Yat-sen University Cancer Center, No. 651 Dongfengdong Road, Guangzhou 510060, China. Tel.: +86-10-87788405; Fax: +86-10-67714380; E-mail: zengyxorg.cn and Aiping Zhou, MD, Department of Medical Oncology, National Cancer Center/National Clinical Research Center for Cancer/Cancer Hospital, Chinese Academy of Medical Sciences and Peking Union Medical College, No. 17 Panjiayuan Nanli, Chaoyang District, Beijing 100021, China; Tel.: +86-10-87788800; Fax: +86-10-67734107; E-mail: zhouap1825com
Corresponding authors: Yixin Zeng, MD, PhD, State Key Laboratory of Molecular Oncology, National Cancer Center/National Clinical Research Center for Cancer/Cancer Hospital, Chinese Academy of Medical Sciences and Peking Union Medical College, No. 17 Panjiayuan Nanli, Chaoyang District, Beijing 100021, China; Department of Experimental Research, State Key Laboratory of Oncology in Southern China, Collaborative Innovation Center for Cancer Medicine, Sun Yat-sen University Cancer Center, No. 651 Dongfengdong Road, Guangzhou 510060, China. Tel.: +86-10-87788405; Fax: +86-10-67714380; E-mail: zengyxorg.cn and Aiping Zhou, MD, Department of Medical Oncology, National Cancer Center/National Clinical Research Center for Cancer/Cancer Hospital, Chinese Academy of Medical Sciences and Peking Union Medical College, No. 17 Panjiayuan Nanli, Chaoyang District, Beijing 100021, China; Tel.: +86-10-87788800; Fax: +86-10-67734107; E-mail: zhouap1825com