3.2
Impact Factor
ISSN: 1837-9664
J Cancer 2019; 10(13):2953-2960. doi:10.7150/jca.31120 This issue Cite
Research Paper
Three Biomarkers Predict Gastric Cancer Patients' Susceptibility To Fluorouracil-based Chemotherapy
Department of Surgery, Shanghai Key Laboratory of Gastric Neoplasms, Shanghai Institute of Digestive Surgery, Ruijin Hospital, Shanghai Jiao Tong University School of Medicine, Shanghai 200025, People's Republic of China.
*These authors contributed equally to this work.
Received 2018-10-31; Accepted 2019-4-23; Published 2019-6-2
Abstract
Background: Fluorouracil-based chemotherapy is recommended by the main clinical guidelines for post-operative gastric cancer (GC) patient's chemotherapy treatment, this study aim to establish relate model to predict patients' susceptibility to fluorouracil-based chemotherapy to prevent patients' unnecessary exposure to chemotherapy treatments and improve patients' treatment.
Methods: Data from Gene Expression Omnibus (GEO) database, Cancer Cell Line Encyclopedia (CCLE) database, Cancer Therapeutics Response Portal (CTRP) and The Cancer Genome Atlas (TCGA) were used. A predictive model was built based on univariate and multivariate Cox analysis and visualized by nomogram. Survival analysis was performed using Kaplan-Meier and log-rank test.
Results: A total of 514 differentially expressed genes (DEGs) were identified between fluorouracil-resistant cell lines and fluorouracil-sensitive cell lines based on CCLE database. A total of 300 patients who had radical gastrectomy were recruited, of which 144 received fluorouracil-based chemotherapy and 156 were untreated. Three biomarkers (CTF1, BTN3A3, ADAD2) were finally selected by univariate and multivariate Cox regression analysis to establish the predictive models visualized by nomogram. This model could precisely predict both the Disease free survival (DFS) and Overall survival (OS) of patients treated with fluorouracil-based chemotherapy after surgery compared to untreated GC patients validated by both GEO database and TCGA database.
Conclusion: Our data established three genes-based predictive model which might predict GC patients' susceptibility to fluorouracil and help clinicians develop personalized treatment.
Keywords: Gastric cancer, Bioinformatics analysis, Cox regression analysis, Fluorouracil
Introduction
Gastric cancer (GC) is recognized as one of most commonly diagnosed cancer worldwide which has caused tremendous burdens throughout the world especially in eastern Asia [1-3]. Despite the implement of perioperative chemotherapy and radiotherapy, the prognosis of GC patients still remains poor [4, 5]. Recently, fluorouracil-based chemotherapy is recommended by the main clinical guidelines for post-operative GC patient's chemotherapy treatment. However, due to the chemoresistance, it exhibits little effect on a part of GC patients. Therefore, establishing relate model to predict GC patients' susceptibility to fluorouracil could guide individual therapy and exempt those patients from unnecessary exposure to chemotherapy treatments and develop more suitable treatments.
With the income of genomic era, a large number of genome-sequencing technologies such as microarray have emerged with significant clinical applications [6, 7]. Recently, microarray technology has been performed on GC to investigate the underlying mechanisms contributing to the development of GC. Combined with microarray technology, we could apply bioinformatics analysis to comprehensively analyze the change of biological molecules in the initiation and progression of GC to guide clinical treatments. Fluorouracil was recommended as one of major chemotherapeutic drugs for GC treatment according to the recent clinic guidelines. However, there were still a part of GC patients benefitting little from it. Therefore, it was urgent to establish relate predictive model to predict GC patients' susceptibility to fluorouracil to exempt them from unnecessary exposure to toxicity and the financial burden of chemotherapy treatment.
In this study, we aimed to establish predictive model to predict GC patients' susceptibility to fluorouracil so as to exempt patients from unnecessary exposure to chemotherapy treatment. Based on Cancer Cell Line Encyclopedia (CCLE, http://portals.broadinstitute.org/) [8], GSE62254 dataset from Gene Expression Omnibus database (GEO) [9] and Cancer Therapeutics Response Portal (CTRP) [10], we had screened three potential genes including CTF1, BTN3A3 and ADAD2 to establish the predictive model. Then, a nomogram was performed to visualize the model and internally validated in the GEO database (GSE62254) and externally validated in The Cancer Genome Atlas (TCGA) database (https://cancergenome.nih.gov/). In conclusion, this model might help clinicians formulate personalized treatment and exempt patients from unnecessary exposure to chemotherapy treatment.
Materials and Methods
Data Source
The gene expression profiles of GSE62254 were downloaded from GEO database. GSE62254 dataset which was based on GPL570 platform (Affymetrix Human Genome U133 Plus 2.0 Array) contained 300 patients' samples, including 144 patients treated with fluorouracil-based and 156 patients untreated after surgery. The clinical information of the dataset was referred to Cristescu R [9]. The data of GC cell lines expression profiling assay were downloaded from CCLE (http://portals.broadinstitute.org/) [8]. The information of fluorouracil IC50 of 19 GC cell lines was extracted from CTRP [10]. The TCGA data (https://cancergenome.nih.gov/) were downloaded for externally validation.
Identification of differentially expressed genes (DEGs)
Firstly, we obtained the fluorouracil IC50 of GC cell lines from CTRP database, which was then divided into three groups, namely, fluorouracil-resistant group, fluorouracil-moderately sensitive group and fluorouracil-sensitive group according to their fluorouracil IC50. Then we obtained the GC cell lines' raw counts of the expression profiling assay from the CCLE database. Next, the DEGs were calculated using the limma R package. The DEGs of the database with an absolute Log2 fold change (FC) > 0.585 and a P value < 0.05 were considered for subsequent analysis. Volcano map and Pheatmap package in R language was utilized to describe the DEGs.
Gene Ontology (GO) analysis and Kyoto Encyclopedia of Genes and Genomes (KEGG) analysis
GO analysis was a helpful tool to annotate genes and identify characteristic biological attributes for high-throughput genome or transcriptome data [11, 12]. We performed GO analysis through DAVID database (https://david.ncifcrf.gov/) [13] to analyze the DEGs at functional level, P < 0.01 was considered statistically significant. KEGG analysis is also a useful method to systematically analyze gene functions, linking genomic information with higher-order functional information. We performed KEGG analysis through clusterProfiler R Package [14].
Establishment of predictive model
Univariate Cox regression analysis was firstly conducted to investigate the correlation between the Disease free survival (DFS) of GC patients who underwent fluorouracil-based treatment after surgery and the expression level of DEGs and gene with its P < 0.01 was considered significant. Then we used Venn diagram (http://bioinformatics.psb.ugent.be/webtools/Venn/) to preliminarily select target genes which significantly up-regulated in GC cell lines and with its Hazard ratio (HR) > 1 in the univariate Cox regression analysis or significantly down-regulated with its HR < 1. Then, a multivariate Cox regression analysis was performed to further select potential genes to establish the predictive model based on univariate Cox regression analysis.
Next, we constructed a nomogram [15] based on multivariate Cox regression analysis to visualize predictive model. Receiver operating characteristic (ROC) was plotted and an optimal cut-off value was applied to classify patients into low-risk (fluorouracil-sensitive) and high-risk (fluorouracil-resistant) group referred to the method elucidated by Xiang Z [16] according to the risk score calculated by the predictive model. The survival analysis of these two groups was then performed through Kaplan-Meier method and log-rank test using GraphPad Prism 6.0 (Inc., La Jolla, CA, United States).
Results
Identification of DEGs between fluorouracil-resistant and fluorouracil-sensitive GC cell lines
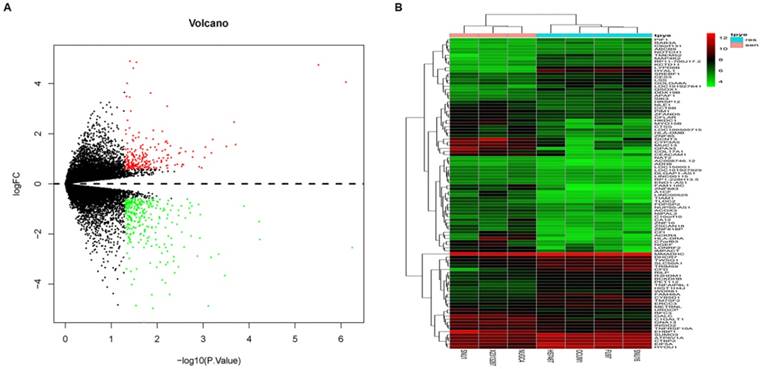
7 GC cell lines (4 fluorouracil-resistant cell lines and 3 fluorouracil-sensitive cell lines) were selected for subsequent analysis to preliminarily understand the mechanism contributing to the fluorouracil resistance. A total of 514 DEGs (Log FC > 0.585 or Log FC < -0.585, P < 0.05) were identified. Among them, 295 genes were down-regulated and 219 genes were up-regulated. Volcano map and DEGs expression heat map (top 100 DEGs) were shown in Fig. 1A and 1B respectively.
GO and KEGG analysis of DEGs
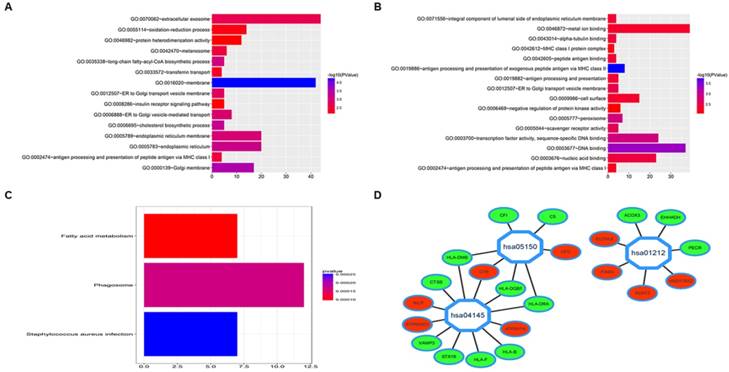
To preliminarily analyzed DEGs at functional level, we performed GO and KEGG analysis. We submitted up-regulated DEGs and down-regulated DEGs respectively to the online software DAVID (https://david.ncifcrf.gov/) [13] to identify relate GO categories which showed that up-regulated DEGs were mainly enriched in extracellular exosome and membrane and down-regulated DEGs were mainly involved in metal ion binding, DNA binding, transcription factor activity, sequence-specific DNA binding and nucleic acid binding (Fig. 2A and 2B). KEGG analysis showed DEGs were mainly enriched in pathways including fatty acid metabolism, phagosome and staphylococcus aureus infection (Fig. 2C) which was visualized by Cytoscape software (Fig. 2D).
Univariate and multivariate Cox regression analysis
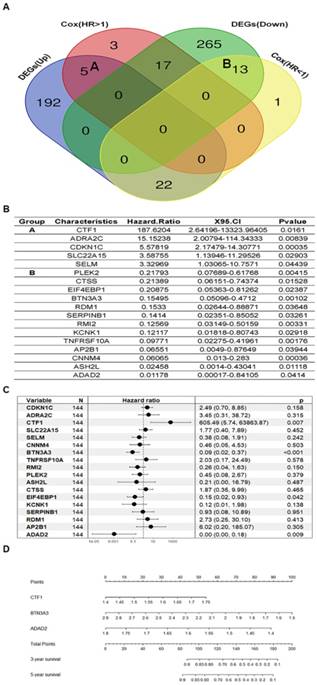
To investigate the correlation of the DEGs with the DFS of GC patients treated with fluorouracil-based chemotherapy after gastrectomy, we conducted univariate Cox regression analysis and identified 18 genes that that significantly related to DFS of GC patients (P < 0.05) and consistently changed with that in GC cell lines using Venn diagram (Fig. 3A Group A and B, Fig. 3A and 3B).
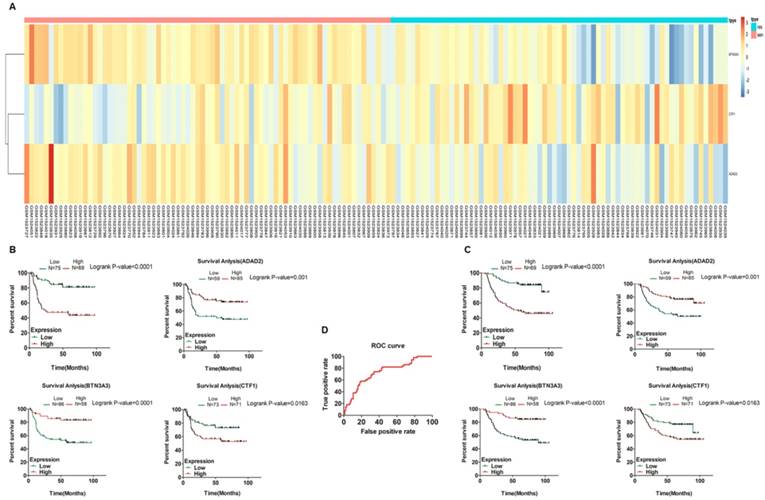
To establish relate model to predict GC patients' susceptibility to fluorouracil-based chemotherapy, we then performed multivariate Cox regression analysis and three genes with their P < 0.01 were then chosen to build the predictive model consisting of CTF1, BTN3A3 and ADAD2 (Fig. 3C). Genes including BTN3A3 and ADAD2 showed negative coefficients in the multivariate Cox regression analysis, implying low-risk signatures while CTF1 showed the opposite effect. For the 144 patients accepted fluorouracil-based chemotherapy with survival time in this study, we further applied nomogram to visualize the predictive model as follows, risk score = -2.02586739 * e-12 * (expression level of CTF1)2 + 153.962828321946 * (expression level of CTF1) - 71.4285714285714 * (expression level of BTN3A3) + 4.0660291 * e-13 * (expression level of ADAD2)2 -221.671172109573 * (expression level of ADAD2) + 390.603007 (Fig. 3D). The prognostic capacity of the three-gene signature was assessed by calculating the AUC of the ROC curve, the AUC of the predictive model was 0.7279, indicating this model had a high sensitivity and specificity (Fig. 4D).
DEGs between fluorouracil-resistant GC cell lines and fluorouracil-sensitive GC cell lines. A. volcano map of DEGs; B. Heat map of the top 100 DEGs; In each subfigure, color representation red: up-regulation, green: down-regulation.
GO analysis and KEGG analysis of DEGs between fluorouracil-resistant GC cell lines and fluorouracil-sensitive GC cell lines. A. GO analysis of differentially up-regulated genes; B. GO analysis of differentially down-regulated genes; C. KEGG analysis of DEGs; D. KEGG analysis of DEGs Visualized by Cytoscape, hsa04145 means Phagosome pathway, hsa05150 means Staphylococcus aureus infection pathway, hsa01212 means fatty acid metabolism pathway, color representation red: up-regulation, green: down-regulation.
Univariate and multivariate Cox regression analysis of DEGs and nomogram. A. Venn diagram of four different groups of genes (DEGs(Down) and DEGs(Up) mean differentially down-regulated genes or differentially up-regulated genes between fluorouracil-resistant GC cell lines and fluorouracil-sensitive GC cell lines respectively, Cox(HR<1) and Cox(HR>1) mean genes with Hazard Ratio < 1 or Hazard Ratio > 1 respectively based on univariate Cox regression analysis; B. Univariate Cox regression analysis of genes of group A and B of subfigure A; C. Multivariate Cox regression analysis of selected genes based univariate Cox regression analysis; D. nomogram of selected genes including CTF1, BTN3A3 and ADAD2 based on multivariate Cox regression analysis.
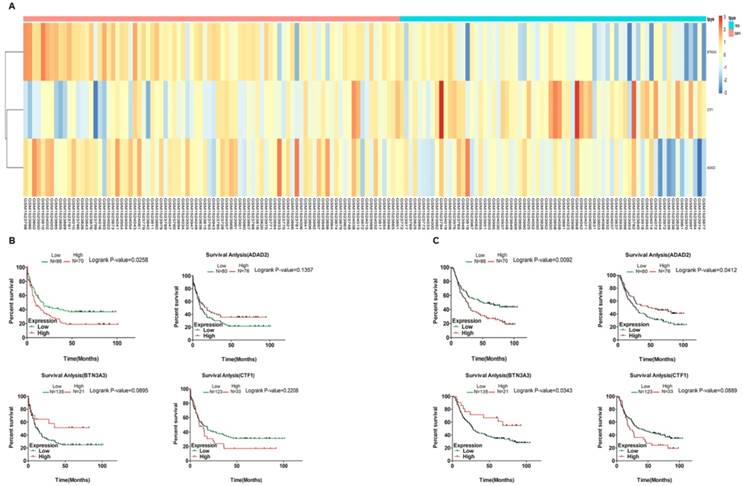
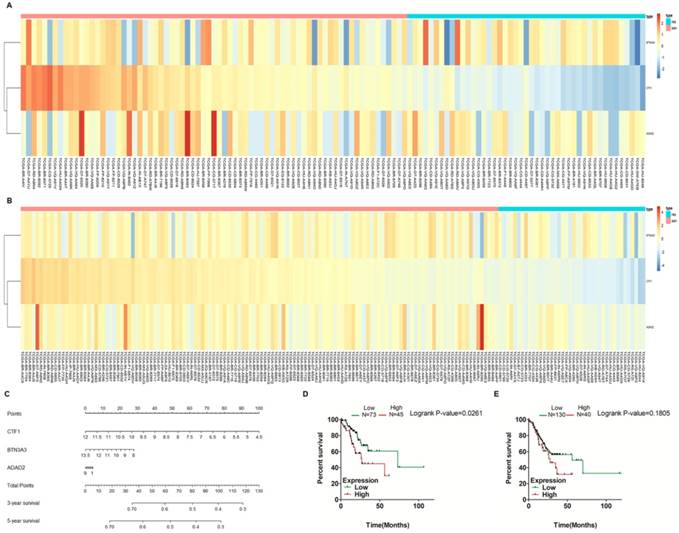
To validate its accuracy of predicting the patients' susceptibility to fluorouracil, we performed survival analysis of each selected gene by Kaplan-Meier method and log-rank test. We found each selected gene was significantly correlated with the DFS and Overall survival (OS) of GC patients treated with fluorouracil-based chemotherapy while none of these genes were significantly correlated with the DFS of untreated GC patients and only ADAD2 and BTN3A3 correlated with the OS of non-treated patients, indicating the specificity of the model (Fig. 4B and 4C, Fig. 5B and 5C). Then we performed clustering analysis of patients treated with fluorouracil-based chemotherapy or untreated after surgery respectively (Fig. 4A and Fig. 5A), besides, we calculated the risk score of GC patients treated with fluorouracil-based chemotherapy based on the predictive model and the optimal cut-off value based on ROC curve. In terms of patients treated with fluorouracil-based chemotherapy, a total of 69 patients were classified into high-risk (fluorouracil-resistant) group and 75 patients into low-risk (fluorouracil-sensitive) group according to the cut-off value. Both the KM-DFS curves and KM-OS curves of two groups were significantly different (P < 0.0001, Fig. 4B and 4C) compared to untreated patients (P = 0.0258 and 0.0092 respectively, Fig. 5B and 5C), further indicating the specificity of the model to predict the patients' susceptibility to fluorouracil. Besides, we externally validated it through TCGA database. Considering the difference between GEO and TCGA platforms, we performed nomogram based on TCGA database which turned out that risk score = -13.3333333333333 * (expression level of CTF1) + 6.3154 * e-16 * (expression level of BTN3A3)3 - 2.392473 * e-14 * (expression level of BTN3A3)2 - 5.06653163166626 * (expression level of BTN3A3) - 0.480941681079322 * (expression level of ADAD2) +232.7267 (Fig. 6C). The patients were classified according to their risk scores and the cut-off values of the ROC curve. The clustering analysis of patients treated with fluorouracil-based chemotherapy and untreated patients after surgery were shown in Fig. 6A and 6B which showed significant different three genes-based models between predictive fluorouracil-resistant patients and fluorouracil-sensitive patients of patients treated with fluorouracil-based chemotherapy while no significant difference was found among untreated patients. This result further proved the specificity of the predictive model. We then performed survival analysis of each selected gene by Kaplan-Meier method and log-rank test to externally validate the model's accuracy through TCGA database. A total of 288 patients were recruited, among them, 118 patients were treated with fluorouracil-based chemotherapy and 170 patients were untreated after surgery. For the treated patients, 45 patients were classified into high-risk (fluorouracil-resistant) group and 73 patients into low-risk (fluorouracil-sensitive) group according to the cut-off value. For the untreated patients, 40 patients were classified into high-risk (fluorouracil-resistant) group and 130 patients into low-risk (fluorouracil-sensitive) group according to the cut-off value. The KM-OS curves of two groups of patients treated with fluorouracil-based chemotherapy were significantly different (P = 0.0261, Fig. 6D) compared to untreated patients (P = 0.1805, Fig. 6E), indicating the specificity of the model to predict the patients' susceptibility to fluorouracil.
Clustering analysis and K-M curves of fluorouracil-based chemotherapy treated patients of GEO cohort (GSE62254) based on predictive model. A. Pheatmap of fluorouracil-sensitive and fluorouracil-resistant patients treated with fluorouracil-based chemotherapy after surgery based on multivariate Cox regression analysis; (B and C). K-M survival curves show the correlation of predictive model and each selected genes with the DFS and OS of patients who received fluorouracil-based chemotherapy after surgery respectively. D. ROC curve of the predictive model.
Clustering analysis and K-M curves of untreated patients of GEO cohort (GSE62254) based on predictive model. A. Pheatmap of fluorouracil-sensitive and fluorouracil-resistant patients untreated after surgery based on multivariate Cox regression analysis; (B and C). K-M survival curves show the correlation of predictive model and each selected genes with the DFS and OS of untreated patients respectively.
Clustering analysis, nomogram and K-M curves of TCGA cohort based on predictive model. (A and B). Pheatmap of fluorouracil-sensitive and fluorouracil-resistant groups of patients treated with fluorouracil-based chemotherapy and untreated patients after surgery respectively based on multivariate Cox regression analysis; C. nomogram of selected genes including CTF1, BTN3A3 and ADAD2; (D and E). K-M survival curves show the correlation of predictive model with the OS of patients treated with fluorouracil-based chemotherapy and untreated patients respectively.
Discussion
Fluorouracil is recommended by the main clinical guidelines for post-operative GC patient's chemotherapy treatment. Considering its side effects and financial burden, it is of great importance to establish relate model to predict GC patients' susceptibility to fluorouracil, exempting those patients from unnecessary exposure to toxicity and the financial burden of fluorouracil-based chemotherapy treatments and improving individual survival. Nowadays genomic technologies make it possible to simultaneously detect expression levels of thousands of genes. Combined with bioinformatic tools, we are able to investigate underlying biomarkers contributing to chemoresistance to fluorouracil and establish predictive model to predict the GC patients' susceptibility to fluorouracil and guide personalized treatments. In this study, we downloaded the data of GC cell lines expression profiling assay from CCLE (http://portals.broadinstitute.org/) [8] and the information of fluorouracil IC50 of 19 GC cell lines from CTRP [10]. We firstly divide GC cell lines into three groups, namely, fluorouracil-resistant, fluorouracil-moderately sensitive, fluorouracil-sensitive groups according to their fluorouracil IC50. Then we identify 295 down-regulated genes 219 up-regulated genes between fluorouracil-resistant GC cell lines and fluorouracil-sensitive GC cell lines using bioinformatics analysis. We then perform GO term analysis and KEGG analysis to preliminarily understand them at functional level which turn out that up-regulated DEGs are mainly enriched in extracellular exosome and membrane and down-regulated DEGs are mainly involved in metal ion binding, DNA binding, transcription factor activity, sequence-specific DNA binding and nucleic acid binding, genes above-mentioned are mainly enriched in pathways including fatty acid metabolism, phagosome and staphylococcus aureus infection. We next perform univariate Cox regression analysis to preliminarily screen genes correlate with the prognosis of GC patients who receive fluorouracil-based chemotherapy after surgery. The data involved are downloaded from GSE62254 of GEO database (including 144 patients accept fluorouracil-based treatment after surgery and 156 untreated patients, relate clinical information are referred to Cristescu R [9]). Based on univariate Cox regression analysis, we select 18 genes that consistently change with that in GC cell lines via Venn diagram for stepwise multivariate Cox regression analysis. Multivariate Cox regression analysis screens three genes including CTF1, BTN3A3 and ADAD2 to establish the predictive model. Zhang, N [17] has reported that CTF1 could improve the proliferative capacity of immortalized hematopoietic precursor cells via interacting with HOX11. Bustos, M [18] found CTF1 could promote the liver engraftment of colon carcinoma cells through mediating immune system. The anti-apoptosis role of CTF1 according to previous researches indicates CTF1 might contribute to tumor chemoresistance via inhibiting tumor cell apoptosis. Concerning to BTN3A3, Peedicayil A [20] has found that single nucleotide polymorphisms in BTN3A3 were inversely associated with invasive risk of ovarian cancer. Since epithelial-mesenchymal transition (EMT) is one of the major mechanisms contributing to tumor metastasis, besides, EMT is also a vital factor in tumor chemoresistance, therefore, BTN3A3 may improve tumor susceptibility to chemotherapeutic drugs via inhibiting the biological process of EMT. Jeon, Y. J demonstrated that BTN3A3 acted as a cancer suppressor gene promoting cellular apoptosis of non-small cell lung cancer [19]. The tumor-suppressing biological effect of BTN3A3 also implies BTN3A3 may promote the tumor susceptibility to chemotherapeutic drugs. Unfortunately, there lacks relate report about the role of ADAD2 in the progression of tumor. The biological effects of CTF1 and BTN3A3 concluded in other researches resemble that of our study, further indicating the precision of the predictive model. However, since their biological roles in the progression of GC remain elusive, and we lack relate experimental data to support it, further investigation is needed to demonstrate the relation between these genes and GC chemoresistance.
Then we validated the accuracy of the predictive model. The patients are divided into high-risk (fluorouracil-resistant) and low-risk (fluorouracil-sensitive) groups according to the predictive model. Survival analysis shows that this model can precisely predict prognosis (both DFS and OS) of patients treated with fluorouracil-based chemotherapy (P < 0.0001) compared to untreated patients (P = 0.0258 and 0.0092 respectively), indicating that this model may specifically predict the patients' susceptibility to fluorouracil and help guide the clinicians to change the patients' treatment plan to develop individualized treatment of GC patients, namely, patients of high-risk (fluorouracil-resistant) group should be treated with other chemotherapeutics instead of fluorouracil to exempt them from unnecessary exposure to toxicity and the financial burden of chemotherapy treatments and improve the patients' prognosis. We further externally validated it through TCGA database which showed the model could predict prognosis of patients treated with fluorouracil-based chemotherapy (P = 0.0261) compared to non-treated patients (P = 0.1805). In conclusion, our data established the three-genes-based predictive model which could be a reliable tool to predict patients' susceptibility to fluorouracil and assist clinicians in selecting personalized treatment for GC patients. However, considering the limited number of involved patients and lack of experimental data to support our conclusion, further studies are needed to prove its feasibility.
Conclusions
Overall, we have established the three-genes-based predictive model which could be a reliable tool to predict patients' susceptibility to fluorouracil and assist clinicians in choosing personalized treatment for GC patients to exempt patients form unnecessary exposure to chemotherapy treatment.
Abbreviations
GC: Gastric Cancer; GEO: Gene Expression Omnibus; CCLE: Cancer Cell Line Encyclopedia; TCGA: The Cancer Genome Atlas; CTRP: Cancer Therapeutics Response Portal; DEGs: Differentially Expressed Genes; DFS: Disease Free Survival; OS: Overall Survival.
Acknowledgements
This study was supported by The Cross-Institutes Research Fund of Shanghai Jiao Tong University (NO.YG2017MS58).
Author Contributions
Jiaomeng Pan and Qingqiang Dai contributed equally to this work. Bingya Liu, Chen Li and Zhen Xiang designed the study. Jiaomeng Pan wrote the main manuscript text and performed figures. Bingya Liu reviewed the manuscript.
Competing Interests
The authors have declared that no competing interest exists.
References
1. Torre LA, Bray F, Siegel RL, Ferlay J, Lortet-Tieulent J, Jemal A. Global cancer statistics, 2012. CA Cancer J Clin. 2015;65:87-108
2. Van Cutsem E, Sagaert X, Topal B, Haustermans K, Prenen H. Gastric cancer. Lancet. 2016;388:2654-64
3. Chen W, Zheng R, Baade PD, Zhang S, Zeng H, Bray F. et al. Cancer statistics in China, 2015. CA Cancer J Clin. 2016;66:115-32
4. Paoletti X, Oba K, Burzykowski T, Michiels S, Ohashi Y, Pignon JP. et al. Benefit of adjuvant chemotherapy for resectable gastric cancer: a meta-analysis. JAMA. 2010;303:1729-37
5. Jiang L, Yang KH, Guan QL, Chen Y, Zhao P, Tian JH. Survival benefit of neoadjuvant chemotherapy for resectable cancer of the gastric and gastroesophageal junction: a meta-analysis. J Clin Gastroenterol. 2015;49:387-94
6. Kulasingam V, Diamandis EP. Strategies for discovering novel cancer biomarkers through utilization of emerging technologies. Nat Clin Pract Oncol. 2008;5:588-99
7. Wang Z, Gerstein M, Snyder M. RNA-Seq: a revolutionary tool for transcriptomics. Nat Rev Genet. 2009;10:57-63
8. Barretina J, Caponigro G, Stransky N, Venkatesan K, Margolin AA, Kim S. et al. The Cancer Cell Line Encyclopedia enables predictive modelling of anticancer drug sensitivity. Nature. 2012;483:603-7
9. Cristescu R, Lee J, Nebozhyn M, Kim KM, Ting JC, Wong SS. et al. Molecular analysis of gastric cancer identifies subtypes associated with distinct clinical outcomes. Nat Med. 2015;21:449-56
10. Basu A, Bodycombe NE, Cheah JH, Price EV, Liu K, Schaefer GI. et al. An interactive resource to identify cancer genetic and lineage dependencies targeted by small molecules. Cell. 2013;154:1151-61
11. The Gene Ontology (GO) project in 2006. Nucleic Acids Res. 2006; 34: D322-6.
12. Ashburner M, Ball CA, Blake JA, Botstein D, Butler H, Cherry JM. et al. Gene ontology: tool for the unification of biology. The Gene Ontology Consortium. Nat Genet. 2000;25:25-9
13. Dennis G Jr, Sherman BT, Hosack DA, Yang J, Gao W, Lane HC. et al. DAVID: Database for Annotation, Visualization, and Integrated Discovery. Genome Biol. 2003;4:P3
14. Yu G, Wang LG, Han Y, He QY. clusterProfiler: an R package for comparing biological themes among gene clusters. OMICS. 2012;16:284-7
15. Iasonos A, Schrag D, Raj GV, Panageas KS. How to build and interpret a nomogram for cancer prognosis. J Clin Oncol. 2008;26:1364-70
16. Xiang Z, Zhou ZJ, Xia GK, Zhang XH, Wei ZW, Zhu JT. et al. A positive crosstalk between CXCR4 and CXCR2 promotes gastric cancer metastasis. Oncogene. 2017;36:5122-33
17. Zhang N, Shen W, Hawley RG, Lu M. HOX11 interacts with CTF1 and mediates hematopoietic precursor cell immortalization. Oncogene. 1999;18:2273-9
18. Bustos M, Dubrot J, Martinez-Anso E, Larequi E, Castano D, Palazon A. et al. Cardiotrophin-1 determines liver engraftment of syngenic colon carcinoma cells through an immune system-mediated mechanism. Oncoimmunology. 2012;1:1527-36
19. Jeon YJ, Bang W, Cho JH, Lee RH, Kim SH, Kim MS. et al. Kahweol induces apoptosis by suppressing BTF3 expression through the ERK signaling pathway in non-small cell lung cancer cells. Int J Oncol. 2016;49:2294-302
20. Peedicayil A, Vierkant RA, Hartmann LC, Fridley BL, Fredericksen ZS, White KL. et al. Risk of ovarian cancer and inherited variants in relapse-associated genes. PloS one. 2010;5:e8884
Author contact
![]() Corresponding authors: Chen Li, MD, PhD., or Bingya Liu, MD, PhD., Department of Surgery, Shanghai Key Laboratory of Gastric Neoplasms, Shanghai Institute of Digestive Surgery, Ruijin Hospital, Shanghai Jiao Tong University School of Medicine, Shanghai 200025. E-mail: leedoctorcom (CL) or liubingyaedu.cn (BL); Tel: 86-21-64670644; Fax: 86-21-64393909
Corresponding authors: Chen Li, MD, PhD., or Bingya Liu, MD, PhD., Department of Surgery, Shanghai Key Laboratory of Gastric Neoplasms, Shanghai Institute of Digestive Surgery, Ruijin Hospital, Shanghai Jiao Tong University School of Medicine, Shanghai 200025. E-mail: leedoctorcom (CL) or liubingyaedu.cn (BL); Tel: 86-21-64670644; Fax: 86-21-64393909

 Global reach, higher impact