Impact Factor ISSN: 1837-9664

 Global reach, higher impact
J Cancer 2019; 10(15):3533-3542. doi:10.7150/jca.22462 This issue Cite
Research Paper
HCCR-1 is a Novel Prognostic Indicator for Gastric Cancer and Promotes Cell Proliferation
Liang-Fei Zhu1,2*, Peng Ma1*, Yi-Lin Hu1,2, Ying Feng1, Peng Li1, Hua Wang3, Yi-Bing Guo2, Qin-Sheng Mao1 ![]() , Wan-Jiang Xue1,2
, Wan-Jiang Xue1,2 ![]()
1. Department of Gastrointestinal Surgery , Nantong University Affiliated Hospital, Nantong 226001, Jiangsu, China
2. Research Center of Clinical Medicine, Nantong University Affiliated Hospital, Nantong 226001, Jiangsu, China
3. Department of Pathology, Nantong University Affiliated Hospital, Nantong 226001, Jiangsu, China
*These authors contributed equally to this work.
Received 2018-8-5; Accepted 2019-5-2; Published 2019-6-9
Abstract
The role of the human cervical cancer oncogene (HCCR-1) in the development of various tumors has been elucidated; however, its expression and function in gastric cancer remains largely unknown. Accordingly, the expression of HCCR-1 and epidermal growth factor (EGF) were detected in paired gastric cancer tissues and cell lines by western blotting (WB) and immunohistochemistry (IHC). Furthermore, the correlations between HCCR-1 expression in 209 gastric cancer tissues and the clinicopathological features and disease prognosis were analyzed. A stable HCCR-1 overexpression cell line was established, and the influence of increased HCCR-1 expression on the growth of gastric cancer cells was observed in vivo and in vitro. The expression of HCCR-1 generally increased in gastric cancer tissues. Further, increased HCCR-1 expression in gastric cancer tissues was associated with tumor T stage and was an independent factor that influenced poor postoperative prognosis in gastric cancer patients. A positive correlation was also detected between the expression of EGF and HCCR-1 in a time- and dose-dependent manner. The overexpression of HCCR-1 might enhance the growth rate of gastric cancer cells in vitro, increase the number of colony forming units, and promote the growth, volume, and weight of subcutaneous tumors in nude mice. In conclusion, HCCR-1 is a gastric cancer oncogene, and its increased expression plays a critical role in the occurrence and development of gastric cancer. Hence, HCCR-1 could serve as a valuable marker for the postoperative prognostic assessment of gastric cancer patients.
Keywords: HCCR-1, Gastric cancer, Carcinogenesis, Oncogene, Prognosis, Clinicopathological characteristics
Introduction
Gastric cancer (GC) is a common malignant digestive system tumor that ranks fourth worldwide in morbidity and second in mortality. The incidence of GC exceeds 400,000 cases annually, accounting for more than 40% of cancer rates worldwide, and the death toll has reached as high as 300,000 [1, 2]. China, in particular, is one of the highest GC prevalence areas. Although the diagnosis and treatment of GC has greatly improved over the past 20 years, the confirmed diagnostic rate for early stage GC has remained quite low, and most GC patients are already in the middle to late stage when diagnosed. For reasons including the high postoperative recurrence rate of advanced GC and the associated resistance to chemotherapy, the clinical prognosis of GC patients remains poor, and the 5-year survival rate is less than 30% [3]. Therefore, studies of the molecular mechanisms underlying GC occurrence and development are of great significance, and will aid in the prevention of GC and in determining new effective therapeutic targets.
The occurrence and development of GC is a multi-step and multi-stage biological process [4, 5]. The activation of oncogenes and the inactivation of tumor suppressor genes resulting from epigenetic and genetic changes are the core biological processes underlying the occurrence of GC [6]. The expression of oncogenes might influence cell signal transduction in several ways and disrupt normal cellular functions, leading to disorders of cell proliferation, differentiation, cycle regulation, and apoptosis, and inducing the transition from normal to cancerous cells [7].
The human cervical cancer gene (HCCR) is an oncogene that has attracted significant attention in recent years. HCCR was isolated and identified from normal cervical tissues and cervical cancer tissues by Ko et al. using the differential display polymerase chain reaction (PCR) method. HCCR is located on chromosome 12q in humans, and is separated as HCCR-1 (GenBank accession No. AF195651) and HCCR-2 (GenBank accession No. AF315598) based on the distinct features of each gene. HCCR-1 is a 360-amino-acid protein with a molecular weight of 42 kD. Compared with HCCR-1, HCCR-2 lacks exon 1, but it shares the same amino acid sequence with HCCR-1 at residues 57-360 [8]. The biological functions of HCCR-1 remain unclear, but it reportedly promotes tumor occurrence and development by influencing the p53 and PI3K/Akt pathways [9]. Recently, its function in the inhibition of pancreatic and colon cancer cell growth was confirmed by in vitro experiments [10]. Overexpression of HCCR-1 not only inhibited the apoptosis caused by radiation and chemotherapy drugs, but also inhibited the apoptosis of colon cancer cells when combined with overexpression of deleted in polyposis 1 (DP1) [11]. The expression of HCCR-1 might influence the occurrence of tumors by affecting the epithelial-mesenchymal transition of cancer cells [12]. Prior reports have indicated that HCCR-1 is overexpressed in various malignant tumor tissues, including cervical, pancreatic, breast, esophageal, and colon cancer, as well as hepatocellular carcinoma (HCC) [8, 10, 13-17]. Furthermore, the increased expression of HCCR-1 could serve as a molecular marker and aid in the early diagnosis of HCC and breast cancer [13, 17]. To this end, the overall survival of patients exhibiting increased HCCR-1 expression in esophageal squamous cancer tissues was lower than that of patients exhibiting low expression (P<0.05) [14]. However, no study focusing on the relationship between HCCR-1 expression in GC tissues and GC occurrence and development has been reported.
In this study, we examined the role of HCCR-1 expression in GC occurrence and development. We evaluated the expression of HCCR-1 in paired GC and normal tissues by western blotting (WB) and immunohistochemistry (IHC) and analyzed the correlation between HCCR-1 expression in GC and its clinicopathological features and prognosis using clinical pathology data. Stable HCCR-1 overexpression GC cell lines were established, and the influence of increased HCCR-1 expression on the biological behavior of GC cells was observed. The results of these experiments revealed that increased HCCR-1 expression might promote GC occurrence and development, and could serve as an independent molecular marker of poor prognosis in patients with GC.
Materials and Methods
Patients and tissue samples
All GC samples were collected from patients who underwent GC D2 radical surgery at the Affiliated Hospital of Nantong University (Jiangsu, China). All patients were definitively diagnosed with GC by pathologic histology, and did not receive adjuvant chemotherapy, radiotherapy, or immunotherapy prior to surgery. The patients were assigned to two groups. The first group comprised 30 patients who underwent surgery from February 2015 to April 2015. From each patient, a fresh GC specimen and a paired tissue specimen adjacent to the carcinoma were collected and analyzed using WB and IHC. The second group comprised 209 GC patients who underwent surgery from January 2010 to October 2010. Specimens collected from these patients were embedded in paraffin and used to generate tissue microarrays (TMA). Follow-up was performed on these 209 patients, with a cut-off date of March 2016 and an average follow-up period of 48 months (range: 2-75 months). Clinical data were obtained from hospital medical history records and included age, gender, and tumor diameter, as well as degree of differentiation, Lauren classification, T stage, N stage, and carcinoembryonic antigen (CEA) level. This study was approved by the Ethics Committee of the Affiliated Hospital of Nantong University, and all patients provided written informed consent.
Western blotting
Proteins from the tissues and cells were extracted using a protein lysis buffer and protease inhibitors, and the total protein concentration in each sample was determined using the bicinchoninic acid protein assay kit from Beyotime Institute of Biotechnology (Shanghai, China). Polyacrylamide gel electrophoresis was performed using 100 g/L total protein, and the resulting gel was transferred to a polyvinylidene fluoride membrane (Beyotime Institute of Biotechnology) and blocked in 1% Tween 20 in tris-buffered saline containing 5% skimmed milk powder. The HCCR-1 antibody was added and the membranes were incubated overnight at 4°C and then washed three times with 1% Tween 20 in tris-buffered saline. The horse radish peroxidase (HRP)-conjugated secondary antibody was then added; the membranes were incubated for two hours at room temperature. An enhanced chemiluminescence light-emitting buffer was added, and the membranes were exposed in a gel imaging system (Bio-Rad Laboratories, USA). Glyceraldehyde-3-phosphate dehydrogenase (GAPDH) was used as an internal reference. All of the antibodies were diluted and used according to the manufacturer's instructions. The HCCR-1 antibody was purchased from Abcam (USA), and the GAPDH antibody was purchased from Cell Signaling Technology (USA). The HRP-conjugated secondary antibody was purchased from Santa Cruz Biotechnology (USA).
Semi-quantitative polymerase chain reaction
Experimental methods for RNA extraction from cells and semi-quantitative PCR have been described previously [18]. The primers used included: HCCR-1, forward: 5′-CCAACTACCTGGTCTTCTTGCTAATGT-3′, reverse: 5′-GGTTCATGCCCAGAGGATGGTTAG-3′, and GAPDH, forward: 5′-AGAAGGCTGGGGCTCATTTG-3′, reverse: 5′-AGGGGCCATCCACAGTCTTC-3′.
TMA and IHC
Typical cancer nest areas were selected and labeled on the 209 pairs of paraffin embedded GC tissue blocks based on the corresponding microscopy results from the hematoxylin and eosin stained pathological sections and the TMAs were generated. The experimental IHC methods were performed as previously described [19]. The TMAs and paraffin slices were stained using the Autostainer Universal Staining System (Lab Vision, Kalamazoo, MI, USA) using rabbit anti-human HCCR-1 (ab-175410; Abcam) and rabbit anti-human EGF (ab-9695; Abcam) primary antibodies. Double-blind examinations of the slices were performed by two experienced pathologists, and staining intensity was scored as follows: 0, negative; 1, weak positive; 2, positive; and 3, strong positive. The percentage of stained positive cells was as follows: 0, <5%; 1, >5%-25%; 2, >25-50%; 3, >50-75%; and 4, >75%). The samples were then classified based on the sum of the staining intensity and the number of positive cells with 0-2 indicating low expression and >3 corresponding to high expression.
Cell culture and EGF treatment
Six GC cell lines (AGS, SGC-7901, MKN-45, MKN-28, MGC-803, and BGC-83) and one normal gastric mucosa cell line (GES-1) were purchased from GeneChem (Shanghai, China) and cultured in RPMI-1640 medium (Corning, USA). The SGC-7901 cells were cultured in serum-free RPMI-1640 medium for 24 hours, followed by culturing in different EGF (Abcam) concentrations (0, 60, and 120 ng/mL) for 24 hours and culturing in 60 ng/mL of EGF for different periods (0, 12, and 24 hours). Changes in the expression of HCCR-1 were then detected in the cells by WB.
Plasmid construction and transfection
The GV248-HCCR-1 eukaryotic expression vector containing the entire HCCR-1 sequence was purchased from GeneChem (Shanghai, China). The SGC-7901 cells were transfected with GV248-HCCR-1 or an empty plasmid (GV248) using Lipofectamine® 2000 (Invitrogen, USA). After 48 hours, the cells were screened using 400 µg/mL of G418 for 2 weeks and positive clone cells were selected and sequentially cultured for 10 weeks. Stable HCCR-1 overexpression GC cell lines were selected and validated by WB.
Cell proliferation and colony formation assays
Cell proliferation was evaluated using the growth curve of each cell line, which was determined using the Cell Counting Kit-8 (CCK-8, Beyotime Institute of Biotechnology) method in accordance with the manufacturer's instructions. The control SGC-7901 cells expressed empty plasmid and the untreated SGC-7901 cells were with no transfection. The colony formation experiment was performed by staining each cell line with crystal violet and counting the number of effective clones after culturing for two weeks. Clones with more than 50 colonies and a colony diameter greater than 40 μm were considered effective clones.
In vivo tumorigenicity assay
The SGC-7901 cells were resuspended in serum-free RPMI-1640 medium at a concentration of 5 × 10⁶ cells/mL. Eighteen 4-5-week-old male nude mice were randomly assigned to four groups, and each mouse was inoculated with 0.1 mL of cell suspension in the right axillary subcutis. The length and width of the tumor was measured weekly using a vernier caliper, and the tumor size was calculated as volume (mm3) = 0.5 × length (mm) × width2 (mm2). The mice were euthanized 6 weeks later, the tumors were collected and weighed, and the growth curve was calculated. All of the animal experiments were performed using protocols approved by the Animal Center of the Medical College of Nantong University.
Statistical analysis
Each experiment was repeated in triplicate. All data were processed with SPSS 17.0 (version 17.0; Chicago, IL, USA) and presented as the mean ± standard deviation (SD). A T-test was conducted for the intergroup analysis, and the relationship between HCCR-1 and clinicopathological parameters was analyzed using a chi-square test. The factors that contributed to increased HCCR-1 expression were identified using a multivariable, unconditional logistic regression model. The correlation between clinicopathological factors and GC patient prognosis was examined using a Kaplan-Meier survival analysis. Independent factors that influenced the prognosis of GC patients were analyzed using the Cox regression model. A P-value <0.05 was considered statistically significant.
Results
HCCR-1 is upregulated in human GC tissues
The evaluation of HCCR-1 expression in the 30 cases of fresh GC tissue sample pairs detected by WB revealed that the expression of the HCCR-1 protein was significantly higher in 20 of the GC tissues than the corresponding levels in the matched normal gastric mucosa tissues adjacent to the carcinoma (Figure 1A). As well, the expression of HCCR-1 was significantly lower in only eight of the GC tissues when compared with the matched normal gastric mucosa tissues adjacent to the carcinoma (Figure 1A). WB results indicated that the relative expression level of HCCR-1 protein was significantly higher in the GC tissues group than the matched normal gastric mucosa tissues group (Figure 1B).
HCCR-1 is upregulated in human GC tissue. A. The typical image of western blot bands of HCCR-1 in 30 paired fresh gastric cancer tissues(C) and the corresponding non-cancerous gastric tissues (N). B. The protein expression level of HCCR-1 was significantly higher in 30 paired fresh gastric cancer (GC) tissues than the matched normal gastric mucosa (Non-cancerous) tissues;*P<0.05. C. Representative IHC images of HCCR-1 expression in 209 gastric cancer (C28 and C153) and matched non-cancerous tissues (N28 and N153) (40×, 200×). D. The expression level of HCCR-1 was significantly higher in 209 paired gastric cancer (GC) tissues than the matched normal gastric mucosa (Non-cancerous) tissues. E. The Kaplan-Meier survival curve indicated that postoperative survival rates were lower in GC patients with increased HCCR-1 expression.
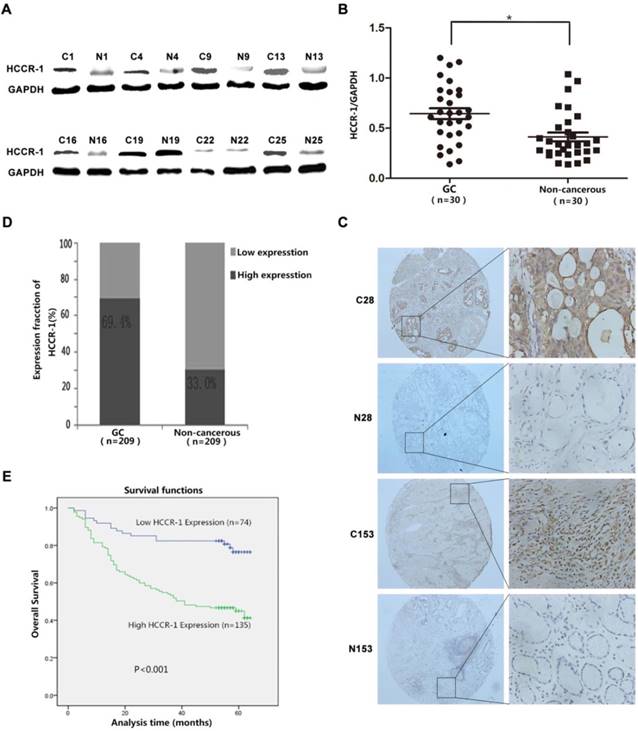
The TMAs generated from the 209 cases of paired GC specimens were evaluated by IHC, the results of which revealed that HCCR-1 was primarily expressed in the cell cytoplasm and membrane (Figure 1C). The expression of HCCR-1 was higher than in the paired adjacent normal tissues in 135 cases (135/209, 64.6%). The expression of HCCR-1 was lower than in the paired adjacent normal tissues in 74 cases (74/209, 35.4%). Further, the difference in HCCR-1 expression in the matched tissue samples was statistically significant (P<0.001; Figure 1D).
Increased HCCR-1 expression in GC tissues is associated with clinicopathological characteristics
Based on a single factor analysis of the correlation between HCCR-1 expression and the clinicopathological characteristics of the 209 GC patients, we determined that increased HCCR-1 expression was correlated with T stage (X2=25.573), N stage (X2=14.759), and tumor diameter (X2=15.166). However, HCCR-1 expression was not correlated with age, gender, differentiation, or CEA level (Table 1). Based on a multi-factor analysis with logistic regression, increased HCCR-1 expression was related to T stage (P=0.004, odds ratio [OR]=1.524, 95% confidence interval [CI]: 1.148-2.022) and tumor diameter (P=0.045, OR=2.185, 95% CI: 1.018-4.691). Additionally, greater increases in HCCR-1 expression in GC tissues corresponded to later T stages.
Relationship between HCCR-1 expression and clinicopathological characteristics in patients with GC.
| Clinicopathological characteristics | Number | Low expression | High expression | χ2 | P-value |
|---|---|---|---|---|---|
| Total | 209 | 74 | 135 | ||
| Gender | 0.157 | 0.757 | |||
| Male | 142 | 49 (34.5%) | 93 (65.5%) | ||
| Female | 67 | 25 (37.3%) | 42 (62.7%) | ||
| Age (years) | 0.042 | 0.853 | |||
| ≤50 | 38 | 14 (36.8%) | 24 (63.2%) | ||
| >50 | 171 | 60 (28.7%) | 111 (53.1%) | ||
| Tumor differentiation | 2.768 | 0.251 | |||
| Low | 98 | 40 (40.8%) | 58 (59.2%) | ||
| Middle | 86 | 25 (29.1%) | 61 (70.9%) | ||
| High | 25 | 9 (36.0%) | 16 (64.0%) | ||
| Tumor diameter (cm) | 15.166 | <0.001* | |||
| ≤4 | 45 | 27 (60.0%) | 18 (40.0%) | ||
| >4 | 164 | 47 (28.7%) | 117 (71.3%) | ||
| T stage | 25.573 | <0.001* | |||
| I | 46 | 30 (65.2%) | 16 (34.8%) | ||
| II | 27 | 9 (33.3%) | 18 (66.7%) | ||
| III IV | 20 116 | 8 (40.0%) 27 (23.3%) | 12 (60.0%) 89 (76.7%) | ||
| N stage | 14.759 | 0.02* | |||
| 0 | 99 | 40 (40.4%) | 59 (59.6%) | ||
| 1 | 32 | 18 (56.2%) | 14 (43.8%) | ||
| 2 | 42 | 9 (21.4%) | 33 (78.6%) | ||
| 3 | 36 | 7 (19.4%) | 29 (80.6%) | ||
| CEA level (ng/ml) | 1.730 | 0.188 | |||
| ≤5 | 176 | 59 (33.5%) | 117 (66.5%) | ||
| >5 | 33 | 15 (45.5%) | 18 (54.5%) |
*P<0.05
The correlation between increased HCCR-1 expression and GC prognosis
Following the single factor log rank analysis, we found that increased HCCR-1 expression (P<0.001), tumor diameter (P<0.001), tumor differentiation (P=0.013), tumor T stage (P<0.001), and tumor N stage (P<0.001) were associated with postoperative survival time, which suggested that HCCR-1 was one of the factors that influenced GC prognosis (Table 2). Furthermore, age, gender, and CEA level were not related to postoperative survival (P>0.05). Using a multi-factor Cox regression analysis, we found that increased HCCR-1 expression (P=0.012), tumor T stage (P=0.016), and tumor N stage (P<0.001) were associated with patient prognosis. Further, the Kaplan-Meier survival curve indicated that postoperative survival rates were low in GC patients with increased HCCR-1 expression (Figure 1E; P<0.001). The postoperative 3-year survival rate was 54.07% in patients with high HCCR-1 expression and 82.43% in patients with low HCCR-1 expression. Similarly, the postoperative 5-year survival rate was 45.19% in patients with high HCCR-1 expression and 78.38% in patients with low HCCR-1 expression.
Univariate and multivariate analysis of overall survival for 209 GC patients
| Variable | Overall survival | |||
|---|---|---|---|---|
| Univariate analysis | Multivariate analysis | |||
| P>|z| | P>|z| | HR (95% CI) | ||
| HCCR-1 expression | Low (n=74) vs. high (n=135) | <0.001* | 0.012* | 0.472 (0.263-0.849) |
| Gender | Male (n=142) vs. female (n=67) | 0.597 | ||
| Age (years) | ≤50 (n=38) vs. >50 (n=171) | 0.803 | ||
| Tumor differentiation | Low (n=98) vs. middle (n=86) vs. high (n=25) | 0.013* | 0.342 | |
| Tumor diameter (cm) | ≤4 (n=45) vs. >4 (n=164) | <0.001* | ||
| T stage | T1 (n=46) | <0.001* | 0.016* | |
| T2 (n=27) | ||||
| T3 (n=20) | ||||
| T4 (n=116) | ||||
| N stage | 0 (n=99) | <0.001* | <0.001* | |
| 1 (n=32) | ||||
| 2 (n=42) | ||||
| 3 (n=36) | ||||
| CEA level (ng/ml) | ≤5 (n=176) | 0.502 | ||
| >5 (n=33) | ||||
*P<0.05
EGF induces increases in HCCR-1 expression in GC cells
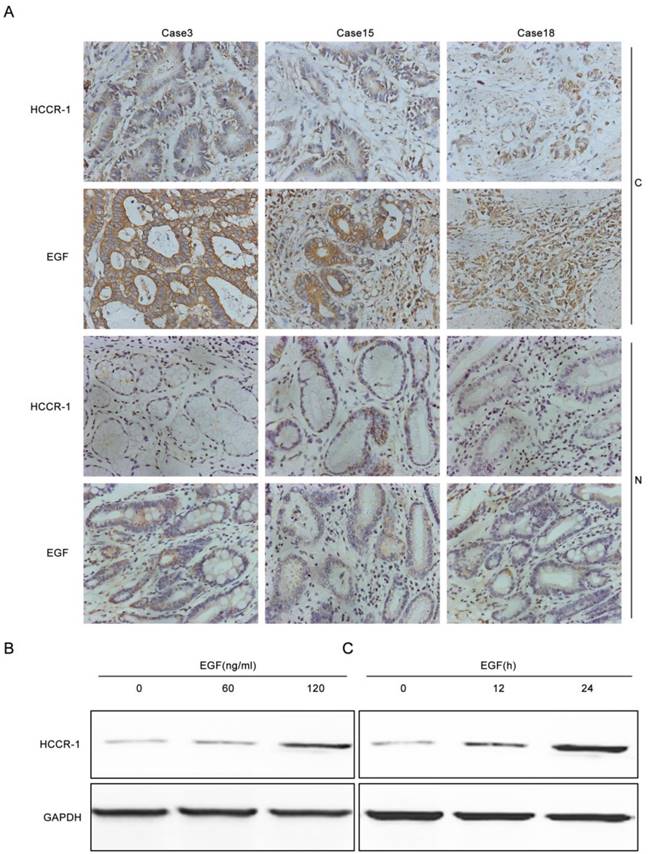
To verify whether increased EGF expression in GC tissues induced increases in HCCR-1 expression, the EGF and HCCR-1 expression in 30 pairs of GC tissues and normal tissues adjacent to the carcinoma were determined by IHC (Figure 2A). The results revealed that in the 30 GC tissue samples, the high EGF and HCCR-1 expression rates were 73.3% and 67.7%, respectively. Both high EGF and HCCR-1 expression were detected in 17 cases, and low EGF and HCCR-1 expression were found in five cases. Statistical analysis revealed that the expression levels of EGF and HCCR-1 were positively correlated (r=0.853, P<0.05).The SCG-7901 GC cell line was also treated with EGF. The expression of HCCR-1 in SCG-7901 cells cultured under serum-free conditions was very low, and 24 hours after stimulation with EGF (60 ng/mL), the expression increased in a dose-dependent manner. As well, the expression of HCCR-1 remained significantly increased 24 hours after this EGF stimulation (Figure 2B-2C).
EGF induces increased HCCR-1 expression in GC cells. A. Representative IHC images of HCCR-1 and EGF expression in 30 pairs of fresh GC and matched non-cancerous gastric tissues (200×). B, C. After stimulation with EGF, the expression of HCCR-1 in SCG-7901 cells increased in a dose- and time-dependent manner.
The influence of overexpressed HCCR-1 on the SGC-7901 cell line in vitro and in vivo
To investigate HCCR-1 expression in gastric cell lines, the RNA level in GES-1 cells and in six GC cell lines (AGS, SGC-7901, MKN-28, MKN-45, BGC-823, and MGC-803) were compared. The results of this semi-quantitative RT-PCR revealed that the expression levels of HCCR-1 in the six GC cell lines were different. Compared with the normal gastric mucosa cell line (GES-1), HCCR-1 expression in the AGS, MKN-28, MKN-45, BGC-823, and MGC-803 cells was higher; however, expression in the SGC-7901 cells was lower (Figure 3A).
The influence of HCCR-1 overexpression on SGC-7901 cells in vitro and in vivo. A. HCCR-1 RNA levels in gastric cancer cells (SGC-7901, MGC-803, MKN-28, MKN-45, BGC-823, and AGS) and a normal gastric cell line (GES-1) were determined by semi-quantitative RT-PCR. B. Analysis of HCCR-1 expression in the recombinant SGC-7901 cells by western blotting. The control group expressed empty plasmid and two sublines (GH-1A and GH-1B) stably over-expressed HCCR-1. The untreated SGC-7901 cells were with no transfection. C. The CCK-8 assay was used to evaluate the proliferation rate of recombinant SGC-7901 cells. The growth rates of the two stable cell lines (GH1-A and GH-1B) were both significantly higher than the control group and the untreated group. D, E. The colony formation assay showed the number of colonies formed by the two stable cell lines (GH1-A and GH-1B) was significantly higher than the number of colonies of the control group and the untreated group. F. the size of the tumors obtained after subcutaneous injection of the recombinant SCG-7901 cells in nude mice for six weeks. G. the average weight of tumors of the two subtype groups (GH1-A and GH-1B) were heavier than the weight of tumors of the control group and the untreated group(*P<0.05). H. The average volume of tumors of the two subtype groups (GH1-A and GH-1B) were larger than the volume of tumors of the control group and the untreated group (*P<0.05).
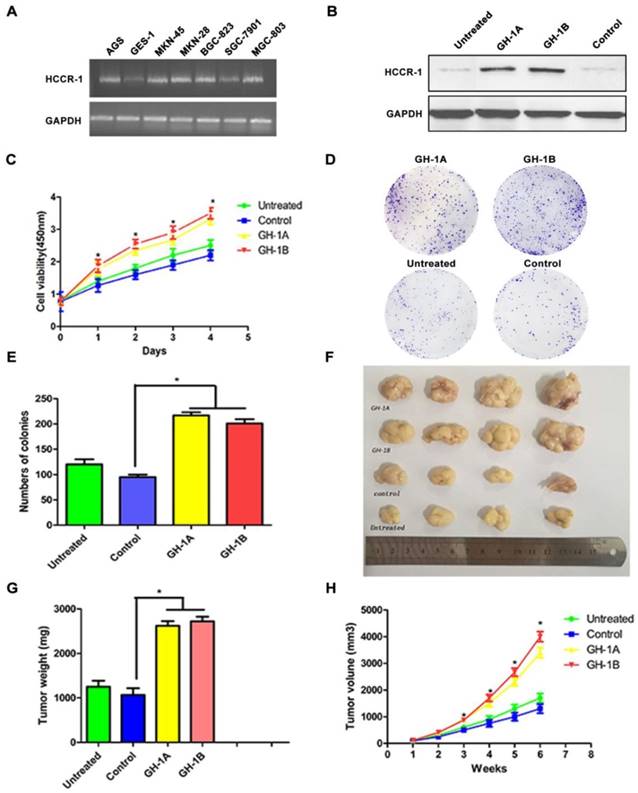
To study the role of HCCR-1 in the occurrence and development of GC, the SGC-7901 cell line was transfected with an overexpression plasmid, and two stable HCCR-1 overexpression subtype SGC-7901 cell lines (GH-1A and GH-1B) were successfully established. As validated by WB, these two subtype cell lines were both able to overexpress HCCR-1 (Figure 3B).
To further study the influence of increased HCCR-1 expression on GC cell growth and tumorigenicity, the growth curve of each cell line was examined, which revealed that the growth rates of the two stable cell lines (GH1-A and GH-1B) were both significantly higher than the corresponding rates in the control group and the untreated group (Figure 3C). Meanwhile, the colony formation assay revealed that the number of colonies formed by the two stable cell lines (GH1-A and GH-1B) was significantly higher than the number of colonies formed by the control group and the untreated group (P<0.01; Figure 3D-3E). The nude mouse tumorigenic experiment indicated that the tumor formation rate in the nude mouse subcutis in the two stable cell lines (GH-1A and GH-1B) was significantly higher than the rates observed in the control group and the untreated group (Figure 3F). Six weeks later, the average size and weight of tumors in the two subtype groups (GH1-A and GH-1B) were larger than the size and weight of tumors observed in the control group and the untreated group (P<0.01; Figure 3G-3H).
Discussion
The purpose of this study was to elucidate the role and function of HCCR-1 in the development of GC. Previous studies have revealed a close correlation between increased HCCR-1 expression and the occurrence of malignant tumors. Meng et al. studied 152 colon cancer tissue samples and found that HCCR-1 expression was upregulated in 123 of the cases [15]. In addition, Xu et al. found that the positive expression of HCCR-1 in pancreatic cancer tissues was significantly higher than corresponding levels in tissues adjacent to the carcinoma and in benign tumor tissues [10]. Similarly, Liu et al. evaluated HCCR-1 transcription and protein levels in esophageal squamous cell carcinoma (ESCC) tissues, and found that the expression of HCCR-1 in ESCC tissues was higher than levels in tissues adjacent to the carcinoma and normal esophageal epithelial tissues, and that increased HCCR-1 expression was significantly correlated with histological grade, clinical stage, and lymph node metastasis. Researchers have also found that the survival times of patients with low HCCR-1 expression in esophageal cancer tissues were longer than those of patients with high HCCR-1 expression. In this study, our results also revealed that HCCR-1 was highly expressed in GC tissues, and that the increased expression was closely correlated with GC T stage, N stage, and tumor diameter [14]. All of these findings indicate that increased HCCR-1 expression is closely related to GC occurrence and development. Furthermore, we also confirmed that increased HCCR-1 expression was an independent factor that led to the poor postoperative prognosis of GC patients, and that the postoperative survival time of GC patients with high HCCR-1 expression was shorter than that of patients with low HCCR-1 expression.
In recent years, scientists have conducted a number of studies on tumor markers that could be used in early GC diagnosis, but no tumor marker with both satisfactory sensitivity and specificity has been identified. A recent study indicated that HCCR-1 could be used in the early diagnosis of HCC and breast cancer. As well, the sensitivity and specificity of HCCR-1 in the diagnosis of HCC was 78.2% and 95.7% [20], respectively. In particular, in patients with tumor diameters smaller than 2 cm, the positive rate of HCCR-1 was 40.1%, which was significantly higher than that of alpha-fetoprotein (AFP; <25%) [16, 21]. Furthermore, the sensitivity of HCCR-1 in the diagnosis of breast cancer was 86.8%, which is 21.0% higher than the sensitivity of CA15-3. For CA15-3—negative early stage breast cancer patients, the positive HCCR-1 detection rate was 87.8%. Thus, HCCR-1 was far superior to CA15-3 in detecting early breast cancer [22]. We examined the serum concentrations of HCCR-1 in 50 GC patients (10.5 ± 1.5 ng/mL) and 50 healthy individuals (10.3 ± 2.1 ng/mL) using enzyme-linked immunosorbent assay (data not shown). The results revealed that there were no significant differences between the two groups, indicating that HCCR-1 could not be used as a serum marker for GC diagnosis. In future studies, we will increase the sample size for further validation.
Abnormal cell proliferation is an important biological characteristic of tumor cells. Studies have shown that NIH/3T3 cells that underwent malignant transformation after transfection with HCCR formed more clones on soft agar and differentiated into epithelial cell carcinomas [8]. Xu et al., using MTT experiments, found that transfection of HCCR-1 siRNA into a pancreatic cancer cell line in which HCCR expression was upregulated decreased cell proliferation [10]. We transfected the established HCCR-1 interference lentivirus into GC cell lines with high HCCR-1 expression. However, we were unable to find fragments that effectively interfered with HCCR-1 expression but did not affect the expression of HCCR-2. Our results were validated several times by WB. Thus, we transfected the SGC-7901 cell line, which had low HCCR-1 expression, with an HCCR-1 overexpression plasmid to establish a stable HCCR-1 overexpression GC cell line. Through the cell growth curve and colony formation assays, we confirmed that the overexpression of HCCR-1 significantly promoted the ability of GC cells to proliferate. Our results suggest that HCCR-1 serves as an oncogene in the occurrence and development of GC.
EGF is a polypeptide growth factor that has an obvious effect on the promotion of cell proliferation via the protein kinase B (PKB) and MAPK-cell signal transduction pathways in a variety of tissues, and is closely related to tumor occurrence and development [23, 24]. Gastric mucosal epithelial hyperplasia is advantageous to the repair of the mucosa after damage, but excessive hyperplasia also promotes gastric mucosal epithelial cells to gradually transform into malignant tumors [25, 26]. Filipe et al. noted the overexpression of EGF in the gastric mucosa with intestinal metaplasia and abnormal hyperplasia, which increased with pathological progress, indicating that there was a distinct correlation between the overexpression of EGF and gastric mucosa cancer [27]. The increased expression of EGF in GC tissues compared to normal gastric mucosal tissues was also confirmed. Studies have likewise found that the expression of EGF in pancreatic cancer cells could upregulate the expression of HCCR-1 in a dose- and time-dependent manner [10]. Our results also confirmed that there was a positive correlation between high EGF expression and increased HCCR-1 expression in GC tissues and cell lines. We speculated that EGF might regulate the expression of HCCR-1 by combining with EGF receptor and activating the relevant downstream signal transduction pathways.
In conclusion, we found that increased HCCR-1 expression was common in GC and appeared to promote the occurrence and development of GC, suggesting a poor postoperative prognosis in GC patients. Furthermore, the increased expression of HCCR-1 was positively correlated with high EGF expression. Increased HCCR-1 expression also promoted the growth of GC cells in vivo and in vitro. Therefore, HCCR-1 might serve as a valuable marker for poor GC prognosis and as a new target for GC gene therapy.
Abbreviations
HCCR: Human cervical cancer gene; GC: Gastric cancer; EMT: epithelial-mesenchymal transition; HCC: hepatocellular carcinoma; EGF: Epidermal Growth Factor; T: Tumor status; N: Lymph node metastasis; OS: Overall Survival; PCR: Polymerase Chain Reaction; IHC: Immunohistochemistry; WB: Western blot; TMA: Tissue Microarray; HR: Hazard Ratio; OR: Odds Ratio; CI: Confidence Interval; DP1: deleted in polyposis 1; CEA: carcinoembryonic antigen; GAPDH: Glyceraldehyde-3-phosphate dehydrogenase; SD: standard deviation.
Acknowledgements
This work was supported by the National Natural Science Foundation of China (NO.81672409), the China Postdoctoral Science Foundation (2016M590489, 2017T100393), the Postdoctoral Science Foundation of Jiangsu Province (1601101C), Jiangsu Provincial Medical Youth Talent (QNRC2016700), and the Scientific and Technological Innovation and Demonstration Project of Nantong City (MS32016018, MS12017001-6, MS12017007-5 and MS12017008-5), “333 Talent” Cultivating Project of Jiangsu Province (BRA2018394).
Competing Interests
The authors have declared that no competing interest exists.
References
1. Torre LA, Bray F, Siegel RL, Ferlay J, Lortet-Tieulent J, Jemal A. Global cancer statistics, 2012. CA Cancer J Clin. 2015;65:87-108
2. Siegel RL, Miller KD, Jemal A. Cancer Statistics, 2017. CA Cancer J Clin. 2017;67:7-30
3. Ilson DH. Angiogenesis in gastric cancer: hitting the target? Lancet. 2014;383:4-6
4. Chen BJ, Zeng S, Xie R, Hu CJ, Wang SM, Wu YY, Xiao YF, Yang SM. hTERT promotes gastric intestinal metaplasia by upregulating CDX2 via NF-kappaB signaling pathway. Oncotarget. 2017;8:26969-26978
5. Lv LX, Zhou ZX, Zhou Z, Zhang LJ, Yan R, Zhao Z, Yang LY, Bian XY, Jiang HY, Li YD, Sun YS, Xu QQ, Hu GL, Guan WJ, Li YQ. Hispidin induces autophagic and necrotic death in SGC-7901 gastric cancer cells through lysosomal membrane permeabilization by inhibiting tubulin polymerization. Oncotarget. 2017;8:26992-27006
6. Cancer Genome Atlas Research N. Comprehensive molecular characterization of gastric adenocarcinoma. Nature. 2014;513:202-209
7. Brzozowa M, Michalski M, Harabin-Slowinska M, Wojnicz R. The role of tumour microenvironment in gastric cancer angiogenesis. Prz Gastroenterol. 2014;9:325-328
8. Ko J, Lee YH, Hwang SY, Lee YS, Shin SM, Hwang JH, Kim J, Kim YW, Jang SW, Ryoo ZY, Kim IK, Namkoong SE, Kim JW. Identification and differential expression of novel human cervical cancer oncogene HCCR-2 in human cancers and its involvement in p53 stabilization. Oncogene. 2003;22:4679-4689
9. Cho GW, Shin SM, Namkoong H, Kim HK, Ha SA, Hur SY, Kim TE, Chai YG, Kim JW. The phosphatidylinositol 3-kinase/Akt pathway regulates the HCCR-1 oncogene expression. Gene. 2006;384:18-26
10. Xu Z, Zhang Y, Jiang J, Yang Y, Shi R, Hao B, Zhang Z, Huang Z, Kim JW, Zhang G. Epidermal growth factor induces HCCR expression via PI3K/Akt/mTOR signaling in PANC-1 pancreatic cancer cells. BMC Cancer. 2010;10:161
11. Shin SM, Chung YJ, Oh ST, Jeon HM, Hwang LJ, Namkoong H, Kim HK, Cho GW, Hur SY, Kim TE, Lee YS, Park YG, Ko J, Kim JW. HCCR-1-interacting molecule "deleted in polyposis 1" plays a tumor-suppressor role in colon carcinogenesis. Gastroenterology. 2006;130:2074-2086
12. Ha SA, Kim HK, Yoo J, Kim S, Shin SM, Lee YS, Hur SY, Kim YW, Kim TE, Chung YJ, Jeun SS, Kim DW, Park YG, Kim J, Shin SY, Lee YH, Kim JW. Transdifferentiation-inducing HCCR-1 oncogene. BMC Cell Biol. 2010;11:49
13. Jirun P, Zhang G, Kim HK, Ha SA, Zhongtian J, Shishi Q, Zhuqingqing C, Lei G, Yoo J, Kim S, Park YG, Wang J, Yang Y, Xu Z, Huang Z, Lee YK, Song EY, Kim JW. Clinical utility of alpha fetoprotein and HCCR-1, alone or in combination, in patients with chronic hepatitis, liver cirrhosis and hepatocellular carcinoma. Dis Markers. 2011;30:307-315
14. Liu Y, Li K, Ren Z, Li S, Zhang H, Fan Q. Clinical implication of elevated human cervical cancer oncogene-1 expression in esophageal squamous cell carcinoma. J Histochem Cytochem. 2012;60:512-520
15. Meng K, Yuan M, Xu S, Wang L, Li Z, Wang M, Ma R. Human cervical cancer oncogene-1 over expression in colon cancer and its clinical significance. Int J Clin Exp Med. 2015;8:939-943
16. Zhang G, Ha SA, Kim HK, Yoo J, Kim S, Lee YS, Hur SY, Kim YW, Kim TE, Park YG, Wang J, Yang Y, Xu Z, Song EY, Huang Z, Jirun P, Zhongtian J, Shishi Q, Zhuqingqing C, Lei G, Kim JW. Combined analysis of AFP and HCCR-1 as an useful serological marker for small hepatocellular carcinoma: a prospective cohort study. Dis Markers. 2012;32:265-271
17. Ha SA, Lee YS, Shin SM, Kim HK, Kim S, Namkoong H, Kim HJ, Jung SM, Lee YS, Chung YJ, Jung SS, Kim JW. Oncoprotein HCCR-1 expression in breast cancer is well correlated with known breast cancer prognostic factors including the HER2 overexpression, p53 mutation, and ER/PR status. BMC Cancer. 2009;9:51
18. Xue WJ, Li C, Zhou XJ, Guan HG, Qin L, Li P, Wang ZW, Qian HX. RASSF1A expression inhibits the growth of hepatocellular carcinoma from Qidong County. J Gastroenterol Hepatol. 2008;23:1448-1458
19. Mei H, Lian S, Zhang S, Wang W, Mao Q, Wang H. High expression of ROR2 in cancer cell correlates with unfavorable prognosis in colorectal cancer. Biochem Biophys Res Commun. 2014;453:703-709
20. Yoon SK, Lim NK, Ha SA, Park YG, Choi JY, Chung KW, Sun HS, Choi MJ, Chung J, Wands JR, Kim JW. The human cervical cancer oncogene protein is a biomarker for human hepatocellular carcinoma. Cancer Res. 2004;64:5434-5441
21. Qiao SS, Cui ZQ, Gong L, Han H, Chen PC, Guo LM, Yu X, Wei YH, Ha SA, Kim JW, Jin ZT, Li S, Peng JR, Leng XS. Simultaneous measurements of serum AFP, GPC-3 and HCCR for diagnosing hepatocellular carcinoma. Hepatogastroenterology. 2011;58:1718-1724
22. Jung SS, Park HS, Lee IJ, Namkoong H, Shin SM, Cho GW, Ha SA, Park YG, Lee YS, Ko J, Kim JW. The HCCR oncoprotein as a biomarker for human breast cancer. Clin Cancer Res. 2005;11:7700-7708
23. Schlessinger J. Cell signaling by receptor tyrosine kinases. Cell. 2000;103:211-225
24. McCubrey JA, Steelman LS, Chappell WH, Abrams SL, Wong EW, Chang F, Lehmann B, Terrian DM, Milella M, Tafuri A, Stivala F, Libra M, Basecke J, Evangelisti C, Martelli AM, Franklin RA. Roles of the Raf/MEK/ERK pathway in cell growth, malignant transformation and drug resistance. Biochim Biophys Acta. 2007;1773:1263-1284
25. De Luca A, Carotenuto A, Rachiglio A, Gallo M, Maiello MR, Aldinucci D, Pinto A, Normanno N. The role of the EGFR signaling in tumor microenvironment. J Cell Physiol. 2008;214:559-567
26. Caraglia M, Marra M, Meo G, Addeo SR, Tagliaferri P, Budillon A. EGF-R small inhibitors and anti-EGF-R antibodies: advantages and limits of a new avenue in anticancer therapy. Recent Pat Anticancer Drug Discov. 2006;1:209-222
27. Filipe MI, Osborn M, Linehan J, Sanidas E, Brito MJ, Jankowski J. Expression of transforming growth factor alpha, epidermal growth factor receptor and epidermal growth factor in precursor lesions to gastric carcinoma. Br J Cancer. 1995;71:30-36
Author contact
![]() Corresponding authors: Wan-Jiang Xue, Department of Gastrointestinal Surgery (1), The Affiliated Hospital of Nantong University; 20 Xisi Street; Nantong 226001, Jiangsu, China; Tel.: +86-513-81161122; E-mail: xuewanjiangedu.cn. Qin-Sheng Mao, Department of Gastrointestinal Surgery (1), The Affiliated Hospital of Nantong University; 20 Xisi Street; Nantong 226001, Jiangsu, China; Tel.: +86-513-81161126; E-mail: maoqshcom.
Corresponding authors: Wan-Jiang Xue, Department of Gastrointestinal Surgery (1), The Affiliated Hospital of Nantong University; 20 Xisi Street; Nantong 226001, Jiangsu, China; Tel.: +86-513-81161122; E-mail: xuewanjiangedu.cn. Qin-Sheng Mao, Department of Gastrointestinal Surgery (1), The Affiliated Hospital of Nantong University; 20 Xisi Street; Nantong 226001, Jiangsu, China; Tel.: +86-513-81161126; E-mail: maoqshcom.