Impact Factor ISSN: 1837-9664

 Global reach, higher impact
J Cancer 2019; 10(16):3860-3870. doi:10.7150/jca.31291 This issue Cite
Research Paper
Upregulation of nucleoprotein AHNAK is associated with poor outcome of pancreatic ductal adenocarcinoma prognosis via mediating epithelial-mesenchymal transition
Zhiwen Zhang, Xiaoding Liu, Rui Huang, Xuguang Liu, Zhiyong Liang ![]() , Tonghua Liu
, Tonghua Liu ![]()
Department of Pathology, Peking Union Medical College Hospital, Chinese Academy of Medical Sciences and Peking Union Medical College, Beijing, 100730, China.
Received 2018-11-6; Accepted 2019-5-5; Published 2019-6-10
Abstract
The nucleoprotein AHNAK (AHNAK) is a large scaffold protein that is involved in several biological processes. Previous studies have suggested a possible relation between AHNAK and the epithelial-mesenchymal transition (EMT). However, the role of AHNAK in pancreatic ductal adenocarcinoma (PDAC) has not been unveiled. The present study focuses on identifying the potential value of the biological effects of AHNAK in PDAC, which is one of the most lethal malignancies. Bioinformatic analysis was carried for driver gene prediction, and we proved that AHNAK was a driver gene of pancreatic adenocarcinoma and a predictor of poor outcomes of PDAC by clinical characteristics analysis and in vitro experiments. High AHNAK expression was associated with short disease-free survival and poor overall survival. In vitro assays showed that AHNAK was associated with cell proliferation and migration, and a positive relation was observed between AHNAK and the EMT. In conclusion, AHNAK is a crucial biomarker that may promote cellular proliferation and migration and thus impact PDAC outcomes via the EMT, which suggests that AHANK might be a potential target for PDAC.
Keywords: Pancreatic ductal adenocarcinoma, nucleoprotein AHNAK, prognosis, epithelial mesenchymal transition
Introduction
The outcomes of patients with pancreatic carcinoma (PC) remains poor, and diagnosis and treatment have not improved in past decades [1]. With the development of new technologies, the whole genomes of several cancers have been sequenced, including pancreatic ductal adenocarcinoma (PDAC) [2]. However, the functions of most gene alterations have not been validated. Doctors and scientists have focused on genomic data to seek new targets for PDAC treatment.
The nucleoprotein AHNAK (AHNAK) is a large structural scaffold protein that plays a role in diverse biological processes, including the blood-brain barrier, cell junction and migration [3].AHANK was one member of the AHNAK family, with a paralog member of AHNAK2, which has been proved as an prognostic biomarker in PDAC and renal clear cell carcinoma [4, 5]. Several studies have concentrated on the function of AHNAK in diverse cancer types, including melanoma, triple-negative breast cancer, and mesothelioma [6-8]. However, few studies have focused on AHNAK in PDAC, and validation of the expression and function of AHNAK has not been reported. Thus, the present study investigated the role of AHNAK in PDAC progression and its related molecular mechanism.
Materials and methods
Bioinformatic analysis
The driver genes were predicted, and a cloud map was generated using the IntOGen website (http://www.IntOGen.org) [9, 10]. One hundred seventy-eight PDAC cases were downloaded from the cBioPortal for The Cancer Genome Atlas (TCGA) database (http://www.cbioportal.org) [11, 12], including clinical data and genome alterations detected by whole exon sequencing (WES). The genome data included mRNA expression z-scores (RNA-seq V2 RSEM). Twenty two paired samples were selected from the Gene Expression Omnibus (GEO, http://www.ncbi.nlm.nih.gov/geo/, GSE41368, GSE16515) [13, 14] that included AHNAK, KRAS and SMAD4 mRNA expression data, among others. Nineteen (10 tumors and 9 adjacent tissues) Immunohistochemical staining images of AHNAK in PDAC samples were acquired from the Human Protein Atlas website (http://www.proteinatlas.org) [15], and the protein expression levels were calculated using the Image-Pro Plus software (version 6.0; Media Cybernetics, lnc). Biological processes and signaling pathways in the PDAC samples were analyzed using Gene Set Enrichment Analysis (GSEA version 2.2, http://www.broad.mit.edu/gsea/) [16] to calculate the gene set enrichment score (ES).
Collection of PDAC cases
To prove the prediction by bioinformatic analysis, 66 PDAC cases were selected from the Pathology Department archive at Peking Union Medical College Hospital for immunohistochemical staining and statistical analysis. The inclusion criteria were 1) pathological diagnosis was pancreatic ductal adenocarcinoma; 2) the clinical and follow-up was available, and 3) tumor specimens and adjacent specimens of each case could be explicit via microscopic examination. The patients with other pancreatic disorder or subtypes of pancreatic cancer, or without clinical and pathological information, or loss to follow-up were excluded. This study was approved by the ethics committee of Peking Union Medical College Hospital, and all patients signed a written informed consent form when admitted to the hospital in accordance with Declaration of Helsinki.
Immunohistochemistry array
The PDAC slides were deparaffinized, rehydrated and subjected to the EnVision two-step method. After antigen retrieval with citrate buffer (pH 6.0), the slides were blocked with 3% hydrogen peroxide (Dako, Glostrup, Denmark) for 10 min and incubated with an AHNAK mouse monoclonal antibody (product code: ab68556; Abcam, Cambridge, UK) at 4°C overnight. The next day, the slides were incubated with anti-mouse HRP-IgG (product number: 7076S; CST, Danvers, USA) and washed with phosphate-buffered saline. Diaminobenzidine (DAB) was used for the chromogenic reaction.
The number of positive cells and the staining intensity of each specimen were interpreted by two pathology experts. The strong and intermediated staining in plasma was considered as positive while weak staining and no-staining was negative. The positive cells were observed under 400× magnification, and the percentage of positive cells was recorded as follows: 0-25%, 0; 25%-50%, 1; 51%-75%, 2; and >75%, 3. Levels 0 and 1 were considered low expression, and levels 2 and 3 were considered high expression.
Cell culture
Human pancreatic adenocarcinoma cell lines (PANC-1. MIA PaCa-2 and AsPC-1) and were acquired from the Cell Resource Centre of Peking Union Medical College (Beijing, China). Pancreatic duct normal cell lines (hTERT-HPNE) were purchased from American Type Culture Collection (ATCC). PANC-1 and MIA Paca-2 were cultivated in Dulbecco's modified Eagle's medium (DMEM, Cell Resource Centre of Peking Union Medical College, Beijing, China), while AsPC-1 was in RPMI-1640 (Cell Resource Centre of Peking Union Medical College, Beijing, China), and both cell lines were supplemented with 10% fetal bovine serum (FBS; product number: 35-010-CV; Corning, NY, USA) and penicillin and streptomycin (100 U/ml; catalogue number: 10378-016; Thermo Fisher Scientific, San Jose, USA) in 75-cm2 flasks in a 37°C incubator with 5% CO2. hTERT-HPNE was cultivated in 75% DMEM without glucose (Sigma Cat#. D-5030 with additional 2 mM L-glutamine and 1.5 g/L sodium bicarbonate) and 25% Medium M3 Base (Incell Corp. Cat# M300F- 500), with a supplementary of 5% FBS, 15 ng/ml human recombinant EGF, 5.5mM D-glucose (1g/L) and 2μg/ml puromycin. The cells were passaged into 3 flasks when adherent cells accounted for 75% of the total area. Recombinant p53 protein was purchased from Origene (Catalog: TP710022) and Cell culture experiments were used to verify the predictions.
RNA interference
The RNA oligo was synthesized from GenePharma Ltd. (Shanghai, China). The siRNA sequence of AHNAK was 5'-GUGCCACCAUCUACUUUGATT-3' (sense) and 5'-UCAAAGUAGAUGGUGGCACTT-3' (antisense), the sequence of negative control was 5'-UUCUCCGAACGUGUCACGUTT-3' (sense) and 5'-ACGUGACACGUUCGGAGAATT-3' (antisense). AHNAK mRNA interference was induced following the Lipofectamine RNAiMAX protocol (Invitrogen, Carlsbad, CA, USA). Briefly, 15 μl of RNAiMAX and 5 μl of siRNA were diluted with 250 μl of Opti-MEM and then mixed prior to transfection. The final siRNA concentration used for transfection was 100 μmol/l. The cells were harvested for RNA interference and in vitro assays after 48 h of incubation. The siRNA efficiency was verified by quantitative real-time PCR.
Quantitative real-time polymerase chain reaction (qRT-PCR)
The mRNA expression levels of AHNAK and other markers in PDAC cells with AHNAK knockdown or negative controls were analyzed by qPCR. Total RNA was extracted by TRIzoL reagent (Catalog Numbers: 15596026 Invitrogen, Carlsbad, CA, USA) following the protocol and quantification by microplate reader (Epoch2, BioTek lnc, Whinooski, VT, USA). The 260/280 ratio ranged from 1.8 to 2.0 was required. Reverse transcription was carried out following the protocol of High Capacity cDNA Reverse Transcription Kit (PN number: 4368813, Life Technology, Foster City, CA, USA) and acquired cDNA was used for PCR after quantification. The primer sequences are listed in Supplementary Table 1. The PCR procedure was performed using the 7500 FAST Real-Time PCR system (Life Technology, Foster City, CA, USA) with the following protocol: 95°C for 20 s; 40 cycles of 95°C for 3 s and 60°C for 30 s; one cycle of 95°C for 15 s; and one dissociation cycle of 60°C for 60 s, 95°C for 15 s and 60°C for 15 s. Relative quantitation (ΔΔCt) of the expression of PDAC markers was calculated using the 7500 software (version 2.3, Life Technology, Foster City, CA, USA).
Western Blot analysis
PDAC cells were lysed by RIPA (BioRuYee, Beijing, China) with protease inhibitors on ice for half an hour, then centrifuged at 12,000g and collected the precipitation to acquire the total protein. After quantification, twenty micrograms of each sample were resolved on 8% sodium dodecyl sulphate-polyacrylamide gel by electrophoresis (BIO-RAD, California, USA). As the protein was large, constant 80 voltage was needed during the electrophoresis for more than 2h. Then the samples were transferred to nitrocellulose membranes with a constant voltage of 20V overnight. Then, the membranes with proteins were blocked by bovine serum albumin for 1h. Subsequently, the membrane was incubated by primary antibody (AHNAK: 1:500 product code: ab68556; Abcam, Cambridge, UK; EMT markers: lot. No. 9782T, Cell Signaling Technology, Danvers, MA, USA; TP53: 1:2000; lot. No. 2524S, Cell Signaling Technology, Danvers, MA, USA; Phospho-p53(Ser33): 1:500; lot. No. 2526S, Cell Signaling Technology, Danvers, MA, USA; AKT: 1:1000; lot. No. 4691S, Cell Signaling Technology, Danvers, MA, USA; Phospho-AKT (Ser473): 1:1500; lot. No. 4060S, Cell Signaling Technology, Danvers, MA, USA; ERK: 1:2000; lot. No. 4695S, Cell Signaling Technology, Danvers, MA, USA; Phospho-ERK(Thr202/Tyr204): 1:500; lot. No. 4370S, Cell Signaling Technology, Danvers, MA, USA;) overnight at 4°C and incubated by secondary antibody for 1h at room temperature. The protein-antibody compounds were detected by Immobilon Western chemiluminescent HRP Substrate (Millipore, Billerica, USA) and the images were developed by Chemidoc Touch Image System (BIO-RAD, California, USA).
Immunofluorescence
PANC-1 cells were fixed by formalin and membrane was permeated by PBS with 0.1% Triton-X for 10 minutes. Then the cells were blocked by 10% goat serum for 30 minutes. The blocked cells were incubated by primary antibody (AHNAK: 1:500 product code: ab68556; Abcam, Cambridge, UK) for one hour and reacted by fluorescein-conjugated IgG antibody (cat number: ZF-0311, Zhongshan Golden Bridge, Beijing, China) for one hour. The cells were mounted by mounting medium with DAPI (cat number: ZLI-9557, Zhongshan Golden Bridge, Beijing, China).
Colony formation assay
Both PANC-1 and AsPC-1 cells (3×10² cells) with and without RNA interference were seeded into 6-well plates and incubated in a humid atmosphere with 5% CO2 at 37°C for 14 days. After incubation, the cell colonies were dyed by crystal violet and recorded and counted for comparison.
Wound healing experiment
RNA interference and control PDAC cells were cultured in a wounding healing matrix (lot number: 80206; Ibidi, Germany) in 2-well plates coated with silicone for 24 h. Then, the silicone was lifted from the matrix, and the distance between the two groups of cells was recorded. The matrix containing cells was incubated for an additional 24 h, and the distance was recorded a second time for comparison.
Transwell assay
RNA interference and control PDAC cells were cultured in a Transwell chamber with an 8.0-μm pore size (Corning, NY, USA) in a 24-well plate at 37°C in 5% CO2 for 8 h. The chambers containing cells were removed to allow collection of the polycarbonate membranes. The membranes were stained with crystal violet (BioRuYee, Beijing, China) to observe cell migration.
Cell counting kit-8 assay (CCK-8)
The CCK-8 reagent (Dojindo, Toyko, Japan) was added to 96-well plates containing RNA interference or control PDAC cells. The absorbance was detected by a spectrophotometer, and the OD values at 0 h, 24 h, 48 h, and 72 h were recorded to generate proliferation curves for comparison between the interfered and negative control cells.
Statistical analysis
All data were analyzed with the SPSS (version 20.0; SPSS Inc., Chicago, IL, USA) and GraphPad software (version 7.0; GraphPad Software Inc., San Diego, CA, USA). A two-tailed independent sample t test was performed to analyze the mRNA expression, protein expression and in vitro assay data. Clinical characteristics were compared using the Chi-square test or Fisher's exact test. The survival status was evaluated using Kaplan-Meier and multivariate Cox regression analyses. P≤0.05 was considered significant.
Results
AHNAK is predicted to be a driver gene and associated with poor prognosis in PDAC、
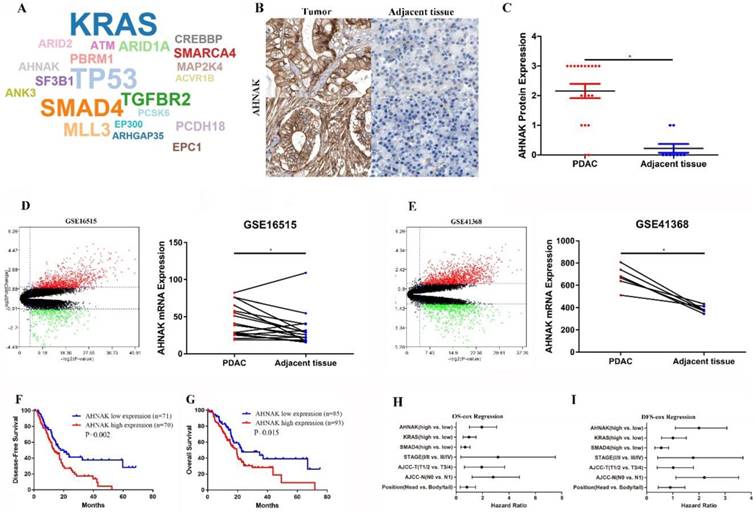
Twenty-one driver genes were predicted from the IntOGen website, including AHNAK, KRAS, TP53 and SMAD4 (Figure 1A). Twenty-eight immunohistochemistry graphs were downloaded from the Human Protein Atlas database for comparison of AHNAK protein expression levels (Figure 1B and C). Twenty-two PDAC tissue pairs from the GEO database (GSE41368, GSE16515) were selected for comparison of AHNAK mRNA expression between PDAC and adjacent non-tumor tissues (Figure 1D and E). Both the AHNAK mRNA and protein expression levels were significantly upregulated in the PDAC tumor tissues. Then, a prognostic analysis was performed using Kaplan-Meier and cox Regression analyses, and a survival curve was generated to observe the distinctions. PDAC information from TCGA data and the Kaplan-Meier results showed that high AHNAK expression predicted short disease-free survival (DFS) and poor overall survival (OS) (P=0.002, and P=0.015, respectively), suggesting that PDAC patients with relatively low AHNAK expression tended to have longer survival and better outcomes (Figure 1F, G). After adjustment in the univariate analysis, a multivariate Cox regression analysis was performed. AHNAK was independent prognostic factors of DFS in PDAC patients (P=0.019), but AHNAK was not an independent prognostic predictor of OS (P=0.142) (Figure 1H and I). These results revealed that AHNAK was an important biomarker in PDAC and suggested a poor clinical outcome.
AHNAK was predicted to be a driver gene in PDAC. A: AHNAK was predicted as a driver gene in PDAC as analyzed using the IntOGen website. B and C: Nineteen images of PDAC and adjacent non-tumor tissues were downloaded from the Protein Atlas database, which showed high AHNAK protein expression in PDAC compared to adjacent non-tumor tissues. D and E: Twenty-two pairs of PDAC sequencing data were downloaded from the GEO database, which showed upregulated AHNAK mRNA expression in PDAC. F and G: PDAC data were downloaded from TCGA database. The Kaplan-Meier analysis showed that high AHNAK expression was associated with shortened DFS and poor OS. H and I: multivariate analysis showed that AHNAK and the AJCC N stage were independent prognostic predictors of DFS, but not an independent prognostic predictor of OS in PDAC.
Upregulation of AHNAK is verified in PDAC
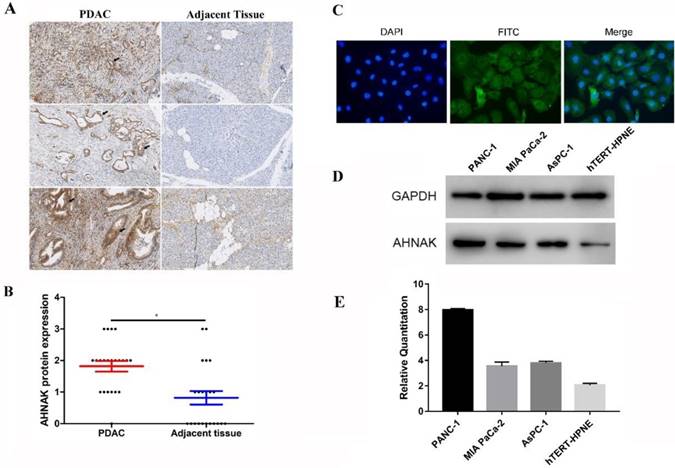
We selected 66 PDAC formalin-fixed paraffin embedded (FFPE) specimens to verify the expression and prognostic prediction. We performed immunohistochemical staining to detect AHNAK expression in PDAC and adjacent non-tumor tissues (Figure 2A). Immunohistochemical staining showed relatively higher AHNAK expression in the PDAC tissues than in the adjacent non-tumor tissues (Figure 2B). Immunofluorescence showed AHNAK was mainly expressed in cytoplasm of PANC-1 cells (Figure 2C). Then, we identified AHNAK expression in both a PDAC cell lines (PANC-1, MIA PaCa-2, and AsPC-1) and normal pancreatic ductal cell line (HPNE). The qPCR and western blotting results also showed that AHNAK was highly expressed in the PANC-1 cell line (Figure 2D, E), which was consistent with the predicted results from the GEO databases that AHNAK was upregulated in PDAC. These results suggested that AHNAK was upregulated in PDAC.
Upregulation of AHNAK was discovered in PDAC and PDAC cell lines. A and B: Sixty-six PDAC specimens were collected and subjected to immunohistochemical staining, which showed higher AHNAK protein expression in PDAC than in adjacent non-tumor tissues. C and D: AHNAK expression was measured in three pancreatic ductal adenocarcinoma cells(PANC-1, Mia PaCa-2 and AsPC-1) and Pancreatic ductal normal cells (hTERT-HPNE). The PANC-1 cells had higher AHNAK mRNA and protein expression levels as detected by qPCR and western blotting analyses.
High AHNAK expression indicates a poor prognosis for PDAC
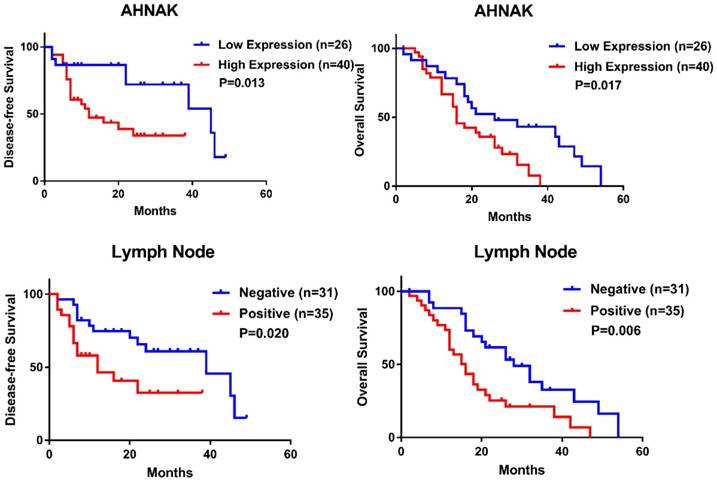
The relationships between AHNAK expression and clinical characteristics and between AHNAK expression and the prognosis were investigated. We selected 66 PDAC specimens to confirm the relation, but the present data suggested that no characteristic was associated with AHNAK expression (Table 1). We also performed prognostic predictions and found that high AHNAK expression was significantly associated with shortened DFS and poor OS (P=0.013 and 0.017, respectively, Figure 3A, B, Table 2). Lymph node invasion was also related to worse DFS and OS (P=0.020 and 0.006, respectively, Figure 3C, D, Table 2). The cox Regression analysis also showed that high AHNAK expression was an independent prognostic predictor of PDAC, as well as lymph node invasion (Table 2). High AHNAK expression and lymph node invasion suggested worse DFS (P=0.031 and 0.025, respectively) and dismal OS (P=0.004 and 0.006, respectively). These results verified that AHNAK was a crucial biomarker for PDAC patients and was associated with patient outcomes.
Relationship between AHNAK expression and clinical characteristics of PDAC
| Characteristics | Total | low AHNAK | high AHNAK | P value |
|---|---|---|---|---|
| Age | 66 | 0.937 | ||
| < 65 | 41 | 16 | 25 | |
| ≥ 65 | 25 | 10 | 15 | |
| Gender | 66 | 0.584 | ||
| Male | 34 | 14 | 20 | |
| Female | 32 | 12 | 20 | |
| Clinical stage | 66 | 0.532 | ||
| Stage 1/2 | 62 | 25 | 37 | |
| Stage 3/4 | 4 | 1 | 3 | |
| Smoking status | 66 | 0.974 | ||
| Yes | 23 | 9 | 14 | |
| No | 46 | 17 | 26 | |
| Position | 66 | 0.159 | ||
| Head | 35 | 11 | 24 | |
| Body/Tail | 31 | 15 | 16 | |
| Bile invasion | 66 | 0.775 | ||
| Yes | 24 | 10 | 14 | |
| No | 42 | 16 | 26 | |
| LN invasion | 66 | 0.541 | ||
| Yes | 35 | 15 | 20 | |
| No | 31 | 11 | 20 | |
| AJCC T stage | 66 | 0.826 | ||
| T1/2 | 3 | 1 | 2 | |
| T3/4 | 63 | 25 | 38 | |
| AJCC N stage | 66 | 0.585 | ||
| N0 | 34 | 15 | 19 | |
| N1 | 32 | 12 | 20 | |
| AJCC M stage | 66 | 0.127 | ||
| M0 | 62 | 26 | 36 | |
| M1 | 4 | 0 | 4 |
AJCC: American Joint Committee on Cancer; LN: Lymph Node.
High expression of AHNAK indicates poor clinical outcome of PDAC. High AHNAK expression was associated with shortened DFS (P=0.013) (A) and poor OS (P=0.017) (B) in PDAC, with significant difference. Invasion of lymph node also suggested poor outcome of PDAC (P=0.020 of DFS, and P=0.006 of OS, respectively) (C and D) with statistically significance.
Univariate and multivariate cox regression analysis in PDAC
| Characteristics | Disease-Free Survival | Overall Survival | ||
|---|---|---|---|---|
| Univariate | Multivariate | Univariate | Multivariate | |
| Age (>65 vs. ≤65) | 0.833 | 0.628 | ||
| Gender (Male vs. Female) | 0.592 | 0.359 | ||
| Clinical stage (Stage 1/2 vs. 3/4) | 0.071 | 0.261 | 0.579 | |
| Smoking status (Yes vs. No) | 0.296 | 0.508 | ||
| Position (Head vs. Body/Tail) | 0.937 | 0.239 | ||
| Bile duct invasion (Yes vs. No) | 0.158 | 0.096 | 0.053 | |
| LN Invasion (Yes vs. No) | 0.020 | 0.025 | 0.006 | 0.006 |
| AJCC T stage (T1/2 vs. T3/4) | 0.462 | 0.512 | ||
| AJCC N stage (N0 vs. N1) | 0.153 | 0.370 | ||
| AJCC M stage (M0 vs. M1) | 0.071 | 0.195 | ||
| AHNAK (high vs. low) | 0.013 | 0.031 | 0.017 | 0.004 |
AJCC: American Joint Committee on Cancer; LN, Lymph Node.
Downregulation of AHNAK inhibits PDAC cell proliferation and migration
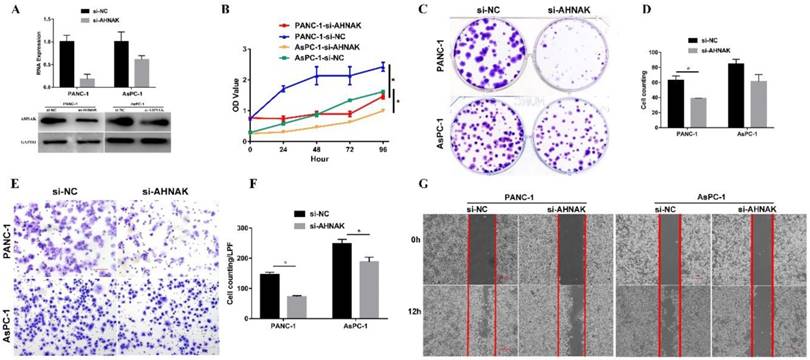
AHNAK interference was confirmed by the qPCR and western blotting analysis (Figure 4A). CCK-8 and colony formation assays were performed to measure cellular proliferation. The proliferative ability of PDAC cells with AHNAK interference was significantly decreased compared to that of the negative control cells (Figure 4B, C, and D). In addition, cell migration was examined using a Transwell assay and wound healing experiment (Figure 4E, F and G). A significant decrease in the cellular migration of PDAC cells was observed after AHNAK was suppressed. These results indicated that AHNAK might promote PDAC cell proliferation and migration to accelerate the progression of PDAC, thereby contributing to the poor outcomes of PDAC patients.
Downregulation of AHNAK inhibits PDAC cell proliferation and migration. A: AHNAK mRNA expression was suppressed by siRNA. Both qPCR and western blotting analyses showed downregulation of AHNAK in PANC-1 and AsPC-1 cells. B: The CCK-8 assay showed that AHNAK deficiency dramatically inhibited the proliferative ability of PDAC cells. C and D: The colony plating assays also suggested AHNAK knockdown inhibited the proliferation of PDAC cells, with statistical significance in PANC-1. E and F: Transwell assays showed a reduction of the migration ability in PDAC cells once the AHNAK was inhibited, with statistical significance. G: The wound healing also suggested AHNAK deficiency might inhibit cellular migration in PDAC cells. OD, Optical density; LPF, Low power field; NC, Negative control.
AHNAK mediates the epithelial-mesenchymal transition to promote proliferation and migration via TP53 signaling pathway
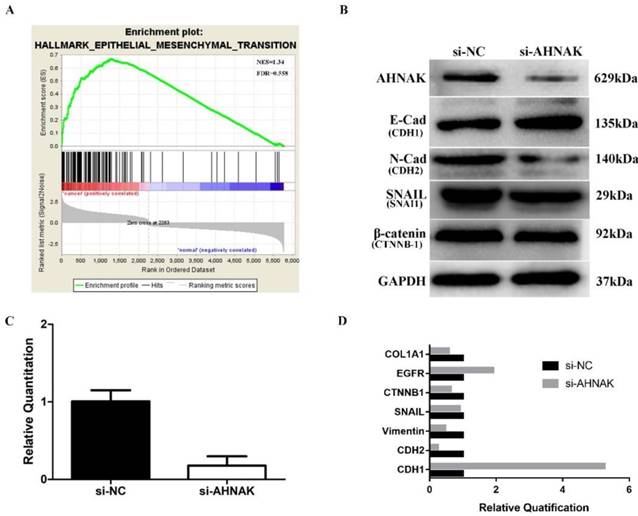
To uncover the mechanism by which AHNAK mediated PDAC cellular proliferation and migration, we performed GSEA analysis to investigate cancer-related biological processes. The results suggested that the majority of epithelial-mesenchymal transition (EMT) markers were upregulated (NES=1.34, FDR=0.558; Figure 5A). We selected PANC-1 cells to search for relevant cellular mechanism as the cells had an abundant AHNAK expression. After siRNA interference, the AHNAK expression level was downregulated in the PANC-1 cells by approximately 70%-90% as verified by qPCR and western blotting (Figure 5B, C). The RNA and protein expression levels of EMT-related markers, including E-cadherin, EGFR, N-cadherin, SNAIL, β-catenin, and Collagen Ⅰ, were assessed in PANC-1 cells with and without AHNAK interference (Figure 5B, D). AHNAK-deficient PANC-1 cells had upregulated epithelial markers, such as CDH-1 and EGFR, but downregulated mesenchymal markers, including CDH-2 and COL1A1 (Figure 5B, D). Moreover, AHNAK showed no obvious relationship with SNAI1 and CTNNB-1 (Figure 5B, D). These results suggested that the PANC-1 cells transformed from a quasi-mesenchymal to an epithelial status after AHNAK was suppressed. Because a quasi-mesenchymal status suggests relative invasive behavior, AHNAK may promote PDAC cell proliferation and migration via the EMT to influence PDAC patient outcomes.
AHNAK mediates the EMT to promote PDAC cell proliferation and migration via TP53 signaling pathway. A: GSEA was carried out in the paired PDAC samples in GEO database. It showed that most biomarkers were involved in the EMT phenotype. B: Western blotting analysis showed that AHNAK suppression caused an increase in E-cadherin but a decrease in N-cadherin. C and D: The qPCR results showed the alteration of gene expression in EMT phenotype after knockdown of AHNAK.
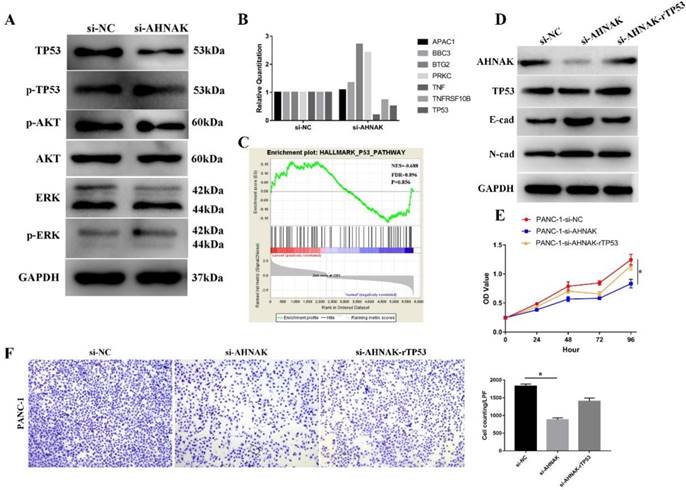
Then we searched relative signaling pathway that involved in the procedure and found that expression of TP53 was influenced while others, including AKT, ERK, were not changed (Figure 6A). Then we detected the alteration of TP53 signaling pathway in PANC-1 cell line. GSEA showed an alteration in TP53 signaling pathway (NES=0.688, FDR=0.896), suggesting TP53 signaling pathway was downregulated in PDAC and our qPCR and Western blot analysis also suggested that TP53 was downregulated in AHNAK knockdown cells (Figure 6B). To verify the relationship between EMT and TP53 signaling pathway, we added the recombinant p53 into AHNAK knockdown cells. The results showed that E-cad was downregulated while N-cad showed no alteration in western blot analysis (Figure 6D). Cellular function assays also showed an upregulation in cellular proliferation and migration (Figure 6E, F). These suggested that the EMT phenotype might be mediated by TP53 signaling pathway.
AHNAK mediates the EMT via TP53 signaling pathway. A: Western blot analysis showed that after knockdown of AHNAK, only expression of TP53 was altered, while other markers, including AKT and ERK. The phosphorylated level of TP53, AKT and ERK also showed no alterations. B: qRT-PCR showed the alteration of markers in TP53 signaling pathway. C: GSEA suggested an enrichment of TP53 signaling pathway in PDAC by analyzing the GEO database. D: Western blot showed after the recombinant TP53 protein was added into the AHNAK deficiency cell lines, E-cad, the epithelial markers of EMT phenotype was restored. E and F: CCK-8 and Transwell assays showed that recombinant TP53 could restore cellular proliferation and migration.
Discussions
PC is a highly lethal malignancy in the pancreas due to its high mortality and short survival. New epidemiological evidence has shown that no effective therapeutic strategy has been established and that patients with pancreatic neoplasms still suffer [2, 17]. The latest epidemiological investigation in China showed that the survival of PC patients has deteriorated and has not improved in recent decades [1]. Because of the biological characteristics of the pancreas and PDAC, recent treatments are feeble and futile. Thus, new biomarkers of treatment are urgently needed to relieve symptoms and improve survival. The present study predicted new markers for PDAC based on online database and conducted molecular experiments and statistical analyses to elucidate new alterations in PDAC and aid in the development of new potential treatment targets.
The nucleoprotein AHNAK, which is also known as desmoyokin, is a large scaffold protein (629 kDa). Previous studies have shown that AHNAK is a complex protein with a tripartite nature and multiple domains [3]. AHNAK has been reported to be associated with several cellular processes, including cell signaling, cell-cell contact formation [18], calcium ion channel regulation [19, 20], and cellular adherence and migration [21].
We found that AHNAK was highly expressed in PDAC and was an independent prognostic predictor of PDAC. Upregulation of AHNAK was associated with poor outcomes and short DFS in PDAC patients based on analysis of TCGA data. In addition, we compared AHNAK expression and the clinicopathological characteristics of PDAC and showed that high AHNAK expression predicted poor survival. Cox regression indicated that AHNAK was an independent prognostic predictor in PDAC. Previous studies have reported AHNAK expression in several tumors. Caruso discovered higher AHNAK expression in breast cancer cell lines than in normal epithelial cells [22]. Dumitru reported that AHNAK was associated with poor outcomes in laryngeal carcinoma patients [23]. A meta-analysis suggested that AHNAK was upregulated in pancreatic cancer and was associated with cell migration and the EMT [24]. Together, these findings suggested that AHNAK was an important biomarker for the progression and prognosis of tumors.
Because AHNAK suggested a poor outcome, the molecular mechanism of AHNAK that impacted the PDAC outcome was further investigated using the PANC-1 and AsPC-1 cell lines in vitro. Cellular proliferation and migration were both inhibited by AHNAK suppression, suggesting a positive relation between AHNAK and invasive behavior. Some studies have revealed the molecular mechanism of AHNAK in tumor metastasis [25-27]. Shankar reported that AHNAK was assembled in pseudopodia in epithelial cells and that knockdown of AHNAK led to pseudopodia retraction and decreased cell migration [25]. AHNAK has also been shown to predict cell invasion and chemotherapeutic responses [26]. We verified that AHNAK promoted cell migration using wound healing and Transwell assays. In addition, we also proved that AHNAK promoted cell proliferation using colony formation and CCK-8 assays. Lee reported that overexpression of AHNAK prevented cancer proliferation via TGF-β in cervical cancer cells [27]. However, our results showed promotion of cancer cell proliferation in pancreatic cancer cells. These inconsistent results suggested that AHNAK might play diverse roles in different tumorigenic mechanisms.
EMT is a frequently studied biological process that was first identified by Elizabeth Hay in the 1980s [28]. Subsequently, Thiery verified that the EMT could aid in resistance to senescence and apoptosis [29]. Alterations of several EMT biomarkers have been identified, including E-cadherin, EGFR, N-cadherin, Vimentin, and Collagen [30]. Epithelial cells lose their original phenotypes, with a downregulation of epithelial markers (E-cadherin and EGFR) and upregulation of mesenchymal marker (N-cadherin, Vimentin, and Collagen) [30]. Up to now, the EMT is well-known to be a crucial process in multiple tumors and is associated with tumorigenesis and the prognosis. Several studies have reported that AHNAK is involved in the EMT because AHNAK knockdown reduces the EMT phenotype [3, 31-33]. The present study showed that inhibition of AHNAK in PANC-1 cells altered the expression of EMT-related biomarkers in the progression of PDAC. Previous studies have shown that the EMT occurs frequently in PDAC and is related to PDAC progression and metastasis [34]. Additionally, the EMT has been shown to predict poor outcomes of PDAC patients [34]. The present study verified that the EMT occurred in PDAC using GSEA analysis. The relation between AHNAK and EMT-related markers, including CDH-1, CDH-2, EGFR, CTNNB-1, SNAI1 and COL1A1, was established by assessing mRNA and protein expression in PANC-1 cells. These results showed that AHNAK might be associated with the EMT and that AHNAK suppression reduced the level of the EMT phenotype in PANC-1 cells. Thus, we postulated that AHNAK promoted PDAC cellular proliferation and migration, which impacted PDAC patient survival via mediating the EMT.
TP53 signalling pathway is the most frequent transduction pathway in most cancers. The acknowledged functions of p53 are its impact on cell cycle and apoptosis [35, 36]. Besides functions above, recent studies showed p53 was involved in multiple biological processes via regulating several target genes[35]. In present study, we discovered a possible relation between TP53 and CDH1, which was an evidence that p53 might be involved in EMT. It suggests that not only did TP53 involve in tumorigenesis, but also mediated tumor proliferation and migration. We detected an alteration of TP53 signalling pathway in AHNAK-deficient PANC-1 cells and PANC-1 cells tended to be quasi-mesenchymal phenotype with CDH1 downregulation. After added the recombinant TP53 protein, the AHNAK knockdown PANC-1 cells could restore some EMT phenotype and cellular proliferation and migration. It suggested that TP53 signalling pathway might be involve in EMT in pancreatic adenocarcinoma.
According to the present study, AHNAK is an independent prognostic marker of PDAC patients and mediates the EMT phenotype to promote cellular proliferation and migration in PDAC. Therefore, AHNAK is an important biomarker of PDAC and may be a new therapeutic target for clinical evaluation and treatment.
Abbreviations
AHNAK: Nucleoprotein AHNAK; ATCC: American Type Culture Collection; CDH-1: Cadherin 1; CDH-2: Cadherin 2; COL1A1: Collagen Type I Alpha 1 Chain; CTNNB-1: Catenin Beta 1; DFS: Disease-Free Survival; EGFR: Epidermal Growth Factor Receptor; EMT: Epithelial-Mesenchymal Transition; GEO: Gene Expression Omnibus; GSEA: Gene Set Enrichment Analysis; IPCM: Inverted Phase Contrast Microscope; NES: Normal Enrichment Score; OS: Overall Survival; PC: Pancreatic Carcinoma; PDAC: Pancreatic Ductal Adenocarcinoma; TCGA: The Cancer Genome Atlas; SNAI1: Snail Family Transcriptional Repressor 1; WES: Whole Exon Sequence.
Supplementary Material
Supplementary table.
Acknowledgements
We acknowledge immunohistochemical staining support from Jun-Yi Pang of Peking Union Medical College Hospital, and bioinformatics assistance from Qiang Ma of Peking Union Medical College Hospital.
Authors' Contributions
Z.Z. was responsible for the entire study and manuscript writing. Xiaoding L. contributed to the bioinformatics analyses. R.H. and Xuguang L. contributed to qPCR assays. Z.L. supplied the technical analysis and T.L. conducted the study. All authors were qualified according to the ICMJE criteria for authorship.
Competing Interests
The authors have declared that no competing interest exists.
References
1. Zeng H, Chen W, Zheng R, Zhang S, Ji JS, Zou X. et al. Changing cancer survival in China during 2003-15: a pooled analysis of 17 population-based cancer registries. The Lancet Global Health. 2018;6:e555-e67
2. Miller KD, Siegel RL, Lin CC, Mariotto AB, Kramer JL, Rowland JH. et al. Cancer treatment and survivorship statistics, 2016. CA: a cancer journal for clinicians. 2016;66:271-89
3. Davis TA, Loos B, Engelbrecht AM. AHNAK: the giant jack of all trades. Cellular signalling. 2014;26:2683-93
4. Klett H, Fuellgraf H, Levit-Zerdoun E, Hussung S, Kowar S, Küsters S. et al. Identification and Validation of a Diagnostic and Prognostic Multi-Gene Biomarker Panel for Pancreatic Ductal Adenocarcinoma. Frontiers in Genetics. 2018:9
5. Wang M, Li X, Zhang J, Yang Q, Chen W, Jin W. et al. AHNAK2 is a Novel Prognostic Marker and Oncogenic Protein for Clear Cell Renal Cell Carcinoma. Theranostics. 2017;7:1100-13
6. Chen B, Wang J, Dai D, Zhou Q, Guo X, Tian Z. et al. AHNAK suppresses tumour proliferation and invasion by targeting multiple pathways in triple-negative breast cancer. Journal of experimental & clinical cancer research: CR. 2017;36:65
7. Sheppard HM, Feisst V, Chen J, Print C, Dunbar PR. AHNAK is downregulated in melanoma, predicts poor outcome, and may be required for the expression of functional cadherin-1. Melanoma research. 2016;26:108-16
8. Sudo H, Tsuji AB, Sugyo A, Abe M, Hino O, Saga T. AHNAK is highly expressed and plays a key role in cell migration and invasion in mesothelioma. International journal of oncology. 2014;44:530-8
9. Gonzalez-Perez A, Perez-Llamas C, Deu-Pons J, Tamborero D, Schroeder MP, Jene-Sanz A. et al. IntOGen-mutations identifies cancer drivers across tumor types. Nature methods. 2013;10:1081-2
10. Rubio-Perez C, Tamborero D, Schroeder MP, Antolin AA, Deu-Pons J, Perez-Llamas C. et al. In silico prescription of anticancer drugs to cohorts of 28 tumor types reveals targeting opportunities. Cancer cell. 2015;27:382-96
11. Cerami E, Gao J, Dogrusoz U, Gross BE, Sumer SO, Aksoy BA. et al. The cBio cancer genomics portal: an open platform for exploring multidimensional cancer genomics data. Cancer discovery. 2012;2:401-4
12. Gao J, Aksoy BA, Dogrusoz U, Dresdner G, Gross B, Sumer SO. et al. Integrative analysis of complex cancer genomics and clinical profiles using the cBioPortal. Science signaling. 2013;6:pl1
13. Barrett T, Troup DB, Wilhite SE, Ledoux P, Evangelista C, Kim IF. et al. NCBI GEO: archive for functional genomics data sets-10 years on. Nucleic acids research. 2011;39:D1005-10
14. Barrett T, Wilhite SE, Ledoux P, Evangelista C, Kim IF, Tomashevsky M. et al. NCBI GEO: archive for functional genomics data sets-update. Nucleic acids research. 2013;41:D991-5
15. Uhlen M, Fagerberg L, Hallstrom BM, Lindskog C, Oksvold P, Mardinoglu A. et al. Proteomics. Tissue-based map of the human proteome. Science. 2015;347:1260419
16. Subramanian A, Tamayo P, Mootha VK, Mukherjee S, Ebert BL, Gillette MA. et al. Gene set enrichment analysis: a knowledge-based approach for interpreting genome-wide expression profiles. Proceedings of the National Academy of Sciences of the United States of America. 2005;102:15545-50
17. Siegel RL, Miller KD, Jemal A. Cancer statistics, 2018. CA: a cancer journal for clinicians. 2018;68:7-30
18. Liu Y, Myrvang HK, Dekker LV. Annexin A2 complexes with S100 proteins: structure, function and pharmacological manipulation. Br J Pharmacol. 2015;172:1664-76
19. Hohaus A, Person V, Behlke J, Schaper J, Morano I, Haase H. The carboxyl-terminal region of ahnak provides a link between cardiac L-type Ca2+ channels and the actin-based cytoskeleton. FASEB journal: official publication of the Federation of American Societies for Experimental Biology. 2002;16:1205-16
20. Matza D, Badou A, Jha MK, Willinger T, Antov A, Sanjabi S. et al. Requirement for AHNAK1-mediated calcium signaling during T lymphocyte cytolysis. Proceedings of the National Academy of Sciences of the United States of America. 2009;106:9785-90
21. Jolly C, Winfree S, Hansen B, Steele-Mortimer O. The Annexin A2/p11 complex is required for efficient invasion of Salmonella Typhimurium in epithelial cells. Cellular microbiology. 2014;16:64-77
22. Caruso JA, Stemmer PM. Proteomic profiling of lipid rafts in a human breast cancer model of tumorigenic progression. Clinical & experimental metastasis. 2011;28:529-40
23. Dumitru CA, Bankfalvi A, Gu X, Zeidler R, Brandau S, Lang S. AHNAK and inflammatory markers predict poor survival in laryngeal carcinoma. PloS one. 2013;8:e56420
24. Goonesekere NC, Wang X, Ludwig L, Guda C. A meta analysis of pancreatic microarray datasets yields new targets as cancer genes and biomarkers. PloS one. 2014;9:e93046
25. Shankar J, Messenberg A, Chan J, Underhill TM, Foster LJ, Nabi IR. Pseudopodial actin dynamics control epithelial-mesenchymal transition in metastatic cancer cells. Cancer research. 2010;70:3780-90
26. Hsu YC, Chen HY, Yuan S, Yu SL, Lin CH, Wu G. et al. Genome-wide analysis of three-way interplay among gene expression, cancer cell invasion and anti-cancer compound sensitivity. BMC medicine. 2013;11:106
27. Lee IH, Sohn M, Lim HJ, Yoon S, Oh H, Shin S. et al. Ahnak functions as a tumor suppressor via modulation of TGFbeta/Smad signaling pathway. Oncogene. 2014;33:4675-84
28. Hay ED. An overview of epithelio-mesenchymal transformation. Acta anatomica. 1995;154:8-20
29. Thiery JP, Acloque H, Huang RY, Nieto MA. Epithelial-mesenchymal transitions in development and disease. Cell. 2009;139:871-90
30. Lamouille S, Xu J, Derynck R. Molecular mechanisms of epithelial-mesenchymal transition. Nature reviews Molecular cell biology. 2014;15:178-96
31. Erkan M, Michalski CW, Rieder S, Reiser-Erkan C, Abiatari I, Kolb A. et al. The activated stroma index is a novel and independent prognostic marker in pancreatic ductal adenocarcinoma. Clinical gastroenterology and hepatology: the official clinical practice journal of the American Gastroenterological Association. 2008;6:1155-61
32. Gonzalez DM, Medici D. Signaling mechanisms of the epithelial-mesenchymal transition. Science signaling. 2014;7:re8
33. Keshamouni VG, Michailidis G, Grasso CS, Anthwal S, Strahler JR, Walker A. et al. Differential protein expression profiling by iTRAQ-2DLC-MS/MS of lung cancer cells undergoing epithelial-mesenchymal transition reveals a migratory/invasive phenotype. Journal of proteome research. 2006;5:1143-54
34. Houg DS, Bijlsma MF. The hepatic pre-metastatic niche in pancreatic ductal adenocarcinoma. Molecular cancer. 2018;17:95
35. Kastenhuber ER, Lowe SW. Putting p53 in Context. Cell. 2017;170:1062-78
36. Kastan MB, Onyekwere O, Sidransky D, Vogelstein B, Craig RW. Participation of p53 protein in the cellular response to DNA damage. Cancer research. 1991;51:6304-11
Author contact
![]() Corresponding authors: Zhiyong Liang, Department of Pathology, Research Centre for Molecular Pathology, Peking Union Medical College Hospital, Chinese Academy of Medical Sciences and Peking Union Medical College, NO. 1 Shuaifuyuan of Dongcheng District, Beijing 100730, China; liangzhiyong1220com. Tonghua Liu, Department of Pathology, Research Centre for Molecular Pathology, Peking Union Medical College Hospital, Chinese Academy of Medical Sciences and Peking Union Medical College, NO. 1 Shuaifuyuan of Dongcheng District, Beijing 100730, China; Tonghua_liucom
Corresponding authors: Zhiyong Liang, Department of Pathology, Research Centre for Molecular Pathology, Peking Union Medical College Hospital, Chinese Academy of Medical Sciences and Peking Union Medical College, NO. 1 Shuaifuyuan of Dongcheng District, Beijing 100730, China; liangzhiyong1220com. Tonghua Liu, Department of Pathology, Research Centre for Molecular Pathology, Peking Union Medical College Hospital, Chinese Academy of Medical Sciences and Peking Union Medical College, NO. 1 Shuaifuyuan of Dongcheng District, Beijing 100730, China; Tonghua_liucom