Impact Factor ISSN: 1837-9664

 Global reach, higher impact
J Cancer 2019; 10(17):4123-4131. doi:10.7150/jca.30883 This issue Cite
Research Paper
The Loss of SMAD4/DPC4 Expression Associated with a Strongly Activated Hedgehog Signaling Pathway Predicts Poor Prognosis in Resected Pancreatic Cancer
Jin-Zhi Xu1,2,3,4#, Wen-Quan Wang1,2,3,4 ![]() , Wu-Hu Zhang1,2,3,4#, Hua-Xiang Xu1,2,3,4, He-Li Gao1,2,3,4, Shi-Rong Zhang1,2,3,4, Chun-Tao Wu1,2,3,4, Shuo Li1,2,3,4, Hao Li1,2,3,4, Jin Xu1,2,3,4, Xian-Jun Yu1,2,3,4
, Wu-Hu Zhang1,2,3,4#, Hua-Xiang Xu1,2,3,4, He-Li Gao1,2,3,4, Shi-Rong Zhang1,2,3,4, Chun-Tao Wu1,2,3,4, Shuo Li1,2,3,4, Hao Li1,2,3,4, Jin Xu1,2,3,4, Xian-Jun Yu1,2,3,4 ![]() , Liang Liu1,2,3,4
, Liang Liu1,2,3,4 ![]()
1. Department of Pancreatic Surgery, Fudan University Shanghai Cancer Center, Shanghai, China.
2. Department of Oncology, Shanghai Medical College, Fudan University, Shanghai, China.
3. Shanghai Pancreatic Cancer Institute, Shanghai, China.
4. Pancreatic Cancer Institute, Fudan University, Shanghai, China.
#Jin-Zhi Xu and Wu-Hu Zhang contributed equally to this work.
Received 2018-10-23; Accepted 2019-5-19; Published 2019-7-10
Abstract
Background: Pancreatic ductal adenocarcinoma (PDAC) progression is mediated by mutations in driver genes and a complex stroma that is mainly dependent on the Sonic hedgehog (Shh) signaling pathway. However, the association between driver genes and Shh-pathway proteins and their potential prognostic significance remain unclear.
Methods: We analyzed protein expressions of the KRAS, TP53, SMAD4, and CDKN2A/P16 driver genes and the Shh-pathway molecules, including Shh, glioma-associated oncogene (Gli) 1, Gli2, and smoothened (SMO) by immunohistochemistry using tissue microarrays in 237 patients with resectable PDAC and statistically determined their prognostic significance.
Results: SMAD4lost mutation was associated with shorter survival outcomes [overall survival (OS): Hazard ratio (HR) 1.887, p < 0.001]; recurrence-free survival (RFS): HR 1.886, p < 0.001) and abnormal p53 immunolabeling was associated with poor OS (HR 1.436, p = 0.011) in patients with PDAC. The mutational status of p16 had no effect on patient survival. High levels of SMO and Gli1 expression were associated with poor survival outcomes in both univariate and multivariate analyses. Pearson's χ2 test showed a medium correlation between the SMAD4lost mutation and Shh (R = 0.343) and Gli1 (R = 0.505) expression levels (p < 0.001). Patients with the SMAD4lost mutation and high levels of Shh and Gli1 expression showed the poorest survival outcomes (RFS: HR 2.976; OS: HR 3.598; p < 0.001 for both) compared with other patients in the study.
Conclusion: Loss of SMAD4 associated with a strongly activated Shh pathway resulted in poor survival outcomes in patients with resected PDAC.
Keywords: pancreatic ductal adenocarcinoma, Hedgehog signaling pathway, driver genes, SMAD4/DPC4, prognosis
Introduction
Pancreatic cancer, currently ranked as the fourth leading cause of cancer-related deaths, is a lethal disease with an overall 5-year survival rate of about 8% [1]. It is projected to become the second leading cause of cancer-related deaths by 2030 [2]. Surgical resection, the only potentially curative therapy for patients with pancreatic ductal adenocarcinoma (PDAC), offers a 5-year survival rate of 10-18% [3]. The aggressive malignancy of this disease and the lack of effective treatment have led to a dismal prognosis [4, 5]. An effective biomarker to predict postoperative prognosis in PDAC is still lacking.
PDAC is characterized by a dense, heterogeneous stroma composed of fibroblasts, stellate cells, extracellular matrix, and immune cells and the Sonic hedgehog (Shh) signaling pathway is crucial for the formation of this dynamic compartment [6, 7]. The Shh signaling pathway, first discovered in 1980[8], has an early and critical role in the genesis of pancreatic cancer [6, 7]. The Shh protein binds and inactivates the membrane receptor, patched 1 (PTCH1) that normally inhibits the 7-transmembrane protein, Smoothened (SMO). SMO, in turn, activates the glioma-associated oncogene (Gli) transcription factors, Gli1 and Gli2 [9], and turns on the Shh signaling pathway, which promotes cancer cell proliferation. Despite the key role of the Shh pathway in pancreatic cancer, the prognostic and predictive values of currently available Shh molecular markers are not yet reliable and require further evaluation with large patient populations [10].
It is increasingly evident that tumors do not exist in isolation and the tumor-environment crosstalk plays an important role in cancer progression [10]. PDAC is characterized by several genetic alterations in key genes, such as mutations that activate the KRAS oncogene and inactivate the tumor suppressor genes, TP53, mothers against decapentaplegic homolog 4 (SMAD4/DPC4), and cyclin dependent kinase inhibitor 2A (CDKN2A/P16) [7, 11-14]. We have previously shown that pancreatic tumor cells closely interact with their immune microenvironment [15]. However, it is not yet clear whether specific driver gene mutations are involved in stroma formation. Some studies have shown potential effects of driver genes on the Shh signaling pathway. The KRAS oncogene activates Shh signaling in PDAC cells [16] and loss of TP53 may activate Shh signaling in many cancers [17]. TGFß-Smads signaling positively regulates GLI1 transcription [18]. These results highlight the importance of the need for a detailed understanding of tumor-stroma interactions.
The crosstalk between tumor and tumor microenvironment plays an important role in tumor progression and is considered to be involved in treatment and prognosis. In this study, we investigated potential associations between major driver gene mutations and the Shh signaling molecules that promote the formation of a fibroblast-rich stroma in PDAC. We also evaluated their association with clinicopathological features and prognosis. The status of major driver genes and Shh signaling proteins may be used as molecular prognostic markers to make better therapeutic decisions and may provide insights into tumor-stroma interactions.
Methods
1. Selection of patients
We collected data from 237 patients diagnosed with PDAC who underwent curative-intent surgery and adjuvant chemotherapy at the Pancreatic Cancer Institute of Fudan University from January 2010 to December 2013. All patients in the study were diagnosed to have resectable PDAC, namely there is no arterial tumor contact [celiac axis (CA), superior mesenteric artery (SMA), common hepatic artery] and there is no tumor contact with the superior mesenteric vein (SMV) or portal vein (PV) or ≤ 180-degrees contact without vein contour irregularity [5]. Exclusion criteria included preoperative chemotherapy and/or radiotherapy, macroscopically incomplete resection (R2), pancreatic tumor histology other than ductal adenocarcinoma. Patients who died of postoperative complications within 30 days after surgery were also excluded. Overall survival (OS) was calculated as the interval between the date of surgery and the date of death or the last follow-up visit. Recurrence-free survival (RFS) was defined as the interval between the date of surgery and the date of tumor recurrence or the last follow-up visit. All patients were monitored until December 2017. A TNM stage was assigned to each patient according to the 8th edition of the Union for international cancer control (UICC) staging system for pancreatic cancer [5]. We used the recommended upper limit of 37 U/mL for CA19-9, the diagnostic biomarker for pancreatic cancer [19]. This study was approved by the appropriate research Ethics Committees, and informed consent was obtained from all patients.
2. Immunohistochemistry and tissue microarrays (TMAs)
Immunostaining was performed using TMAs (Shanghai Biochip Company, China), which were constructed as described previously [15] using two tissue cores (1.5-mm diameter) taken from representative areas of each formalin-fixed, paraffin-embedded tumor specimen. Previous studies have shown that the immunohistochemical labeling of Kras, p16, p53, and Smad4 reflects their respective genetic status in PDAC [20-22]. The antibodies and the concentrations used for immunostaining are provided in Table S7.
3. Measurement of marker positivity in cell populations
TMA slide images were captured as high-resolution digital files. Immunostainings were independently evaluated by two pancreatic pathologists who were blinded to the clinical data and any discrepancy in their analysis was resolved by consensus. Islet cells were used as an internal control for immunolabeling. Immunohistochemical labeling of Smad4 and p16 were scored as intact (positive), which indicated the presence of an intact gene, or lost (negative), which indicated a loss of function mutation or deletion of the gene [22, 23]. p53 expression was considered abnormal in two scenarios: 1) a virtual absence (<5%) of p53 immunolabeling in neoplastic cells compared with adjacent normal tissue, which suggested the presence of an intragenic deletion, nonsense or frameshift mutation; and 2) robust nuclear accumulation of immunolabeled protein in ≥30% of neoplastic cells compared with adjacent normal cells [11, 24]. Immunohistochemistry of the driver genes are shown in Fig. S1.
The expression levels of Shh and the downstream factors, Gli1, Gli2, and SMO, were defined as follows: The percentage positivity was scored as 0 (<5%), 1 (5%- 25%), 2 (25%-50%), 3 (50%-75%), or 4 (>75%). The staining intensity was score as 0 (no staining), 1 (weakly stained), 2 (moderately stained), or 3 (strongly stained). Expression levels were determined using the following formula: immunohistochemistry (IHC) score = percentage score × intensity score. An IHC score > 6 was defined as high level of protein expression [25].
4. Statistical analysis
IBM SPSS Statistics software version 23 (IBM Corporation, USA) was used to organize and analyze data. Continuous variables were expressed as median and range, and categorical variables were compared using the χ2 test or Fisher's exact test. OS and RFS were estimated using the Kaplan-Meier method and compared using the Cox model. The Pearson χ2 test or the Fisher exact test was used to correlate Smad4, Gli1, and SMO expression with clinicopathologic features. The concordance index (C-index) and Akaike information criterion (AIC) were used to compare the accuracies of predictive models. Results were considered statistically significant for p < 0.05.
Results
1. Clinicopathological characteristics
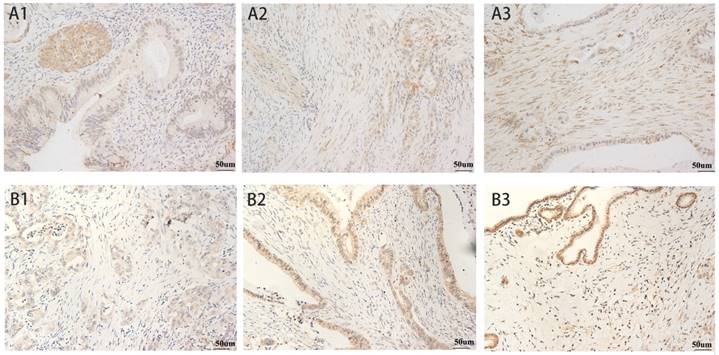
The patient and tumor characteristics of 237 patients with resectable PDAC in this study are listed in Table S1. Immunohistochemical staining of common driver genes and the Shh-pathway proteins are shown in Table S2. Lack of Smad4 and p16 immunolabeling were observed in 168 (70.9%) and 177 (74.7%) patients, respectively. Abnormal immunolabeling of p53 was detected in 147 (62.0%) patients. All patients scored positive for immunostaining of Kras. Immunolabeling of Shh-pathway molecules showed that SMO was localized in the cytoplasm and the cell membrane of pancreatic tumor cells and Gli1 was localized in the cytoplasm and the nucleus. High levels of SMO and Gli1 expression was found in 62.0% and 48.1% of patients, respectively (Fig. 1). Shh was mainly localized in the cytoplasm of cancer cells and 43% of the patients (102 of 237) showed a high level of Shh expression. Gli2 was localized in the cytoplasm and nucleus of cancer cells and 57% of patients showed a high level of Gli1 expression (Fig. S2).
SMO and Gli1 Expression in Pancreatic Cancer. SMO: A1) weak expression, A2) moderate expression, and A3) intense expression in tumor cells and stroma. Gli1: B1) weak expression, B2) moderate expression, and B3) intense expression in stroma. All magnification = 400×. Positive staining appears brown.
2. Survival analysis
Of the 237 patients with PDAC at the start of the study, only 9 were alive at the census date (December 2017). The median OS was 12.1 months, with 1-, 3-, and 5-year survival rates of 51.9%, 16.9%, and 8.8%, respectively. During the study period, recurrent disease occurred in all 237 patients. We performed a survival analysis to study the status of driver genes and Shh-pathway molecules and the clinicopathological characteristics in relation to OS or RFS in patients with PDAC (Table 1). Univariate Cox analysis showed that loss of Smad4 in patients resulted in worse OS [Hazard ratio (HR) 1.887, p < 0.001] and RFS (HR 1.886, p < 0.001) compared with patients with intact Smad4. Patients with abnormal p53 immunolabeling showed poor OS (HR 1.436, p = 0.011). The genetic status of p16 showed no effect in survival outcome (OS p = 0.739 and RFS p = 0.599) in patients with PDAC. Analysis of key molecules of the Shh pathway indicated that patients with high levels of Gli1 and SMO expression showed poor OS (Gli1: HR 1.988, p < 0.001; SMO: HR 1.411, p = 0.013) and RFS (Gli1: HR 1.716, p < 0.001; SMO: HR 1.436, p = 0.013). We found no association between the expression levels of Shh and Gli2 and patients' survival outcome.
Univariate and Multivariate Cox regression for Survival analysis
| Variables | RFS | OS | ||
|---|---|---|---|---|
| HR (95% CI) | p value | HR (95% CI) | p value | |
| Univariate analysis | ||||
| Smad4 (lost vs. intact) | 1.886 (1.391-2.558) | 0.000* | 1.887 (1.406-2.532) | 0.000* |
| TP53 (abnormal vs. normal) | 1.173 (0.881-1.562) | 0.275 | 1.436 (1.086-1.901) | 0.011* |
| p16 (lost vs. intact) | 0.918 (0.667-1.263) | 0.599 | 1.041 (0.770-1.408) | 0.739 |
| Shh (high vs. low) | 0.766 (0.581-1.011) | 0.059 | 0.864 (0.664-1.124) | 0.227 |
| Gli1 (high vs. low) | 1.716 (1.301-2.263) | 0.000* | 1.988 (1.517-2.604) | 0.000* |
| Gli2 (high vs. low) | 0.975 (0.739-1.285) | 0.885 | 1.018 (0.782-1.306) | 0.895 |
| SMO (high vs. low) | 1.436 (1.078-1.911) | 0.013* | 1.411 (1.077-1.848) | 0.013* |
| Age (>60 vs. ~ 60 y) | 1.091 (0.830-1.434) | 0.534 | 1.091 (0.837-1.421) | 0.520 |
| Gender (male vs. female) | 1.706 (1.288-2.256) | 0.000* | 1.663 (1.265-2.185) | 0.000* |
| Serum CA19-9 (>37 vs. ~ 37 U/mL) | 2.476 (1.747-3.508) | 0.000* | 2.524 (1.828-3.486) | 0.000* |
| Location (body and tail vs. head) | 1.804 (1.356-2.400) | 0.000* | 1.671 (1.266-2.205) | 0.000* |
| Largest tumor size (>2 vs. ~ 2 cm) | 0.940 (0.646-2.369) | 0.794 | 1.509 (1.038-2.195) | 0.030* |
| Lymph node metastasis (positive vs. negative) | 1.247 (0.951-1.635) | 0.110 | 1.437 (1.106-1.867) | 0.007* |
| Venous invasion (positive vs. negative) | 1.739 (1.235-2.449) | 0.002* | 2.331 (1.654-3.284) | 0.000* |
| Perineural invasion (positive vs. negative) | 1.293 (0.887-1.885) | 0.182 | 0.956 (0.681-1.342) | 0.795 |
| Grading (poor vs. well/moderate) | 1.516 (1.219-2.037) | 0.006* | 1.573 (1.185-2.087) | 0.002* |
| UICC T (T3-4 vs. T1-2) | 1.629 (1.238-2.144) | 0.000* | 2.379 (1.811-3.127) | 0.000* |
| UICC N (N1-2 vs. N0) | 1.247 (0.951-1.635) | 0.110 | 1.437 (1.106-1.867) | 0.007* |
| UICC stage | 0.001* | 0.000* | ||
| I | 1 | 1 | ||
| II | 1.134 (0.826-1.556) | 0.438 | 1.560 (1.154-2.108) | 0.004 |
| III | 3.417 (2.340-4.990) | 0.001 | 4.144 (2.845-6.037) | 0.000 |
| Multivariate analysis | ||||
| Smad4 (lost vs. intact) | NS | 0.074 | 1.551 (1.009-2.384) | 0.045* |
| TP53 (abnormal vs. normal) | NA | NS | 0.149 | |
| Gli1 (high vs. low) | 1.590 (1.187-2.131) | 0.002* | 1.541 (1.071-2.217) | 0.020* |
| SMO (high vs. low) | 1.776 (1.273-2.450) | 0.001* | 1.782 (1.283-2.474) | 0.001* |
| Gender (male vs. female) | 2.457 (1.800-3.355) | 0.000* | 2.208 (1.614-3.022) | 0.000* |
| Serum CA19-9 (>37 vs. ~ 37 U/mL) | 2.849 (1.963-4.135) | 0.000* | 3.190 (2.203-4.621) | 0.000* |
| Location (body and tail vs. head) | 2.086 (1.544-2.818) | 0.000* | 1.821 (1.331-2.492) | 0.000* |
| Largest tumor size (>2 vs. ~ 2 cm) | NA | NS | 0.359 | |
| Lymph node metastasis (positive vs. negative) | NA | 1.638 (1.221-2.197) | 0.001* | |
| Venous invasion (positive vs. negative) | NS | 0.710 | 2.020 (1.364-2.991) | 0.000* |
| Grading (poor vs. well/moderate) | NS | 0.937 | NS | 0.606 |
*p < 0.05;
SMO: smoothened; Gli: glioma-associated oncogene homolog; OS: overall survival; RFS: recurrence-free survival; HR: hazard ratio; CI: confidence interval; NS: non-significant; NA: non-adoption; UICC: International Union against Cancer.
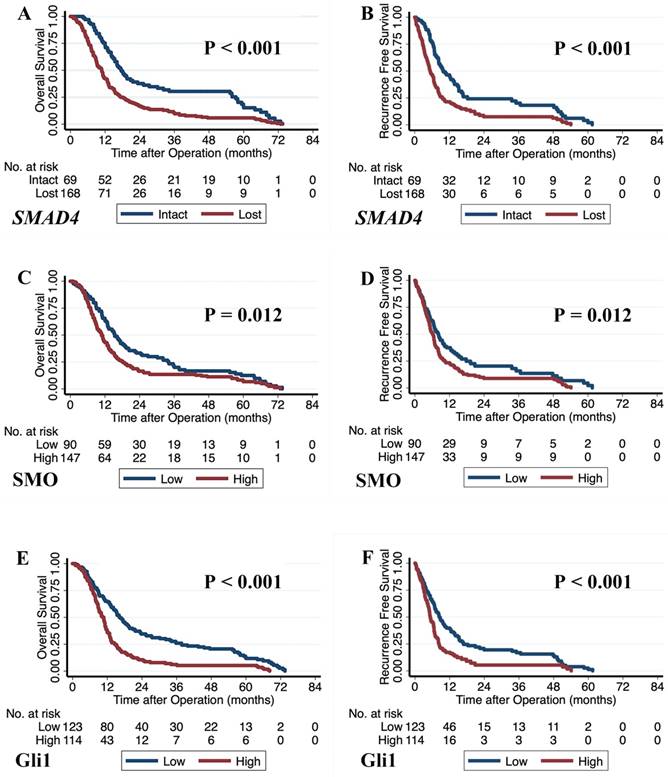
We constructed multivariate models using Cox proportional hazards analysis with significant factors (p < 0.05) obtained from the univariate analysis (Table 1). Our results showed that loss of Smad4 immunolabeling was an independent prognostic factor for shorter OS (HR 1.551, p = 0.045) and a borderline significant prognostic factor for shorter RFS (HR 2.045, p = 0.074). Poor survival outcomes for patients were also associated with high levels of Gli1 (OS: HR 1.541, p = 0.020 and RFS: HR 1.590, p = 0.002) and SMO expression (OS: HR 1.782, p = 0.001; RFS: HR 1.776, p = 0.001). The Kaplan-Meier curves with log-rank test for the prognostic factors, including Smad4, SMO, and Gli1, are shown in Fig. 2.
The Kaplan-Meier curves based on the genetic status of SMAD4 and the expression levels of SMO and Gli1. A) Overall survival curves based on the genetic status of SMAD4. B) Recurrence-free survival curves based on the genetic status of SMAD4. C) Overall survival curves based on SMO protein expression. D) Recurrence-free survival curves based on SMO protein expression. E) Overall survival curves based on Gli1 protein expression. F) Recurrence-free survival curves based on Gli1 protein expression. 'p' values were calculated by log-rank test.
We correlated the clinicopathological characteristics with patient survival outcomes, and poor overall survival outcomes were seen in male patients (HR 2.208, p < 0.001), patients with high CA19-9 (HR 3.190, p < 0.001), patients with tumors in the body and tail of pancreas (HR 1.821, p < 0.001), and patients with lymph node metastasis (HR 1.638, p = 0.001) and venous invasion (HR 2.020, p < 0.001) of tumors (Table 1).
3. Association of Smad4, Gli1 and SMO expression with the clinicopathologic features
Altered Smad4, Gli1, and SMO protein expression that were associated with significantly poor patient outcomes were correlated with the clinicopathological characteristics seen in patients with PDAC using the χ2 test (Table S3). We found that loss of Smad4 immunolabeling was associated with female patients (p = 0.015), patients with serum levels of CA19-9 > 37 U/mL (p = 0.003), patients with tumors in the body and tail of pancreas (p < 0.001), patients with a tumor size >2 cm (p = 0.028), and patients grouped into the T category of UICC classification (p = 0.040). High levels of Gli1 expression was significantly associated with patients with tumors in the body and tail of pancreas (p = 0.006), patients with poorly differentiated tumor tissues (p = 0.001), and patients grouped into the T3-4 category of UICC classification (p = 0.026). High SMO protein levels were significantly associated with female patients (p = 0.001), patients grouped into the N1-2 category of UICC classification (p = 0.001), and patients in Stage II-III of the American joint committee for cancer (AJCC) classification (p = 0.003).
4. Association between Shh-pathway molecules and driver genes
To test the hypothesis that specific driver gene mutations may influence the tumor microenvironment, we analyzed the relationship between the driver genes and Shh signaling molecules that we had found to be strongly associated with patient outcomes. Our results showed a moderate correlation between the loss of Smad4 and high expression levels of Shh (p < 0.001, Pearson's R = 0.343) and Gli1 (p < 0.001, Pearson's R = 0.505) (Table S4). We found no other significant correlation between the driver genes and the Shh-pathway molecules (Table S8).
5. Predictive model based on Shh pathway activation and driver gene mutations
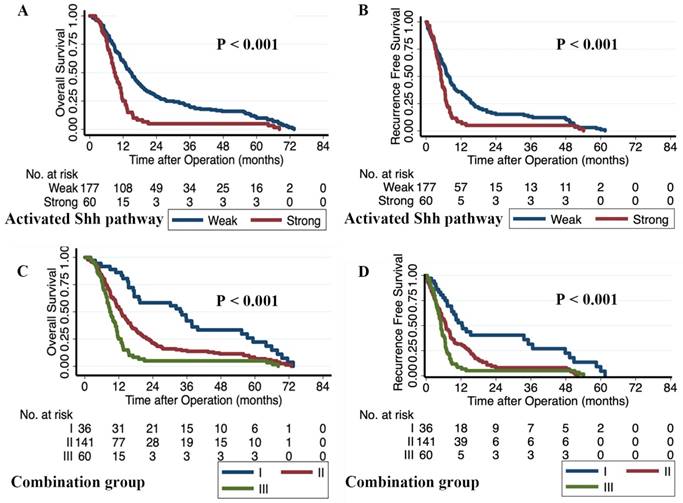
We constructed a predictive model to evaluate the combined prognostic capabilities of Smad4, Gli1, and SMO, which were all independent prognostic factors for OS in patients with PDAC. We classified patients with Gli1high and SMOhigh in the activated- Shh-pathwaystrong group. All other patients were assigned to the activated-Shh-pathwayweak group. All patients were further divided into three integrated model subgroups: group I contained 36 patients with activated-Shh-pathwayweak/Smad4intact; group II contained 141 patients with activated-Shh-pathwayweak/SMAD4lost or activated-Shh-pathwaystrong/SMAD4intact; and group III contained 60 patients with activated-Shh-pathwaystrong/SMAD4lost. The three subgroups showed significantly different OS and RFS and Group III showed the poorest survival outcome (RFS: HR 2.976, p < 0.001; OS: HR 3.598, p < 0.001) compared with the other two groups (Table 2). The Kaplan-Meier survival curves for the activated-Shh-pathway groups and the integrated model subgroups are shown in Fig. 3. Multivariate analysis showed that activated-Shh-pathwaystrong /SMAD4lost (group III) was an independent prognostic factor for poor RFS (HR 2.853, p < 0.001) and OS (HR 3.309, p < 0.001) (Table S5). Comparison of prognostic strengths revealed that the prognostic value of the integrated model was stronger than that of the individual variables. The integrated model group showed a higher concordance index (C-index; OS 0.6220, RFS 0.6076) compared with Shh-Pathway activation level (OS 0.5684, RFS 0.5548) and SMAD4 status (OS 0.5862, RFS 0.5830) and a lower AIC (Integrated model: OS 2033, RFS 1914; Shh-Pathway activation level: OS 2045, RFS 1922; and SMAD4: OS 2052, RFS 1927) (Table S6).
Predictive model based on the combination of activated Shh Pathway and SMAD4
| Variable | No. | RFS | OS | ||||
|---|---|---|---|---|---|---|---|
| Patients | M-RFS (m) | HR (95% CI) | p value | M-OS (m) | HR (95% CI) | p value | |
| Group I | 36 | 12.0 | 1 | 0.000 | 34.0 | 1 | 0.000 |
| Group II | 141 | 6.7 | 2.005 (1.314-3.061) | 0.001 | 12.8 | 2.019 (1.366-2.983) | 0.000 |
| Group III | 60 | 5.1 | 2.976 (1.874-4.724) | 0.000 | 9.0 | 3.598 (2.307-5.612) | 0.000 |
OS: overall survival, RFS: recurrence-free survival, M-OS: median overall survival, M-RFS: median recurrence-free survival, HR: hazard ratio, CI: confidence interval
The Kaplan-Meier survival curves of the activated-Shh-pathway group and the integrated model group. Patients with Gli1high and SMOhigh were classified in the activated-Shh-pathwaystrong group; all others were assigned to the activated-Shh-pathwayweak group. A) Overall survival curves based on the level of activation of the Shh pathway. B) Recurrence-free survival curves based on the level of activation of the Shh pathway. The integrated model group consists of three subgroups: group I, activated-Shh-pathwayweak/SMAD4intact; group II, activated pathwayweak/SMAD4lost or activated-Shh-pathwaystrong/SMAD4intact; group III, with activated-Shh-pathwaystrong /SMAD4lost. C) Overall survival curves based on the integrated model subgroups. D) Recurrence-free survival curves based on the integrated model subgroups. 'p' values were calculated by log-rank test.
Discussion
Our study showed that loss of SMAD4/DPC4 and a strong activated Shh pathway due to high expression levels of Gli1 and SMO resulted in a poor prognosis for patients with PDAC. These potential prognostic factors also correlated with clinicopathological features that were known to result in poor survival outcomes for patients with PDAC. Moreover, our study revealed that the driver genes mutation of tumor cell might program the tumor microenvironment, and the expressions of Shh and Gli1 were found to be related to the status of SMAD4/DPC4. And the integrated model based on the combination of these potential prognostic factors had a stronger prognostic value. We showed a correlation between the genetic status of SMAD4 and the expression levels of Sonic hedgehog pathway proteins in patients with pancreatic adenocarcinoma. This association may serve as a potential prognostic marker for pancreatic cancer.
Studies have shown that driver gene mutants and Shh-pathway molecules are linked to pancreatic cancer prognosis [10, 25]. The proportion of patients in our study with mutated SMAD4/DPC4 (70.9%), CDKN2A/p16 (74.7%), and TP53 (62%) was similar to previously reported values (54.7% of SMAD4/DPC4 [25], 67.3% of CDKN2A/p16, and 50-70% of TP53 [26]). The prognostic implications of p53 mutations remain unclear [23, 26-28]. Although our univariate regression analysis showed that abnormal labeling of p53 was significant for OS, we were unable to confirm it by multivariate analysis. Previous studies [24, 29] have shown conflicting results on the correlation of CDKN2A/p16 mutational status on patient survival. Our results show no such correlation, which may be due to an almost universal inactivation of the CDKN2A gene in pancreatic cancer partly because of methylation [7]. Consistent with previous reports [15, 24, 28-30], we found that loss of SMAD4/DPC4 was significantly associated with shorter OS and RFS in patients with PDAC.
We also observed a broad expression of Shh-pathway molecules in our patients, which emphasized the important role of Shh signaling in pancreatic cancer [7]. We showed that a strongly activated Shh pathway with high expression levels of SMO and Gli1 was independent prognostic factors for PDAC, consistent with recently reported results [31, 32]. However, we found that expression levels of Gli2 and Shh did not correlate with survival outcomes, in contrast to previous studies [31, 32]. This discrepancy may be due to our study's limited sample size and data heterogeneity.
Studies have suggested that specific driver gene mutations reprogram the tumor microenvironment via the Shh pathway to form a dense stroma in pancreatic cancer. The oncogenic KRAS [16] and mutational inactivation of TP53 [17] activate Shh signaling. However, the relationship between the Shh pathway and SMAD4 mutation has rarely been reported. SMAD4 mutations are relatively specific in pancreatic cancer and are central mediators of the transforming growth factor beta (TGF-β) signaling pathway [34]. The TGF-β/smad4 pathway plays a tumor suppressive effect in normal pancreatic cells, which plays an important role in the development of tumors [34]. In SMAD4-deficient pancreatic cancer, the accumulation of TGF-β leads to the release of extracellular molecule, such as MMP2, MMP9 [35]. Overexpression of TGF-β is also a major factor in fibrosis in many tumors [36], as the Shh pathway is widely recognized as the classic pathway for the formation of extracellular matrix in pancreatic cancer [29]. Therefore, there may be a connection between the two pathways. During embryonic development, TGF-β family members are involved in the induction of pancreatic differentiation, meanwhile inhibiting the local expression of the transcription factor Shh [37]. This suggests a relation between TGF-β/smad4 and Shh pathway early in the embryo. Thus, we hypothesized that the inhibitory effect of TGF-β/smad4 on Shh might be attenuated due to the SMAD4 deficient in pancreatic cancer, and the higher Shh expression strongly activated the Shh pathway, which appears to promote tumor development. The hypothesis is consistent with previous reports that both TGF-β/smad4 signaling and Shh pathway can promote tumor growth through epithelial mesenchymal transition [38]. In addition, it has also been confirmed in a special animal model that Shh ligands could induce TGF-β1 [39]. This association between Shh and TGF-β may also provide another possible hypothesis for the failure of studies targeting the Shh pathway, such as IPI-926, cyclopamine [40, 41]. The treatment might cause the aberrant over-expression of Shh downstream molecule, and induce more TGF-β1, which possibly associated with an increased propensity of PDAC to metastasize. Similarly, the loss of SMAD4 was also confirmed to be associated with metastasis of pancreatic cancer [29]. Interestingly, SMAD4 inactivation in the pancreatic exocrine cells enhances fibrotic responses, possibly via upregulation of Shh RNA expression [33]. We also showed that the mutational status of SMAD4 was important for the activation of Shh signaling, which is a key pathway to promote desmoplasia [6, 7]. The loss of Smad4 was significantly associated with high expression levels of Shh and Gli1. Patients with a combined status of activated-Shh-pathwaystrong /SMAD4lost showed the poorest survival outcomes compared with the other patients in our study. Our results, together with previous reports, suggested that specific driver gene mutations program the desmoplasia process. Further studies are needed to validate this hypothesis.
Some limitations of our study include smaller sample size and bias due to single-center and retrospective data. Future studies with larger patient numbers may validate the prognostic significance of the genetic status of driver genes and expression of Shh-pathway molecules in PDAC. Our study conclusions are only based on immunohistochemical data to provide insights into potential prognostic biomarkers for PDAC. Our statistical analysis does not fully differentiate between correlation and causation. Future studies are needed to comprehensively analyze the genetic and molecular basis of our observations to fully understand the underlying molecular mechanisms.
Conclusions
We showed that the loss of SMAD4 was associated with an activated Shh signaling pathway in resectable pancreatic cancer. This correlation may be a predictive factor to enable better prognosis in patients with PDAC and facilitate patient counseling and disease management.
Abbreviations
PDAC: pancreatic ductal adenocarcinoma; Shh: sonic hedgehog; SMO: smoothened; OS: overall survival; HR: hazard ratio; RFS: recurrence-free survival; Gli: glioma-associated oncogene; SMAD4/DPC4: decapentaplegic homolog 4; CDKN2A/P16: cyclin dependent kinase inhibitor 2A; UICC: Union for international cancer control; AJCC: American joint committee for cancer; IHC: immunohistochemistry; C-index: concordance index; AIC: Akaike information criterion.
Supplementary Material
Supplementary figures and tables.
Acknowledgements
Financial Support
This work was supported by grants from the National Science Foundation for Distinguished Young Scholars of China (81625016), the National Natural Science Foundation of China (81872366, 81472670, 81871941, 81802380, and 81802675), the Outstanding Academic Leader Program of the “Technological Innovation Action Plan” in Shanghai Science and Technology Commission (18XD1401200), and the Young Talented Specialist Training Program of Shanghai.
Ethical approval
For this type of study formal consent is not required. This article does not contain any studies with animals performed by any of the authors.
Informed consent
Informed consent was obtained from all individual participants included in the study.
Competing Interests
The authors have declared that no competing interest exists.
References
1. Siegel RL, Miller KD, Jemal A. Cancer statistics, 2018. CA Cancer J Clin. 2018;68(1):7-30
2. Rahib L, Smith BD, Aizenberg R. et al. Projecting cancer incidence and deaths to 2030: the unexpected burden of thyroid, liver, and pancreas cancers in the United States. Cancer Res. 2014;74(11):2913-2921
3. Katz MHG, Wang H, Fleming JB. et al. Long-Term Survival After Multidisciplinary Management of Resected Pancreatic Adenocarcinoma. Annals of Surgical Oncology. 2009;16(4):836-847
4. Kamisawa T, Wood LD, Itoi T. et al. Pancreatic cancer. Lancet. 2016;388(10039):73-85
5. Tempero MA, Malafa MP, Al-Hawary M. et al. Pancreatic Adenocarcinoma, Version 2.2017, NCCN Clinical Practice Guidelines in Oncology. J Natl Compr Canc Netw. 2017;15(8):1028-1061
6. Thayer SP, di Magliano MP, Heiser PW. et al. Hedgehog is an early and late mediator of pancreatic cancer tumorigenesis. Nature. 2003;425(6960):851-856
7. Jones S, Zhang X, Parsons DW. et al. Core signaling pathways in human pancreatic cancers revealed by global genomic analyses. Science. 2008;321(5897):1801-1806
8. Nusslein-Volhard C, Wieschaus E. Mutations affecting segment number and polarity in Drosophila. Nature. 1980;287(5785):795-801
9. Hidalgo M, Maitra A. The hedgehog pathway and pancreatic cancer. N Engl J Med. 2009;361(21):2094-2096
10. Sacristan C, Tuveson DA. Quid pro Quo: A Tumor is Not Alone. Trends Mol Med. 2017;23(5):375-376
11. Biankin AV, Waddell N, Kassahn KS. et al. Pancreatic cancer genomes reveal aberrations in axon guidance pathway genes. Nature. 2012;491(7424):399-405
12. Notta F, Chan-Seng-Yue M, Lemire M. et al. A renewed model of pancreatic cancer evolution based on genomic rearrangement patterns. Nature. 2016;538(7625):378-382
13. Mueller S, Engleitner T, Maresch R. et al. Evolutionary routes and KRAS dosage define pancreatic cancer phenotypes. Nature. 2018;554(7690):62-68
14. Bailey P, Chang DK, Nones K. et al. Genomic analyses identify molecular subtypes of pancreatic cancer. Nature. 2016;531(7592):47-52
15. Wang WQ, Liu L, Xu HX. et al. Infiltrating immune cells and gene mutations in pancreatic ductal adenocarcinoma. Br J Surg. 2016;103(9):1189-1199
16. Ji Z, Mei FC, Xie J. et al. Oncogenic KRAS activates hedgehog signaling pathway in pancreatic cancer cells. J Biol Chem. 2007;282(19):14048-14055
17. Chung JH, Larsen AR, Chen E. et al. A PTCH1 homolog transcriptionally activated by p53 suppresses Hedgehog signaling. J Biol Chem. 2014;289(47):33020-33031
18. Katoh Y, Katoh M. Integrative genomic analyses on GLI1: positive regulation of GLI1 by Hedgehog-GLI, TGFbeta-Smads, and RTK-PI3K-AKT signals, and negative regulation of GLI1 by Notch-CSL-HES/HEY, and GPCR-Gs-PKA signals. Int J Oncol. 2009;35(1):187-192
19. Luo G, Liu C, Guo M. et al. CA19-9-Low&Lewis (+) pancreatic cancer: A unique subtype. Cancer Letters. 2017;385:46-50
20. Geradts J, Hruban RH, Schutte M. et al. Immunohistochemical p16INK4a analysis of archival tumors with deletion, hypermethylation, or mutation of the CDKN2/MTS1 gene. A comparison of four commercial antibodies. Appl Immunohistochem Mol Morphol. 2000;8(1):71-79
21. Baas IO, Mulder JW, Offerhaus GJ. et al. An evaluation of six antibodies for immunohistochemistry of mutant p53 gene product in archival colorectal neoplasms. J Pathol. 1994;172(1):5-12
22. Wilentz RE, Su GH, Dai JL. et al. Immunohistochemical labeling for dpc4 mirrors genetic status in pancreatic adenocarcinomas: a new marker of DPC4 inactivation. Am J Pathol. 2000;156(1):37-43
23. Jeong J, Park YN, Park JS. et al. Clinical significance of p16 protein expression loss and aberrant p53 protein expression in pancreatic cancer. Yonsei Med J. 2005;46(4):519-525
24. Oshima M, Okano K, Muraki S. et al. Immunohistochemically Detected Expression of 3 Major Genes (CDKN2A/p16, TP53, and SMAD4/DPC4) Strongly Predicts Survival in Patients With Resectable Pancreatic Cancer. Annals of Surgery. 2013;258(2):336-346
25. Taylor CR. Quantifiable internal reference standards for immunohistochemistry: the measurement of quantity by weight. Appl Immunohistochem Mol Morphol. 2006;14(3):253-259
26. Ansari D, Rosendahl A, Elebro J. et al. Systematic review of immunohistochemical biomarkers to identify prognostic subgroups of patients with pancreatic cancer. Br J Surg. 2011;98(8):1041-1055
27. Bold RJ, Hess KR, Pearson AS. et al. Prognostic factors in resectable pancreatic cancer: p53 and bcl-2. J Gastrointest Surg. 1999;3(3):263-277
28. Shin SH, Kim SC, Hong SM. et al. Genetic alterations of K-ras, p53, c-erbB-2, and DPC4 in pancreatic ductal adenocarcinoma and their correlation with patient survival. Pancreas. 2013;42(2):216-222
29. Blackford A, Serrano OK, Wolfgang CL. et al. SMAD4 gene mutations are associated with poor prognosis in pancreatic cancer. Clin Cancer Res. 2009;15(14):4674-4679
30. Hayashi H, Kohno T, Ueno H. et al. Utility of Assessing the Number of Mutated KRAS, CDKN2A, TP53, and SMAD4 Genes Using a Targeted Deep Sequencing Assay as a Prognostic Biomarker for Pancreatic Cancer. Pancreas. 2017;46(3):335-340
31. Wang Y, Peng Q, Jia H. et al. Prognostic value of hedgehog signaling pathway in digestive system cancers: A systematic review and meta-analysis. Cancer Biomark. 2016;16(1):71-79
32. Marechal R, Bachet JB, Calomme A. et al. Sonic hedgehog and Gli1 expression predict outcome in resected pancreatic adenocarcinoma. Clin Cancer Res. 2015;21(5):1215-1224
33. Garcia-Carracedo D, Yu CC, Akhavan N. et al. Smad4 loss synergizes with TGFalpha overexpression in promoting pancreatic metaplasia, PanIN development, and fibrosis. PLoS One. 2015;10(3):1-17
34. Ahmed S, Bradshaw AD, Gera S. et al. The TGF-beta/Smad4 Signaling Pathway in Pancreatic Carcinogenesis and Its Clinical Significance. J Clin Med. 2017;6(1):5
35. Ignotz RA, Massague J. Transforming growth factor-beta stimulates the expression of fibronectin and collagen and their incorporation into the extracellular matrix. J Biol Chem. 1986;261(9):4337-4345
36. Krzemien S, Knapczyk P. Current review on the role of transforming growth factor beta (TGF-beta) in some pathological disorders. Wiad Lek. 2005;58(9-10):536-539
37. Hebrok M, Kim SK, St Jacques B. et al. Regulation of pancreas development by hedgehog signaling. Development. 2000;127(22):4905-4913
38. Bailey JM, Leach SD. Signaling pathways mediating epithelial- mesenchymal crosstalk in pancreatic cancer: Hedgehog, Notch and TGFbeta. Grippo PJ, Munshi HG, eds. Pancreatic Cancer and Tumor Microenvironment, Trivandrum (India): Transworld Research Network. 2012
39. Jung IH, Jung DE, Park YN. et al. Aberrant Hedgehog ligands induce progressive pancreatic fibrosis by paracrine activation of myofibroblasts and ductular cells in transgenic zebrafish. PLoS One. 2011;6(12):1-15
40. Wang WQ, Liu L, Xu JZ. et al. Reflections on depletion of tumor stroma in pancreatic cancer. Biochim Biophys Acta Rev Cancer. 2019;1871(2):267-72
41. Rhim AD, Oberstein PE, Thomas DH. et al. Stromal elements act to restrain, rather than support, pancreatic ductal adenocarcinoma. Cancer Cell. 2014;25(6):735-747
Author contact
![]() Corresponding authors: Dr. Wen-Quan Wang, Prof. Xian-Jun Yu, and Prof. Liang Liu, Department of Pancreatic Surgery, Fudan University Shanghai Cancer Center; Shanghai Pancreatic Cancer Institute; Pancreatic Cancer Institute, Fudan University, 270 Dong An Road, Shanghai 200032, China. Tel/Fax: +86-21-6403-1446; E-mail: wangwenquanorg (W.Q. Wang); yuxianjunorg (X.J. Yu); liuliangorg (L. Liu)
Corresponding authors: Dr. Wen-Quan Wang, Prof. Xian-Jun Yu, and Prof. Liang Liu, Department of Pancreatic Surgery, Fudan University Shanghai Cancer Center; Shanghai Pancreatic Cancer Institute; Pancreatic Cancer Institute, Fudan University, 270 Dong An Road, Shanghai 200032, China. Tel/Fax: +86-21-6403-1446; E-mail: wangwenquanorg (W.Q. Wang); yuxianjunorg (X.J. Yu); liuliangorg (L. Liu)