Impact Factor ISSN: 1837-9664

 Global reach, higher impact
J Cancer 2020; 11(2):441-449. doi:10.7150/jca.30923 This issue Cite
Research Paper
Twenty Metabolic Genes Based Signature Predicts Survival of Glioma Patients
Wenfang Xu*, Zhenhao Liu*, He Ren*, Xueqing Peng, Aoshen Wu, Duan Ma ![]() , Gang Liu
, Gang Liu ![]() , Lei Liu
, Lei Liu ![]()
Department of Biochemistry and Molecular Biology, School of Basic Medical Sciences and Institutes of Biomedical Sciences, Fudan University, 200032, Shanghai, P.R.China.
*These authors equally contributed to this work.
Received 2018-10-24; Accepted 2019-8-5; Published 2020-1-1
Abstract
Background: Glioma, caused by carcinogenesis of brain and spinal glial cells, is the most common primary malignant brain tumor. To find the important indicator for glioma prognosis is still a challenge and the metabolic alteration of glioma has been frequently reported recently.
Methods: In our current work, a risk score model based on the expression of twenty metabolic genes was developed using the metabolic gene expressions in The Cancer Genome Atlas (TCGA) dataset, the methods of which included the cox multivariate regression and the random forest variable hunting, a kind of machine learning algorithm, and the risk score generated from this model is used to make predictions in the survival of glioma patients in the training dataset. Subsequently, the result was further verified in other three verification sets (GSE4271, GSE4412 and GSE16011). Risk score related pathways collected in the Kyoto Encyclopedia of Genes and Genomes (KEGG) database were identified using Gene Set Enrichment Analysis (GSEA).
Results: The risk score generated from our model makes good predictions in the survival of glioma patients in the training dataset and other three verification sets. By assessing the relationships between clinical indicators and the risk score, we found that the risk score was an independent and significant indicator for the prognosis of glioma patients. Simultaneously, we conducted a survival analysis of the patients who received chemotherapy and who did not, finding that the risk score was equally valid in both cases. And signaling pathways related to the genesis and development of multiple cancers were also identified.
Conclusions: In summary, our risk score model is predictive for 967 glioma patients' survival from four independent datasets, and the risk score is a meaningful and independent parameter of the clinicopathological information.
Keywords: Glioma, Marker, Risk Score, Random Forest Variable Hunting, Metabolic Genes
Introduction
Gliomas account for 70% of brain cancers, of which, 101,600 new cases and 61,000 related deaths have been reported, according to the latest statistic reports in China, 2015 [1]. The median survival time of glioma patients is only about 12 months [2], and the five-year survival rate of glioma patients is less than 3% [3]. Clinically, World Health Organization (WHO) classifies gliomas into different grades according to the pathological observations [4]. And yet, the implementation of the staging system is not predictive of prognosis. Therefore, bio-molecular markers are needed to predict glioma patients' survival.
Over the past decades, bio-molecular markers for glioma prognosis have been extensively reported [5-7]. Among these biomarkers, metabolic genes are especially important. For example, IDH1.R132H and IDH2.R172H mutations have been frequently reported in glioma cases [8], and patients harboring IDH1 and IDH2 mutations have a different metabolic pattern[9] and usually have a better prognosis compared to patients with IDH1/2 wild type [10, 11]. Methylation of O-6-methylguanine-DNA methyltransferase (MGMT) is another metabolic biomarker for prognosis, and is clinically relevant to the efficacy of the treatment [12, 13]. In addition, the metabolic status of glioma stem cells is distinct from that of the adjacent normal tissues [14]. However, single bio-molecular marker usually fails to predict glioma patients' survival in consideration of the heterogeneity of cancer, and classification based on transcriptome level contains a large amount of redundant information. On the contrary, the robustness of models based on multiple molecular biomarkers have been proved across datasets and applied to other cancers [15-17].
In this vein, we selected genes related to survival based on metabolic gene expressions, and built a prognostic model using Random Forest machine learning algorithm and Cox regression. The model accurately categorized the patients into good prognosis and poor prognosis groups, and the result was verified in other three validation sets. The evaluation of correlations between clinical indicators and the risk score shows that the independence of risk score compared to other clinical features and the score outperforms other clinical observations in predicting the patients' survival. Meanwhile, the score is valid for patients who received chemotherapy and who didn't. KEGG pathway analysis shows that multiple pathways associated with cancer changed significantly between the high-risk group and the low-risk group, including apoptosis and JAK-STAT signaling pathways.
Methods
Data pre-processing
The raw gene expression data and clinical data were obtained from University of California Santa Cruz (UCSC) Xena and Gene Expression Omnibus (GEO) databases. Background proofing and Robust Multichip Average standardization were implementted among samples in each batch. Subsequently, probes were corresponded to Entrez gene names by referring to the annotation files provided by manufacture in all datasets and platforms. For genes matching more than one probes, average values were regarded as the relative expressions. Genes involved in metabolism were extracted from the previous report [18], and these genes were retained for further analysis. The R Language was used for the statistical analysis of clinical information.
Marker selection and model establishment
Cox univariate regression was used to assess the correlation between the overall survival and the expression level of each metabolic gene with R, and significant genes (p<0.01) were retained for further analysis. Subsequently, random forest variable hunting was implemented to select the most important genes to establish the predicting model [19, 20]. The number of iterations and repeats are both 100. Based on the expression of screened genes, the risk score model was developed through Cox multivariate model as the following formula:
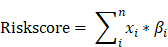
Where xi indicates the expression of gene i, meanwhile βi means the coefficient of gene i generated from the Cox multivariate regression.
Statistical applications and pathway analysis
R function survival::coxph was used for the Cox multivariate and univariate regression analysis, and R function randomForestSRC::var.select was used for random forest survival analysis [21] using the following parameters: 100 repeats, 100 iterations. The risk score difference between categories divided by clinical indicators was calculated based on Student's -test. R package “rms” was used for nomogram calculation and visualization. GSEA [22] was implemented using a java software developed and the default parameters were used by comparing the high-risk (higher than median) and low-risk group (lower than median).
Results
Marker selection and model establishment
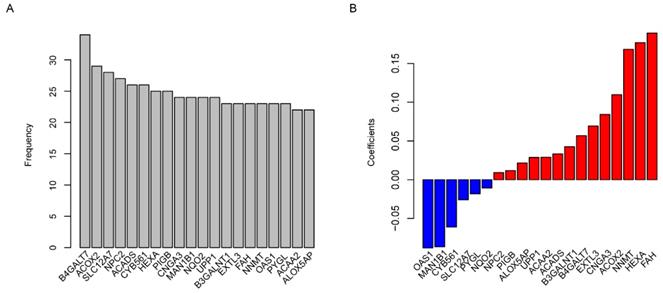
Metabolic genes and related metabolic pathways were reserved for further analysis and the other genes were excluded. In order to find out the survival associated metabolic genes, we used Cox univariate regression to analyze the relationship between overall survival time and gene expression evaluated by microarray (U133A) in TCGA dataset (N=529, median survival: 12 months). 101 genes were identified (p<0.01) and regarded as survival associated genes. We used Random Forest machine learning algorithm to remove redundant information from the selected genes, and twenty genes were filtered for further studies (Fig. 1A, Table 1). The functions of these 20 genes were described in detail in Table S1. The coefficients of OAS1, MAN1B1, CYB561, SLC12A7, PYGL and NQO2 were negative numbers (Fig. 1B), suggesting that the high expression of these genes was significantly associated with longer overall survival time.
Risk score model development. The frequency of genes presented in random forest variable hunting (A) and the coefficient for each gene (B).
Hazard ratio (HR), 95% confidence interval (CI), p values of candidate genes according to Cox univariate and multivariate regression
| Gene | Univariate | Multivariate | |||||
|---|---|---|---|---|---|---|---|
| Entez ID | Gene symbol | HR | 95% CI | pvalue | HR | 95% CI | pvalue |
| 241 | ALOX5AP | 1.1 | 1-1.2 | 0.00484 | 1.06 | 0.96-1.17 | 0.2784 |
| 10449 | ACAA2 | 1.2 | 1.1-1.3 | 0.00329 | 1.12 | 0.97-1.29 | 0.12932 |
| 5836 | PYGL | 1.2 | 1.1-1.3 | 0.00093 | 0.97 | 0.85-1.11 | 0.70363 |
| 4938 | OAS1 | 1.1 | 1-1.2 | 0.0073 | 1.01 | 0.92-1.1 | 0.84306 |
| 4837 | NNMT | 1.1 | 1-1.1 | 0.00011 | 1.03 | 0.98-1.1 | 0.26509 |
| 2184 | FAH | 1.2 | 1-1.3 | 0.00698 | 0.94 | 0.75-1.17 | 0.58805 |
| 2137 | EXTL3 | 1.2 | 1.1-1.4 | 0.005 | 1.19 | 0.94-1.51 | 0.14242 |
| 8706 | B3GALNT1 | 1.2 | 1-1.3 | 0.00809 | 1.01 | 0.86-1.19 | 0.88426 |
| 7378 | UPP1 | 1.2 | 1.1-1.3 | 0.00014 | 1.09 | 0.95-1.24 | 0.21579 |
| 4835 | NQO2 | 1.2 | 1-1.4 | 0.00777 | 0.92 | 0.77-1.09 | 0.33263 |
| 11253 | MAN1B1 | 1.2 | 1.1-1.5 | 0.009 | 0.99 | 0.77-1.27 | 0.93416 |
| 1261 | CNGA3 | 1.1 | 1-1.2 | 0.00299 | 1.03 | 0.94-1.12 | 0.51853 |
| 9488 | PIGB | 1.3 | 1.1-1.4 | 9.00E-05 | 1.04 | 0.86-1.27 | 0.66946 |
| 3073 | HEXA | 1.3 | 1.1-1.5 | 0.00113 | 1.07 | 0.84-1.36 | 0.56997 |
| 1534 | CYB561 | 1.3 | 1.1-1.4 | 0.00153 | 1.21 | 0.96-1.52 | 0.10342 |
| 35 | ACADS | 1.6 | 1.2-2.2 | 0.00175 | 1.18 | 0.81-1.73 | 0.38462 |
| 10577 | NPC2 | 1.2 | 1-1.3 | 0.00705 | 0.92 | 0.73-1.15 | 0.45549 |
| 10723 | SLC12A7 | 1.2 | 1.1-1.4 | 0.00167 | 0.98 | 0.81-1.19 | 0.85272 |
| 8309 | ACOX2 | 1.2 | 1.1-1.3 | 0.00082 | 1.03 | 0.9-1.18 | 0.6778 |
| 11285 | B4GALT7 | 1.4 | 1.1-1.8 | 0.00496 | 1.02 | 0.73-1.43 | 0.90036 |
Prediction of risk score model
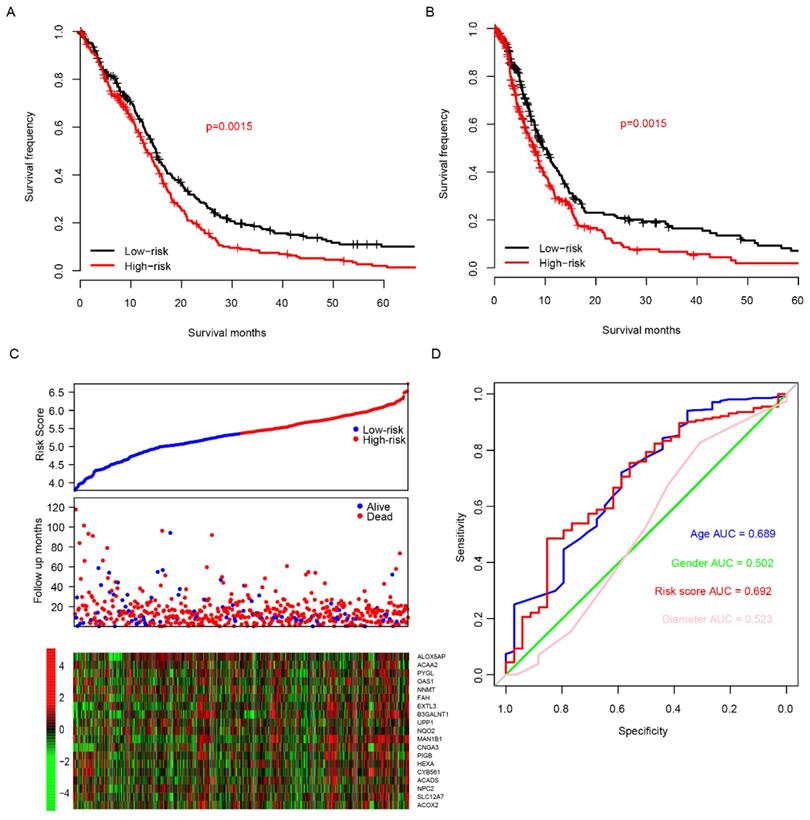
Using the TCGA dataset as the training set, the predictive value of the risk score model was estimated. The glioma patients were grouped into two groups by the median value of the risk score. The overall survival time is 14.9 (95% CI: 13.5-16.7) months in low-risk group, which was remarkably longer (p=0.0015) than 13.1 months (95% CI: 12.0-15.1), the median survival time of high-risk group (Fig. 2A). As shown in Fig. 2B, the comparison of progression-free survival (PFS) between the two groups also showed the same trend (p=0.0015). The sooner the patients' events occurred as the risk score increased, and the risk score is positively correlated with the expression of oncogenes and negatively with suppressor genes in twenty candidate genes (Fig. 2C). One-year survival area under receiving operating characteristic (AUROC) curve was plotted, and the AUROC for age, gender, risk score and primary tumor diameter were 0.689, 0.502, 0,692 and 0.523 (Fig. 2D), indicating that the risk score is a strong prognostic indicator for glioma patients.
Risk score in predicting survival. The high-risk group has a significantly longer overall survival (OS) time than low risk group (A), and it is also similar to progression free survival (PFS, B). Detailed survival information of samples, risk score and gene expression (each point represents a sample, C) and one-year survival ROC were also plotted (D).
Validation of risk score
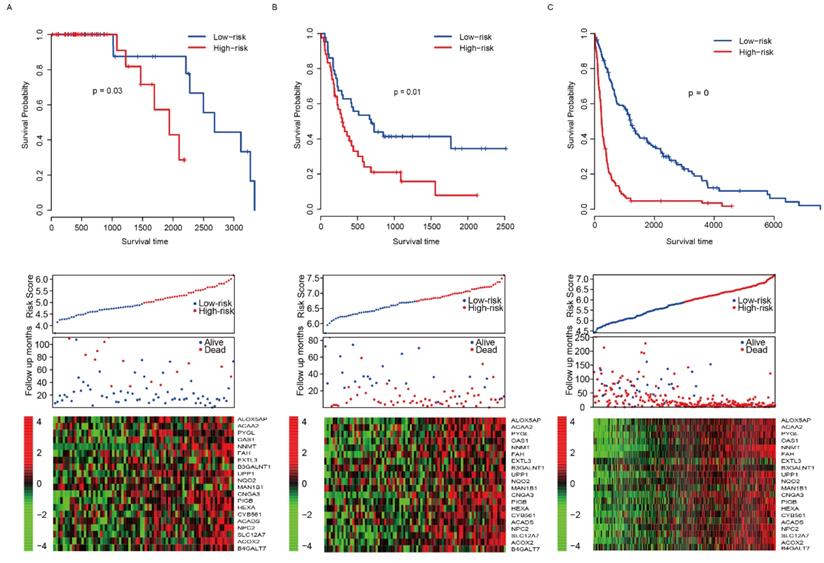
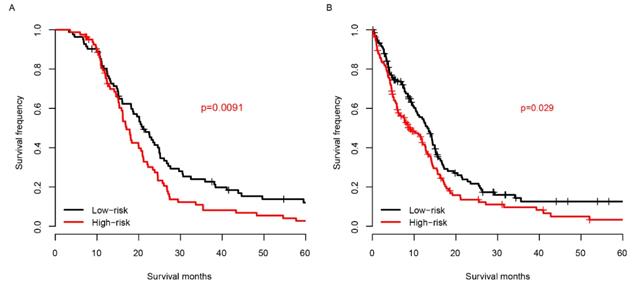
The good predictive effect of the risk score in the training set might be due to the overfitting between the data and the model. For further validation, we used other three independent datasets, GSE4271 [23], GSE4412[24] and GSE16011[25], to evaluate the prognostic robustness of the risk score. Using the median risk score value, we categorized the samples into two groups in each dataset, and the survival differences were analyzed. In group whose patients with low risk score, the patients' survival time is obviously longer in all of the validation sets (p=0.03, 0.01 and 0 for GSE4271, GSE4412 and GSE16011, respectively, Fig. 3A-C, top panel). Same as the training set, we found that the patients were dead sooner as the risk score increased in each verification dataset (Fig. 3A-C, middle panel). Furthermore, the relationship between the expression of the 20 candidate genes and the risk score was also similar to that of the training set (Fig. 3A-C, bottom panel). These results suggest that this model has considerable robustness in predicting the prognosis of glioma patients.
Risk score performance validation. The performance of risk in predicting survival was validated in GSE4271 (A, top panel), GSE4412 (B, top panel) and GSE16011 (C, top panel) datasets. The detailed survival information and gene expression of the three dataset (A-C, middle and bottom panel) also resembles the profile of training dataset (TCGA).
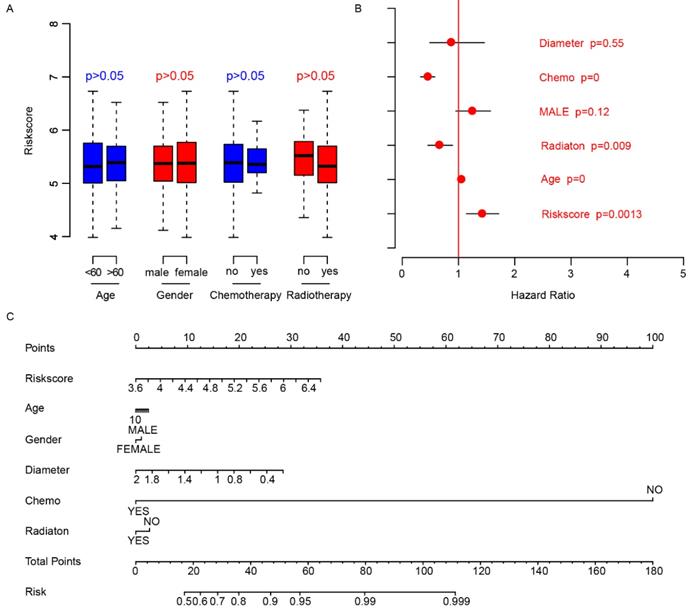
Risk score is independent of other clinical indicators
We did a survey of the clinical information of patients in each dataset (Table 2). The relationship between the risk score and other clinical indicators was explored. Firstly, we grouped the patients by other clinical indicators including age, gender, chemotherapy, and radiotherapy, respectively. Then we analyzed whether there were differences in risk scores within the categories divided by each clinical indexes. The results showed that these indicators were independent of the risk score (Fig. 4A). Thereafter, we used Cox multivariate regression to analyze the significance of age, gender, diameter, chemotherapy, radiation and risk score in the prediction of clinical outcome. The result indicated that the risk score was a valuable prognostic predictor (Fig. 4B). A nomogram was plotted using the aforementioned clinical information to promote the application of risk score (Fig. 4C). The above results showed the importance and independence of the risk score as a candidate prognostic indicator.
Clinical characteristics of GBM patients from the TCGA, GEO (GSE4271, GSE4412 and GSE16011) datasets.
| Characteristics | TCGA | GSE4271 | GSE4412 | GSE16011 |
|---|---|---|---|---|
| Sample No. | 529 | 77 | 85 | 276 |
| Gender*-M/F | 311/202 | 51/25 | 32/53 | 184/92 |
| Age (year)*a | 58.7(10.9-86.6) | 48(22-82) | 42(18-82) | 51.5(11.7-81.2) |
| Chemotherapy*-yes/no | 350/89 | |||
| Radiotherapy*-yes/no | 434/64 | |||
| Tumor diameter (cm)*a | 1(0.3-3.0) | |||
| Survival status*-dead/alive | 422/89 | 15/62 | 59/26 | 237/35 |
| Overall survival time (days)* | 370(3-3881) | 665(21-3339) | 389(7-2516) | 452(0-7548) |
* Data is missing.
a Age, Tumor diameter and Overall survival time were expressed as median (range)
Clinical observations and risk score. The distributions of risk score in age (<60, >60), gender (male, female), chemotherapy (no-not received, yes-received) and radiotherapy (no-not received, yes-received) are shown (A), and the risk score is an important indicator for survival (B) according to Cox multivariate regression. The nomogram was plotted to facilitate utilization of risk score (C).
Risk score and chemotherapy
Chemotherapy is one of the most essential auxiliary treatments for glioma. So, the risk score performance was investigated in patients who received chemotherapy and who did not. The patients receiving chemotherapy were partitioned into high-risk group and low-risk group based on the median risk score of TCGA samples. As shown in Fig. 5A, among the patients who received chemotherapy, the prognosis of the low-risk group was significantly better than that of the high-risk group. The survival distribution of patients without chemotherapy is similar to that of patients with chemotherapy (Fig. 5B). These results reveal that the score is effective for patients who received chemotherapy and who did not.
Risk score and chemotherapy. The risk score successfully predicts the survival of patients who received chemotherapy (A) and who did not (B).
Risk score related pathway analysis
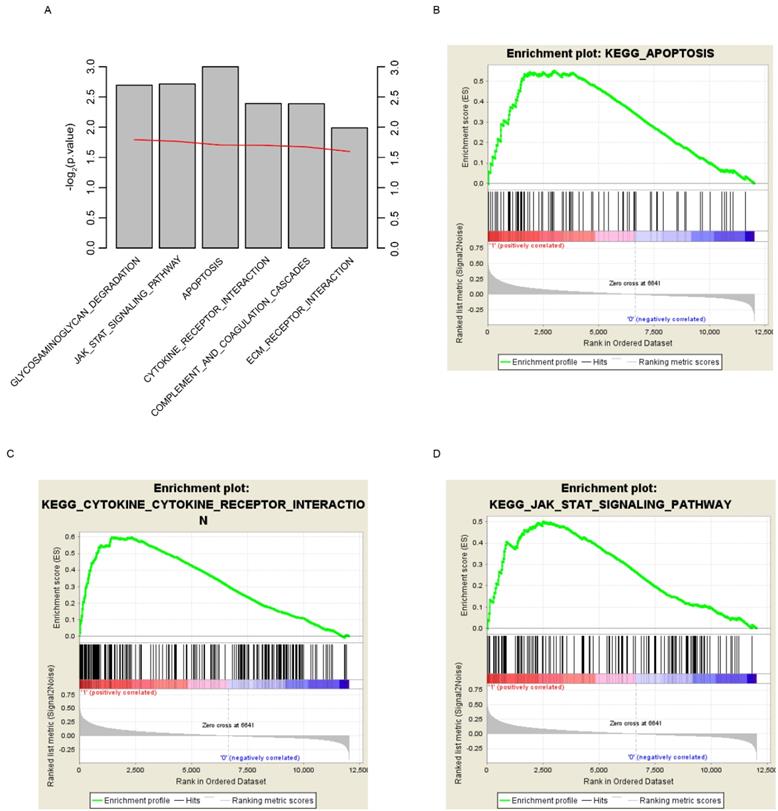
In order to find out the reason why risk score could predict glioma patients' survival, here we grouped the samples according to the median risk score, which are high and low risk groups. GSEA was implemented to investigate the altered pathways between high and low risk groups. Various cancer associated signaling pathways, including glycosaminoglycan degradation, JAK-STAT signaling pathway, apoptosis, cytokine receptor interaction, complement and coagulation cascades, and ECM receptor interaction, were significantly enriched (Fig. 6A, p<0.05). Among these pathways, apoptosis, cytokine receptor interaction and JAK-STAT signaling pathway were shown (Fig. 6B-D). According to these results we draw the conclusion that the survival of glioma patients can be accurately predicted by the risk score, perhaps because the score can reflect the multi-level status of glioblastoma.
KEGG pathways associated with risk score. GSEA based on the expression of TCGA dataset revealed significant (p<0.01) pathways associated with risk score (A), including apoptosis (B), cytokine-cytokine receptor interaction (C) and JAK-STAT signaling pathway (D). For each gene set, vertical bars along the x-axis of the GSEA plot represent the positions of genes within the ranked list (i.e. their fold change). Negative GSEA enrichment score curve indicates anti-enrichment (down-regulation), and positive curve denotes enrichment (up-regulation) (B, C, D).
Discussion
Metabolism alterations of glioma have been frequently reported in the past years. The major mutation in glioma is IDH1/IDH2, which is a key metabolic gene in the oxidative decarboxylation of isocitrate in tricarboxylic acid (TCA) cycle, converting isocitrate to ɑ-ketoglutarate as reducing NADP+ to NADPH[26]. Mutations of IDH1/2 convert isocitrate to a toxic metabolite 2-hydroxyglutarate instead[27]. In addition to mutations in IDH1/2, the expressions of other metabolic enzymes also play an important role in carcinogenesis[28] and cancer development[29]. However, single biomarker is not robust in predicting the survival. For example, none of the genes that were significantly associated with survival could be detected in all the datasets we used in this study. Recent studies highlight the robustness of multiple genes in predicting survival of cancer patients[30-32]. In our current work, by utilizing the expressions of metabolic genes, we developed a model to predict the survival of glioma patients, and validated its effect in three independent datasets. The clinical significance of risk score was evaluated and associated KEGG pathways were identified.
It is noted that these 20 genes are involved in different metabolic categories. For example, ACADS and ACOX2 are involved in fatty acid metabolism[33, 34]; B3GALNT1, B4GALT7, HEXA and MAN1B1 are in glycan synthesis and metabolism[35-38]; other genes are categorized into ion transport (CNGA3 and SLC12A7)[39, 40], NAD metabolism (NNMT, NQO2)[41, 42], and redox and tyrosine metabolism (FAH)[43], indicating that aberrant gene expressions in multiple metabolic pathways affect the prognosis of glioma. Among these metabolic genes, most have not been reported to be associated with prognosis of glioma patients, and only ACOX2 is involved in the prognosis of breast cancer[44]. Although few of these genes we screened for cancer prognosis are reported, to some extent they can reflect the status of the cancer-driven genes related to their upstream and downstream. These genes we screened are enriched in multiple cancer-related pathways. According to these results, we draw the conclusion that the survival of glioma patients can be accurately predicted by the risk score, perhaps because the score can reflect the multi-level status of glioblastoma. However, it is unclear how these genes play their own role in the mechanism and so exploring the impact of metabolic enzymes on survival requires more investigations.
Limitations of this study exist. Firstly, it is a retrospective study. Thus, information including time to recurrence, treatment records and detailed pathological stage was unavailable. Secondly, although the model was validated across cohorts, it still need more samples to further confirm before clinical utilization. Last but not least, the genes in the model was optimized, but still it is a locally optimal solution instead a global optimal solution. One of the evidence is that the p values of these 20 genes in multivariate regression was mostly >0.05.
Conclusions
Our results show that the risk score based on 20 metabolic genes' expression is effective for predicting the survival of glioma patients. Meanwhile, the risk score is independent from other clinical indicators. Moreover, the score can reflect the multi-level status of glioblastoma. Our research might provide a new approach to the prognosis of glioma patients and motivate basic medical research on the prognosis of glioma.
Abbreviations
TCGA: The Cancer Genome Atlas
KEGG: Kyoto Encyclopedia of Genes and Genomes
GSEA: Gene Set Enrichment Analysis
WHO: World Health Organization
MGMT: Methylation of O-6-methylguanine-DNA methyltransferase
UCSC: University of California Santa Cruz
GEO: Gene Expression Omnibus
AUROC: area under receiving operating characteristic
PFS: progression-free survival
Supplementary Material
Supplementary figures and tables.
Acknowledgements
This work was supported by grant Knowledge Database for Precision Medicine of Disease 2016YFC0901900 to Lei Liu.
Authors' Contribution
WX wrote the main manuscript text and contributed to data analysis. ZL and HR wrote the main manuscript text and prepared data interpretation. XP and AW contributed to getting data and modifying the figures. DM, GL and LL contributed to experiment design. All authors read and approved the final manuscript.
Ethics approval and consent to participate
Not applicable. All data generated or analyzed during this study are included in published article. It is available TCGA Xena website (https://tcga.xenahubs.net/) and GEO (https://www.ncbi.nlm.nih.gov/geo/) with the following accession numbers: GSE4271, GSE4412, GSE16011.
Competing Interests
The authors have declared that no competing interest exists.
References
1. Chen W, Zheng R, Baade PD, Zhang S, Zeng H, Bray F. et al. Cancer statistics in China, 2015. CA Cancer J Clin. 2016;66:115-32
2. Omuro A, DeAngelis LM. Glioblastoma and other malignant gliomas: a clinical review. Jama. 2013;310:1842-50
3. Qi L, Ding L, Wang S, Zhong Y, Zhao D, Gao L. et al. A network meta-analysis: the overall and progression-free survival of glioma patients treated by different chemotherapeutic interventions combined with radiation therapy (RT). Oncotarget. 2016;7:69002-13
4. Ioannidis JP, Trikalinos TA. The appropriateness of asymmetry tests for publication bias in meta-analyses: a large survey. CMAJ: Canadian Medical Association journal = journal de l'Association medicale canadienne. 2007;176:1091-6
5. Diao J, Xia T, Zhao H, Liu J, Li B, Zhang Z. Overexpression of HLA-DR is associated with prognosis of glioma patients. International journal of clinical and experimental pathology. 2015;8:5485-90
6. Zhao M, Xu H, Liang F, He J, Zhang J. Association of osteopontin expression with the prognosis of glioma patient: a meta-analysis. Tumour biology: the journal of the International Society for Oncodevelopmental Biology and Medicine. 2015;36:429-36
7. Sun J, Shi H, Lai N, Liao K, Zhang S, Lu X. Overexpression of microRNA-155 predicts poor prognosis in glioma patients. Medical oncology (Northwood, London, England). 2014;31:911
8. Ceccarelli M, Barthel FP, Malta TM, Sabedot TS, Salama SR, Murray BA. et al. Molecular Profiling Reveals Biologically Discrete Subsets and Pathways of Progression in Diffuse Glioma. Cell. 2016;164:550-63
9. Esmaeili M, Hamans BC, Navis AC, van Horssen R, Bathen TF, Gribbestad IS. et al. IDH1 R132H mutation generates a distinct phospholipid metabolite profile in glioma. Cancer research. 2014;74:4898-907
10. Yan H, Parsons DW, Jin G, McLendon R, Rasheed BA, Yuan W. et al. IDH1 and IDH2 mutations in gliomas. The New England journal of medicine. 2009;360:765-73
11. Shibahara I, Sonoda Y, Kanamori M, Saito R, Yamashita Y, Kumabe T. et al. IDH1/2 gene status defines the prognosis and molecular profiles in patients with grade III gliomas. International journal of clinical oncology. 2012;17:551-61
12. Hofer S, Lassman AB. Molecular markers in gliomas: impact for the clinician. Targeted oncology. 2010;5:201-10
13. Hegi ME, Diserens AC, Gorlia T, Hamou MF, de Tribolet N, Weller M. et al. MGMT gene silencing and benefit from temozolomide in glioblastoma. The New England journal of medicine. 2005;352:997-1003
14. Vlashi E, Lagadec C, Vergnes L, Matsutani T, Masui K, Poulou M. et al. Metabolic state of glioma stem cells and nontumorigenic cells. Proceedings of the National Academy of Sciences of the United States of America. 2011;108:16062-7
15. Foth M, Wouters J, de Chaumont C, Dynoodt P, Gallagher WM. Prognostic and predictive biomarkers in melanoma: an update. Expert review of molecular diagnostics. 2016;16:223-37
16. Li L, Guennel T, Marshall S, Cheung LW. A multi-marker molecular signature approach for treatment-specific subgroup identification with survival outcomes. The pharmacogenomics journal. 2014;14:439-45
17. Liu H, Li G, Zeng W, Zhang P, Fan F, Tu Y. et al. Combined detection of Gab1 and Gab2 expression predicts clinical outcome of patients with glioma. Medical oncology. 2014;31:77
18. Possemato R, Marks KM, Shaul YD, Pacold ME, Kim D, Birsoy K. et al. Functional genomics reveal that the serine synthesis pathway is essential in breast cancer. Nature. 2011;476:346-50
19. Liu G, Dong CP, Wang X, Hou GJ, Zheng Y, Xu HL. et al. Regulatory activity based risk model identifies survival of stage II and III colorectal carcinoma. Oncotarget. 2017;8:98360-70
20. Wu BL, Abbott T, Fishman D, McMurray W, Mor G, Stone K. et al. Comparison of statistical methods for classification of ovarian cancer using mass spectrometry data. Bioinformatics. 2003;19:1636-43
21. Ishwaran H, Gerds TA, Kogalur UB, Moore RD, Gange SJ, Lau BM. Random survival forests for competing risks. Biostatistics. 2014;15:757-73
22. Subramanian A, Tamayo P, Mootha VK, Mukherjee S, Ebert BL, Gillette MA. et al. Gene set enrichment analysis: a knowledge-based approach for interpreting genome-wide expression profiles. Proceedings of the National Academy of Sciences of the United States of America. 2005;102:15545-50
23. Phillips HS, Kharbanda S, Chen R, Forrest WF, Soriano RH, Wu TD. et al. Molecular subclasses of high-grade glioma predict prognosis, delineate a pattern of disease progression, and resemble stages in neurogenesis. Cancer Cell. 2006;9:157-73
24. Freije WA, Castro-Vargas FE, Fang Z, Horvath S, Cloughesy T, Liau LM. et al. Gene expression profiling of gliomas strongly predicts survival. Cancer Res. 2004;64:6503-10
25. Gravendeel LA, Kouwenhoven MC, Gevaert O, de Rooi JJ, Stubbs AP, Duijm JE. et al. Intrinsic gene expression profiles of gliomas are a better predictor of survival than histology. Cancer Res. 2009;69:9065-72
26. Kim W, Liau LM. IDH mutations in human glioma. Neurosurgery clinics of North America. 2012;23:471-80
27. Dang L, White DW, Gross S, Bennett BD, Bittinger MA, Driggers EM. et al. Cancer-associated IDH1 mutations produce 2-hydroxyglutarate. Nature. 2009;462:739-44
28. Shao W, Gu J, Huang C, Liu D, Huang H, Huang Z. et al. Malignancy-associated metabolic profiling of human glioma cell lines using 1H NMR spectroscopy. Molecular cancer. 2014;13:197
29. Li Z, Yan X, Sun Y, Yang X. Expression of ADP-ribosyltransferase 1 Is Associated with Poor Prognosis of Glioma Patients. The Tohoku journal of experimental medicine. 2016;239:269-78
30. Bou Samra E, Klein B, Commes T, Moreaux J. Development of gene expression-based risk score in cytogenetically normal acute myeloid leukemia patients. Oncotarget. 2012;3:824-32
31. Bou Samra E, Klein B, Commes T, Moreaux J. Identification of a 20-gene expression-based risk score as a predictor of clinical outcome in chronic lymphocytic leukemia patients. BioMed research international. 2014;2014:423174
32. Kim SK, Kim SY, Kim JH, Roh SA, Cho DH, Kim YS. et al. A nineteen gene-based risk score classifier predicts prognosis of colorectal cancer patients. Molecular oncology. 2014;8:1653-66
33. Kim YM, Cheon CK, Park KH, Park S, Kim GH, Yoo HW. et al. Novel and Recurrent ACADS Mutations and Clinical Manifestations Observed in Korean Patients with Short-chain Acyl-coenzyme a Dehydrogenase Deficiency. Annals of clinical and laboratory science. 2016;46:360-6
34. Monte MJ, Alonso-Pena M, Briz O, Herraez E, Berasain C, Argemi J. et al. ACOX2 deficiency: An inborn error of bile acid synthesis identified in an adolescent with persistent hypertransaminasemia. Journal of hepatology. 2017;66:581-8
35. Okajima T, Nakamura Y, Uchikawa M, Haslam DB, Numata SI, Furukawa K. et al. Expression cloning of human globoside synthase cDNAs. Identification of beta 3Gal-T3 as UDP-N-acetylgalactosamine:globotriaosylceramide beta 1,3-N-acetylgalactosaminyltransferase. The Journal of biological chemistry. 2000;275:40498-503
36. Costanzi E, Urbanelli L, Bellezza I, Magini A, Emiliani C, Minelli A. Hypermethylation contributes to down-regulation of lysosomal beta-hexosaminidase alpha subunit in prostate cancer cells. Biochimie. 2014;101:75-82
37. Pan S, Cheng X, Chen H, Castro PD, Ittmann MM, Hutson AW. et al. ERManI is a target of miR-125b and promotes transformation phenotypes in hepatocellular carcinoma (HCC). PloS one. 2013;8:e72829
38. Saliba M, Ramalanjaona N, Gulberti S, Bertin-Jung I, Thomas A, Dahbi S. et al. Probing the acceptor active site organization of the human recombinant beta1,4-galactosyltransferase 7 and design of xyloside-based inhibitors. The Journal of biological chemistry. 2015;290:7658-70
39. Boettger T, Hubner CA, Maier H, Rust MB, Beck FX, Jentsch TJ. Deafness and renal tubular acidosis in mice lacking the K-Cl co-transporter Kcc4. Nature. 2002;416:874-8
40. Shaikh RS, Reuter P, Sisk RA, Kausar T, Shahzad M, Maqsood MI. et al. Homozygous missense variant in the human CNGA3 channel causes cone-rod dystrophy. European journal of human genetics: EJHG. 2015;23:473-80
41. Kannt A, Pfenninger A, Teichert L, Tonjes A, Dietrich A, Schon MR. et al. Association of nicotinamide-N-methyltransferase mRNA expression in human adipose tissue and the plasma concentration of its product, 1-methylnicotinamide, with insulin resistance. Diabetologia. 2015;58:799-808
42. Megarity CF, Gill JR, Caraher MC, Stratford IJ, Nolan KA, Timson DJ. The two common polymorphic forms of human NRH-quinone oxidoreductase 2 (NQO2) have different biochemical properties. FEBS letters. 2014;588:1666-72
43. Perez-Carro R, Sanchez-Alcudia R, Perez B, Navarrete R, Perez-Cerda C, Ugarte M. et al. Functional analysis and in vitro correction of splicing FAH mutations causing tyrosinemia type I. Clinical genetics. 2014;86:167-71
44. Parada H Jr, Sun X, Fleming JM, Williams-DeVane CR, Kirk EL, Olsson LT. et al. Race-associated biological differences among luminal A and basal-like breast cancers in the Carolina Breast Cancer Study. Breast cancer research: BCR. 2017;19:131
Author contact
![]() Corresponding authors: Lei Liu, e-mail: liulei_sibscom; Gang Liu, e-mail: liugangedu.cn; Duan Ma, e-mail: duanmaedu.cn.
Corresponding authors: Lei Liu, e-mail: liulei_sibscom; Gang Liu, e-mail: liugangedu.cn; Duan Ma, e-mail: duanmaedu.cn.