3.2
Impact Factor
ISSN: 1837-9664
J Cancer 2020; 11(10):3027-3040. doi:10.7150/jca.40866 This issue Cite
Research Paper
Expression Status And Prognostic Value Of M6A-associated Genes in Gastric Cancer
1. Department of pharmacy, the First Affiliated Hospital of Zhengzhou University
2. Precision Medicine Center, the First Affiliated Hospital of Zhengzhou University
3. Key Laboratory of Clinical Medicine, the First Affiliated Hospital of Zhengzhou University
† These authors contributed equally to this work.
✉ Corresponding author: Ranran Sun, Precision Medicine Center, the First Affiliated Hospital of Zhengzhou University, Zhengzhou 450052, China. Tel & Fax: +86-371-67966905. E-mail address: fccsunrr@zzu.edu.cn; Xichun Cui, Key Laboratory of Clinical Medicine, the First Affiliated Hospital of Zhengzhou University, Zhengzhou 450052, China. Tel & Fax: +86-371-67966905. E-mail address: xichun639@163.com
Received 2019-10-3; Accepted 2020-2-8; Published 2020-3-4
Abstract
Purpose: Gastric cancer (GC) is a primary cause of cancer-associated mortality worldwide. N6-methyladenosine (m6A) is one of the most common RNA modifications that involves in the progression of numerous cancers. However, the expression status and function of m6A-related genes in gastric cancer is still not well understood. The current study is aimed to investigate the expression status and determinate prognostic value of m6A-related genes in gastric cancer.
Methods: m6A-asssociated gene expression was evaluated via analyzing the expression data of GC patients from the Cancer Genome Atlas (TCGA) and Gene Expression Omnibus (GEO) database. The protein expression levels of m6A-associated molecules were further validated by immunohistochemical (IHC) staining data from GC tissue microarray (TMA) cohort and Human Protein Atlas (HPA) database. Kaplan-Meier analysis was performed to assess the prognostic value of m6A-associated genes in gastric cancer. Risk score model was established by lasso COX regression analysis and its prognostic predicted efficiency was assessed by the receiver-operator characteristic (ROC) curve. Cox regression analyses were used for exploring risk factors related to GC patient prognosis.
Results: Most of m6A-related genes were upregulated at both mRNA and protein levels in gastric cancer tissues compared with that in normal gastric tissues. The expression levels of m6A-related genes were associated with clinicopathological features including race, age and TNM stage. High expression of WTAP and FTO predicted poor prognosis of GC patients. Survival analysis demonstrated that patients with high-risk scores had worse overall survival (OS) and ROC curves suggested the prediction performance for gastric patients. Moreover, Cox regression analyses indicated that m6A risk model score was a prognostic factor for OS and FTO upregulation might be a potential independent prognostic factor for recurrence-free survival (RFS) in gastric cancer patients.
Conclusion: m6A-related genes were dysregulated in GC and were closely associated with prognosis of GC patients. FTO might serve as a novel prognostic biomarker for gastric cancer, while the m6A-related risk score might be informative for risk assessment and prognostic stratification.
Keywords: gastric cancer, N6-methyladenosine, prognostic, WTAP, FTO.
Introduction
Gastric cancer (GC) ranks fifth and third among all cancers in terms of incidence and mortality respectively worldwide in 2018 [1, 2]. The development and progression of GC is a complicated multistep process, including a plenty of genetic and epigenetic changes [3]. During the past decades, various strategies have been made for GC treatment, and the early diagnosis and treatment of GC have been improved significantly [4]. Though early stage GC patients can be cured and have a good prognosis, early diagnosis is very challenging [5]. GC patients at late stage have poor prognosis and higher mortality due to the lack of efficient diagnosis at early stage [6]. Therefore, developing an efficient and potent strategy for GC early diagnosis and treatment is urgently needed.
N6-methyladenosine (m6A) modification is the methylation of the adenosine base at the nitrogen-6 position of mRNA which was first discovered as an abundant nucleotide modification in eukaryotic messenger RNA in 1974[7-9]. M6A modifications is regulated by three types of enzymes: “writers” (methyltransferases, including WTAP, KIAA1429, RBM15/15B, and METTL3/14/16), “readers” (YTH domain containing RNA binding proteins and heterogeneous nuclear ribonucleoprotein, including YTHDF1/2/3, YTHDC1, HNRNPC and HNRNPA2B1) and “erasers” (demethylases, including ALKBH5 and FTO) [10-12].
Studies have shown that m6A modification has the character of dynamically reversible as same as the DNA and histone modifications [13]. It plays a pivotal role in regulating precursor mRNA maturation, translation and degradation [14]. In addition, m6A modification could also affect tissue development [15], cell self-renewal and differentiation, control of heat shock response [16], DNA damage response [17], circadian clock controlling and the development of multiple forms of human diseases, including cancer [7]. Emerging evidence has demonstrated that m6A modification play a critical role in a great variety of human cancers [14], including breast cancer [18, 19], lung cancer [20], acute myeloid leukemia (AML) [21, 22], glioblastoma [23], hepatoblastoma [24], colorectal cancer [25] and so on [14]. However, the function of m6A methylation in gastric cancer initiation, progression and prognosis is still not fully understood.
Herein, we first explored the expression pattern of m6A-related genes by bioinformatics analysis of TCGA and GEO database. The expression pattern was further confirmed by immunohistochemical (IHC) staining of GC tissue microarray cohort. The correlation between m6A-associated genes expression and clinicopathological features was analyzed and high expression of WTAP and FTO predicted poor prognosis of GC patients. Moreover, our results also demonstrated that the dysregulated expression of m6A-related genes could affect the overall survival (OS) and recurrence-free survival (RFS) of GC patients. Our findings suggest that FTO might serve as a novel prognostic biomarker for gastric cancer, while the m6A-related risk score might be informative for risk assessment and prognostic stratification.
Materials and Methods
Expression data sets download and bioinformatics analysis
The TCGA-GC cohort data of 32 normal patients and 368 GC patients and all relevant clinical date were downloaded from The Cancer Genome Atlas (TCGA, https://tcga-data.nci.nih.gov/tcga/). 6 sets of independent microarrays, including GSE112369, GSE26899, GSE79973, GSE103236, GSE55696, GSE15459, were extracted from the Gene Expression Omnibus (GEO, https://www.ncbi.nlm.nih.gov/geo/) database. The characteristics of 6 microarrys, including accession number, RNA-Seq platform, number of samples, country and publication year, were collected in Table 1. The expression profiles of m6A-related genes were analyzed by these datasets and the clinical prognosis of GC patient were evaluated through these datasets. The downloaded raw data pre-procession and bioinformatics analysis were conducted using the R studio software (3.51) as previous described [26].
GEO microarray data enrolled to identify altered m6A targets in Gastric cancer.
| Accession number | Platform | Number of samples | Country | Years | |
|---|---|---|---|---|---|
| Non-tumor | Gastric cancer | ||||
| GSE112369 | Affymetrix | 26 | 36 | Japan | 2018 |
| GSE26899 | Illumina | 12 | 96 | USA | 2016 |
| GSE79973 | Affymetrix | 10 | 10 | China | 2016 |
| GSE103236 | Agilent | 9 | 10 | Romania | 2017 |
| GSE55696 | Agilent | 19 | 58 | China | 2017 |
| GSE15459 | Affymetrix | 200 | Switzerland | 2009 | |
| Total | 76 | 410 | |||
TMA cohorts
The tissue microarray (TMA), containing 20 gastric cancer specimens and 20 corresponding normal gastric tissue specimens, were acquired from April 2016 to December 2016 at the First Affiliated Hospital of Zhengzhou University. 4 paired gastric cancer tissues and adjacent normal tissues were obtained at December 2019. All the patients did not receive any immunotherapy, chemotherapy and radio therapy before surgery. This study was approved by The Institutional Review Board of the First Affiliated Hospital of Zhengzhou University and all the patients signed informed consent. In addition, we further verified the protein expression of m6A-related molecules through analyzing another GC TMA cohort from the Human Protein Atlas (HPA, https://www.proteinatlas.org/) database. The clinicopathological features of 20 gastric cancer patients were described in Supplementary Table 1.
Immunohistochemical (IHC) staining and Western blot
TMA sections (5 μm thick) were deparaffinized and hydrated. 0.3% hydrogen peroxide was used to block endogenous peroxidases activity and antigen retrieval. TMA sections were incubated with primary antibody overnight at 4°C after blocking for one hour at room temperature. Then, TMA sections were incubated with secondary biotinylated goat anti-Rabbit antibody, and then detected by SignalStain® DAB (Cell Signaling Technology, Danvers, MA) and counterstained with haematoxylin QS (Vector Laboratories). The IHC staining results were evaluated independently by two pathologists who were blinded to the clinicopathologic data. According to the proportion of positive cells, samples were scored as follows: 0+, none; 1+, <25%; 2+, 25%-50%; 3+, 51%-75%; and 4+, 75%-100%. The staining intensity was evaluated as follows: 0, none; 1, weak; 2, medium; and 3, strong. The final score (range 0-12) was calculated by multiplying the two sub-scores. Samples were classified as low expression (0-3), moderate expression (4-6) and high expression (9-12) respectively. Western blot was performed as the following procedure. Briefly, the protein of fresh tissues was acquired by using protein extraction reagent (Beyotime, Beijing, China) with a protease inhibitor cocktail (Roche, Indianapolis, IN, USA). Same amount of protein was electrophoresed on 10% SDS-PAGE gels and afterwards transferred to polyvinylidene difluoride membranes (Millipore, Billerica, MA, USA). Phosphate buffer saline (PBS) containing 5% skim milk was used for blocking the membranes for 1 hour. Then the membrances were incubated with primary antibody overnight at 4°C. After secondary antibody (Santa Cruz Biotechnology, Santa Cruz, CA, USA) incubation for 1 hours, the membranes were used to expose the photographic film. All antibodies used in our study were described in Supplementary Table 2.
Statistical analysis
SPSS software (version 23.0, Inc., Chicago, IL) and GraphPad Prism 7 Software (GraphPad Software, Inc, La Jolla, CA, USA) were used for statistical analysis. The Student's t test (unpaired, two-tailed) was used for analyzing the difference between two independent groups. The TMA analysis was accomplished by the Fisher's exact test. We obtained the best cut-off value for each gene and its survival curves through RStudio (0.99.447). Overall survival (OS) analysis and recurrence free survival (RFS) analysis were finished through the Kaplan-Meier method. The prognostic model was performed by RStudio and ROC curve was applied to confirm prognostic efficiency. In addition, the independent factors were sought through Cox regression analysis of univariate and multivariate. In all cases, “P<0.05” was considered as statistically significant.
Results
Bioinformatics analysis of the expression pattern of m6A-associated genes in gastric cancer
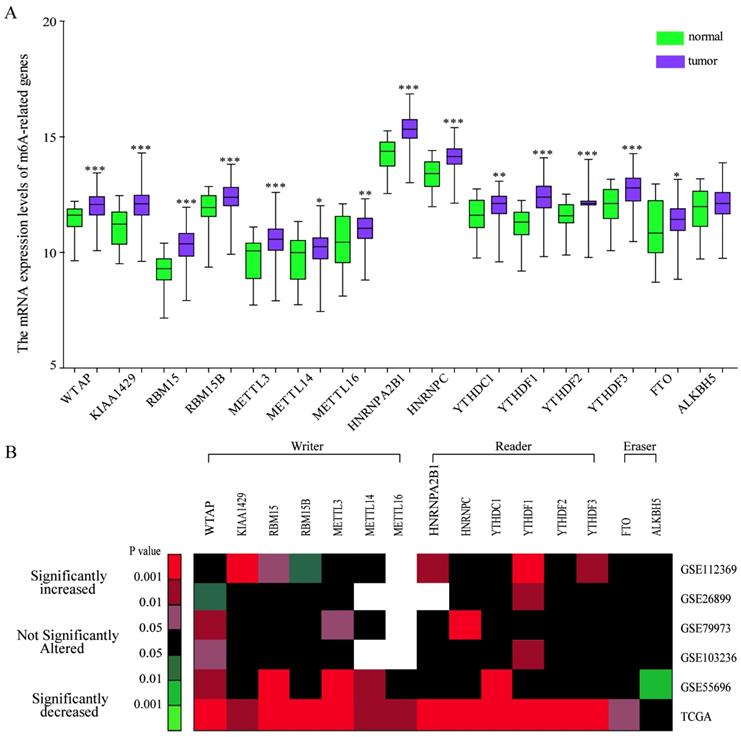
To explore the expression pattern of m6A-related genes in human GC, we first extracted and analyzed the expression data of m6A-related genes from the Cancer Genome Atlas (TCGA) database. As shown in Figure 1A, the expression levels of all the known m6A-related genes including “writer”, “reader'', and “eraser” were upregulated in GC tissues compared with that in normal gastric tissues except ALKBH5. We further verified the expression pattern of m6A-related genes in 5 independent GC GEO datasets with microarray platforms and GEO datasets analysis showed a similar expression pattern of m6A-related genes (Figure 1B). Together, the results showed that the expression pattern of most m6A-associated genes was upregulated in comparison with that in normal gastric tissues.
IHC analysis of the protein expression of m6A-related molecules in gastric cancer
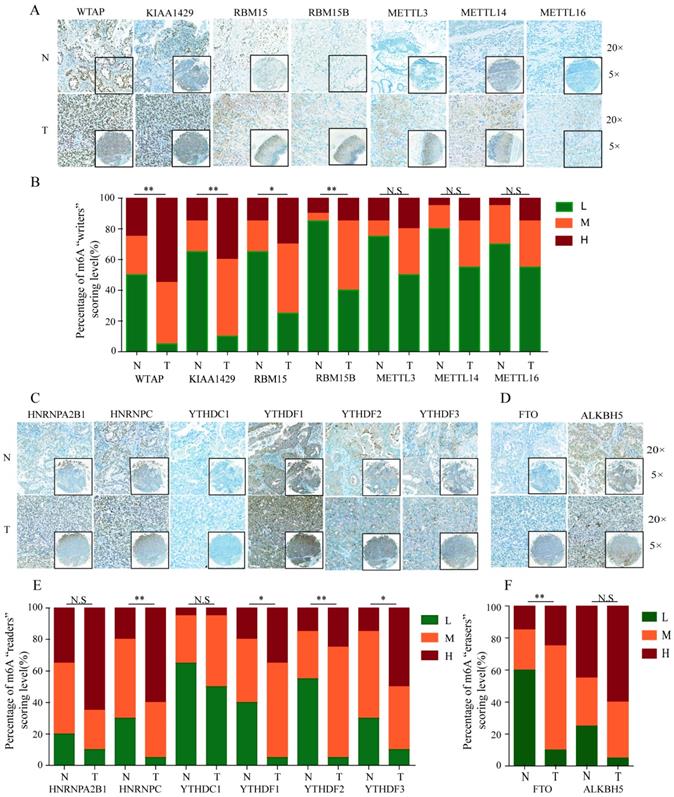
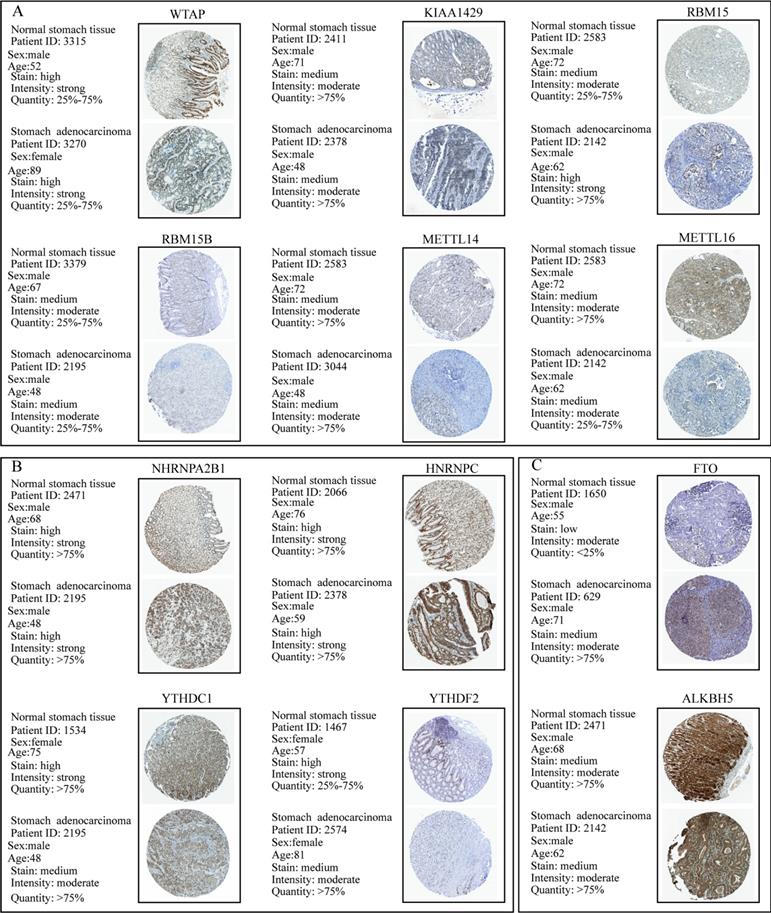
To further validate the expression pattern of m6A-related molecules in GC specimens and normal gastric tissues, we performed immunohistochemical staining analysis of GC TMA from the ZZU cohort and the Human Protein Atlas (HPA) database. IHC staining analysis of m6A “writer” suggested that WTAP, KIAA1429 and RBM15/15B expression were upregulated in GC tumor tissues compared with that in normal gastric tissues at protein level, which was consistent with the expression pattern of genes. However, the protein levels of METTL3/14/16 had no significant changes between GC and normal gastric tissues (Figure 2A and 2B). Of m6A “reader”, HNRNPC and YTHDF1/2/3 were overexpressed at protein level, while HNRNPA2B1 and YTHDC1 had no difference (Figure 2C and 2E). In terms of m6A “eraser”, IHC staining analysis demonstrated that FTO had a significant increase at protein expression levels, but not for ALKBH5 (Figure 2D and 2F). The similar results were obtained by analyzing IHC staining data from the HPA database (Figure 3). Furthermore, we also investigated the protein expression levels of m6A-related genes in fresh tumor tissues and the results indicated that the expression level of WTAP and FTO were markedly higher in GC tissues compared with normal control tissues (Supplementary Figure 1).
Relationship between the expression of m6A-associated genes and clinicopathological features in GC
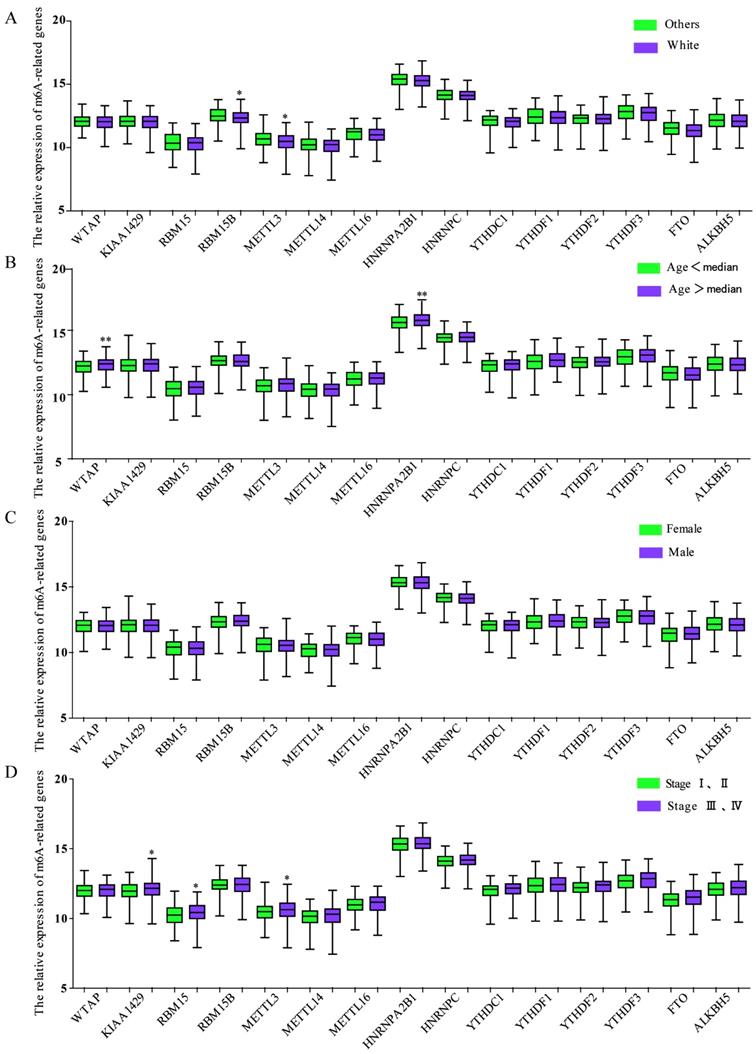
We also investigated the relationship between the expression of m6A-associated genes and clinicopathological features in GC. As shown in Figure 4A, race was related to the expression of RBM15B and METTL3, and the White had a significant downregulated expression of RMB15B and METTL3. The expression of WTAP or HNRNPA2B1 was associated with age, while the group with age over median had a significant upregulated expression of WTAP and HNRNPA2B1 (Figure 4B). There was no significant correlation between expression of m6A-related genes and genders (Figure 4C). Intriguingly, TNM stage was associated with the expression of KIAA1429, RBM15 and METTL3 and the group with TNM stage III and IV had a significant enhanced expression (Figure 4D).
Bioinformatics analysis of the expression pattern of m6A-associated genes in human GC tissues. (A) Bioinformatics analysis of the mRNA expression pattern of m6A-associated genes in GC and normal tissues based on the data from TCGA-GC cohort. (B) Heatmap exhibiting the mRNA expression alteration of m6A-associated genes in five independent GEO microarray datasets. Red indicates up-regulated; green indicates down-regulated; black indicates not significant; blank indicates genes are not expressed or absent in the datasets. Statistical analysis was performed in Student's t test (unpaired, two-tailed).
IHC analysis of the protein expression of m6A-related molecules in GC and normal tissues. (A) Representative IHC staining of m6A-related “writers” in GC and normal tissues in TMA cohort. (B) Comparison of the relative expression of m6A-related “writers” between GC and normal tissues in TMA cohort. (C) Representative IHC staining of m6A-related “readers” in GC and normal tissues in TMA cohort. (E) Comparison of the relative expression of m6A-related “readers” between GC and normal tissues in TMA cohort. (D) Representative IHC staining of m6A-related “erasers” in GC and normal tissues in TMA cohort. (F) Comparison of the relative expression of m6A-related “erasers” between GC and normal tissues in TMA cohort. (N-normal, T-tumor, *P<0.05, **P<0.01, ***P<0.001, N.S: no significance).
Relationship between the expression of m6A-associated genes and prognosis in GC
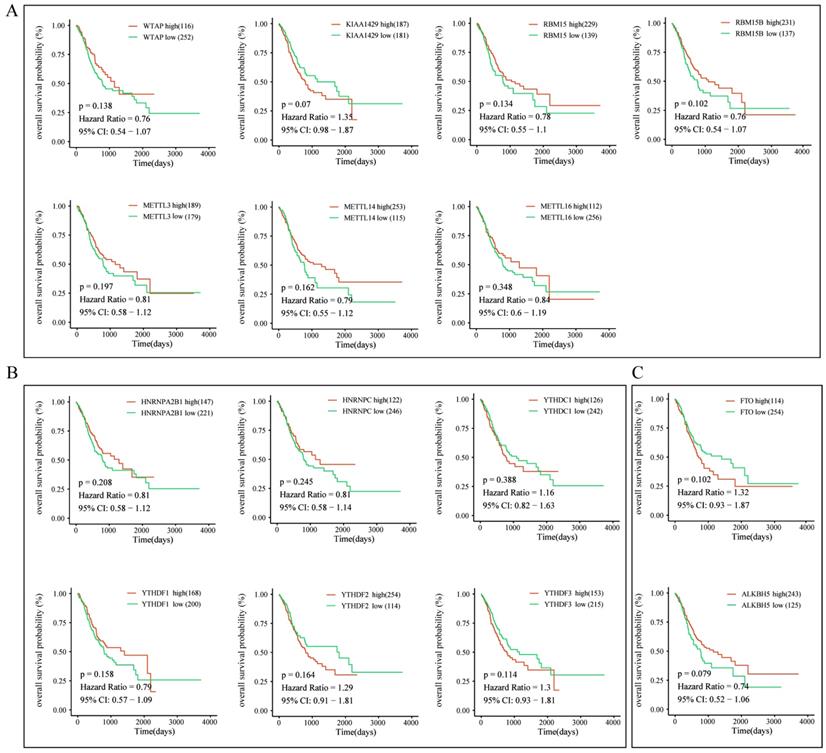
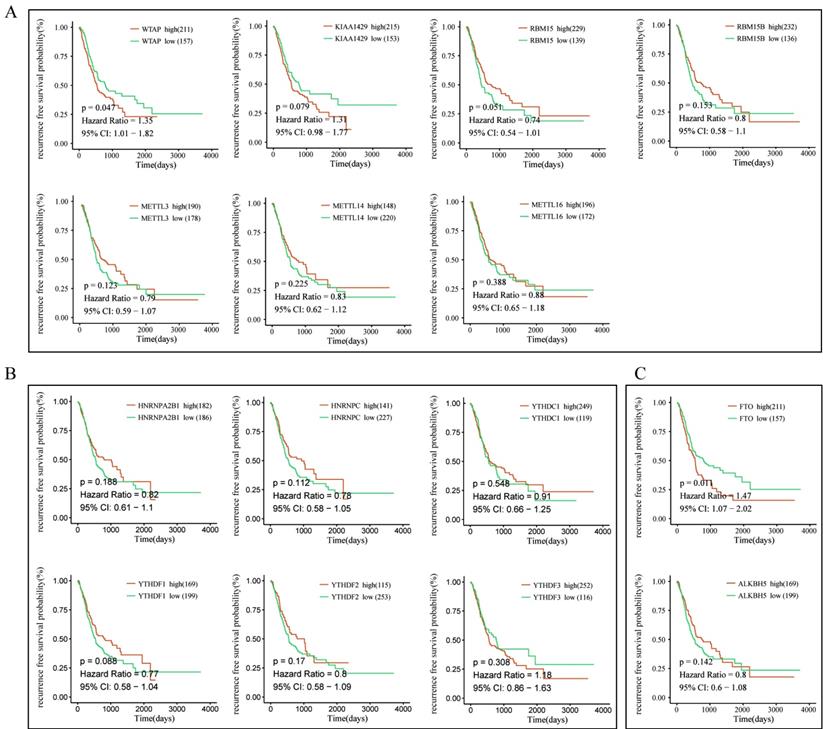
To further explore the prognostic role of m6A-associated genes in GC, we analyzed the correlation of m6A-related gene expression with corresponding clinical follow-up information through Kaplan-Meier analysis. GC patients were classified into the high expression group and the low expression group according to the best cut-off value. The results revealed that the expression levels of m6A-related genes were not significantly related with overall survival (OS) in GC (Figure 5A-5C). However, high levels of WTAP or FTO predicted poor recurrence-free survival (RFS) rates in GC patients (Figure 6A-6C).
Prognostic predictor for GC patients
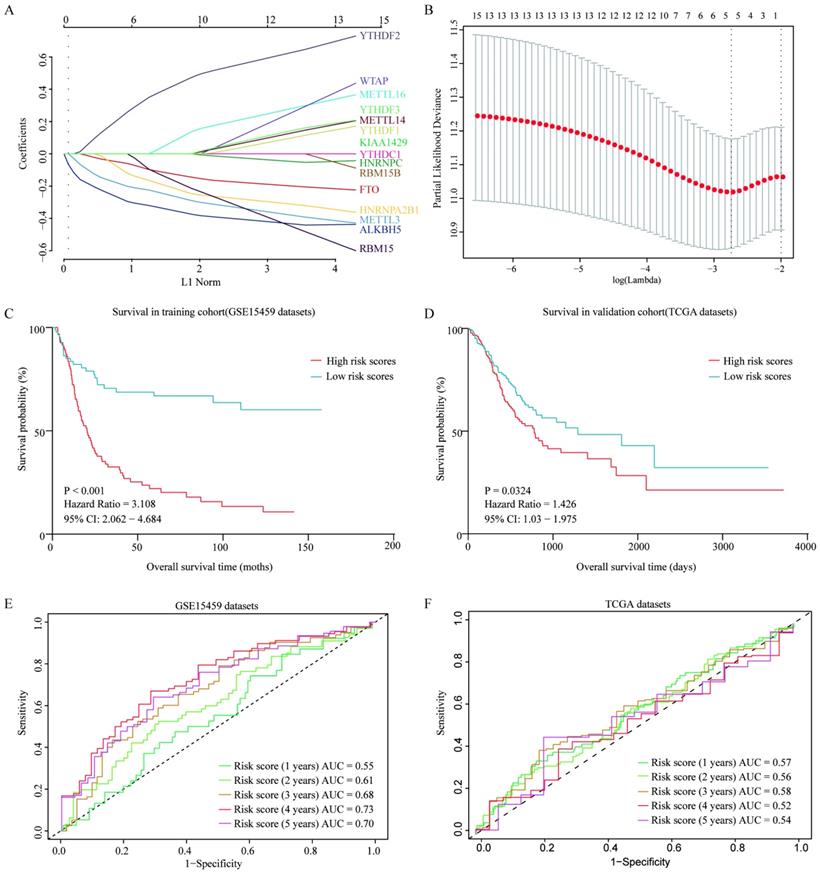
To further evaluate the prognostic value of m6A-associated genes, we established a survival risk score model by Lasso Cox regression as follow: risk score = -0.2628 × Expression of ALKBH5 - 0.04741× Expression of FTO - 0.07108 × Expression of HNRNPA2B1 - 0.17652 × Expression of METTL3 + 0.19988 × Expression of YTHDF2 (Figure 7A and 7B). GC Patients were divided into two groups by a median of risk score. High risk score of patients had a significant shorter overall survival than that in patients with low risk score (P<0.001) in both GSE15459 and TCGA cohort (Figure 7C and 7D). Moreover, the performance of this prognostic predictor was confirmed by ROC curve analysis. As shown in Figure 7E, the area under the ROC curve (AUC) were 0.55, 0.61,0.68, 0.73 and 0.70 in the 1-, 2-, 3-, 4- and 5-year, respectively in GSE15459 cohort, which indicated its potential to predict prognosis. The ROC curve analysis results were consistent in TCGA cohort (Figure 7F). Thus, the risk score model showed some predicting power.
IHC analysis of the protein expression of m6A-related molecules in The Human Protein Atlas database. (A) Information and representative IHC staining of m6A-related “writers” in The Human Protein Atlas database. (B) Information and representative IHC staining of m6A-related “readers” in The Human Protein Atlas database. (C) Information and representative IHC staining of m6A-related “erasers” in The Human Protein Atlas database.
The relationship between m6A-associated genes expression and clinicopathological features in GC. (A)The relationship between the expression of m6A-associated genes and race was analyzed. (B) The relationship between the expression of m6A-associated genes and age was analyzed. (C) The relationship between the expression of m6A-associated genes and sex was analyzed. (F) The relationship between the expression of m6A-associated genes and TNM stage was analyzed. *P<0.05.
Risk factor analysis of m6A-associated genes in GC
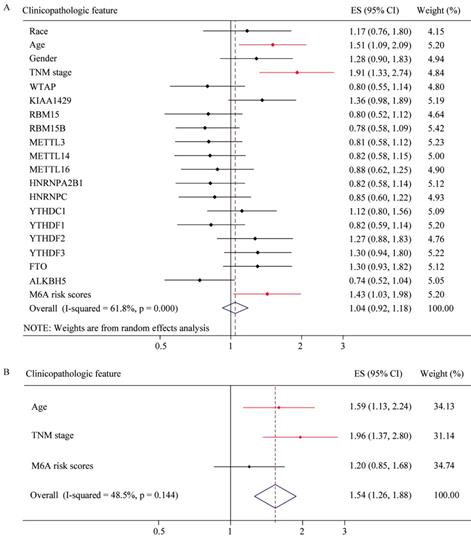
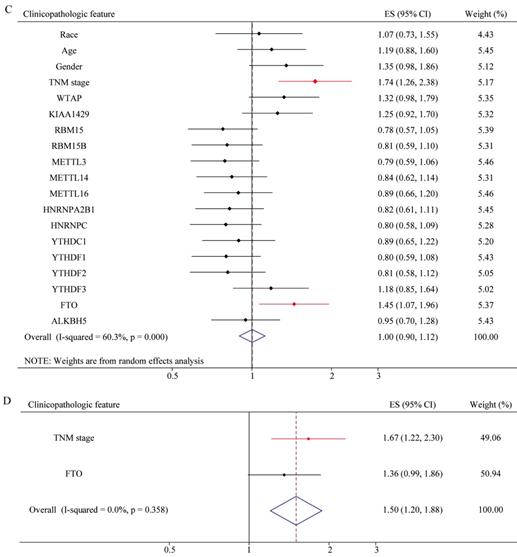
To explore whether risk factor was associated with GC patient prognosis, we performed univariate and multivariate Cox regression. The results of univariate Cox regression revealed that m6A risk score was significant risk factor for OS (Figure 8A). TNM (tumor, node, and metastasis) stage was significant risk factor for OS and RFS (Figure 8A and 8C, Table 2 and 3). High expression of FTO was significant risk factor for RFS (Figure 8C). The results of multivariate Cox regression indicated that TNM stage was an independent risk factor for OS and RFS (Figure 8B and 8D, Table 2 and 3), and FTO overexpression (HR=1.356, P=0.057, 95%CI: 0.991-1.857) might be an independent risk factor for RFS (Figure 8D).The results of Univariate and Multivariate Cox regression indicated that age might be a confounder factor (Table 2). Further, stratified analysis suggested that TNM stage and RBM15B were independent risk factors for OS in patients with age≤median, and TNM stage also was a risk factor factors for OS in patients with age >median (Supplementary table 3 and 4). Furthermore, we conducted hallmark pathway, KEGG and GO analysis via GSVA. The result suggested that m6A risk score related with gene signature was involved in multiple signaling pathways (Supplementary Figure 2).
The correlation between the expression levels of m6A-related genes and overall survival (OS) rates in GC patients. (A) The correlation between the expression levels of m6A “writers” and OS rates in GC patients. (B) The correlation between the expression levels of m6A “readers” and OS rates in GC patients. (C) The correlation between the expression levels of m6A “erasers” and OS rates in GC patients. (red: high expression; green: low expression).
The correlation between the expression levels of m6A-related genes and relapse free survival (RFS) rates in GC patients. (A) The correlation between the expression levels of m6A “writers” and RFS rates in GC patients. (B) The correlation between the expression levels of m6A “readers” and RFS rates in GC patients. (C) The correlation between the expression levels of m6A “erasers” and RFS rates in GC patients. (red: high expression; green: low expression).
Independent prognostic factors for OS by univariate and multivariate analysis in TCGA cohorts
| Risk factors | Clinicopathological features | Univariate analysis | Multivariate analysis | ||||
|---|---|---|---|---|---|---|---|
| HR | 95% (CI) | P value | HR | 95% (CI) | P value | ||
| Race | White | 1.000 | 0.764-1.802 | 0.465 | |||
| Others | 1.173 | ||||||
| Age(years) | ≤median | 1.000 | 1.085-2.093 | 0.014* | 1.000 | 1.123-2.217 | 0.009** |
| >median | 1.507 | 1.578 | |||||
| Gender | Women | 1.000 | 0.904-1.828 | 0.162 | |||
| Men | 1.285 | ||||||
| TNM stage | Stage I and II | 1.000 | 1.328-2.736 | 0.000*** | 1.000 | 1.372-2.812 | p<0.001*** |
| Stage III and IV | 1.914 | 1.964 | |||||
Discussion
N6-methyladenosine (m6A) modification is the most common modification in human mRNA [27], and it is considered as a new layer of epigenetic regulation on mRNA processing, translation [28] and stability [8, 29]. Mounting evidence has proved that dysregulation of m6A modification is closely associated with various human physiological and pathological phenomena, including obesity, immuno-dysregulation, carcinogenesis[30, 31] and so on [32, 33]. As the development of the m6A-sequencing (m6A-seq) technology, it has been achieved to explore the roles of m6A mRNA modification in cancer biology [34, 35]. In recent years, emerging studies have suggested that m6A-related genes have crucial roles in the initiation and progression of cancers. For example, it has been reported that METTL3 not only promotes the growth and tumorigenesis of acute myeloid leukaemia cells but also suppresses renal cell carcinoma [22, 36]. METTL14 has been found to suppress the metastatic potential of hepatocellular carcinoma and increase the tumorigenesis of glioblastoma stem cells [11, 30]. However, the function of m6A-related genes in gastric cancer initiation and progression are not fully known yet. In this study, we first explored the roles of m6A-related genes in the regulation of GC.
Construction and verification of a survival risk score model as prognostic predictor for gastric patients. (A) Ten-time cross-validation for tuning parameter selection in the LASSO model. (B) LASSO coefficient profiles of 15 prognostic genes. (C) Survival analysis in GSE15459 cohort. (D) Survival analysis in TCGA cohort. (E) ROC curves in GSE15459 cohort. (F) ROC curves in TCGA cohort.
Univariate and multivariate Cox regression analyses of the TCGA database. (A) Univariate Cox regression analysis of the OS of GC patients. (B) Multivariate Cox regression analysis of the OS of GC patients. (C) Univariate Cox regression analysis of the RFS of GC patients. (D) Multivariate Cox regression analysis of the RFS of GC patients.
Independent prognostic factors for RFS by univariate and multivariate analysis in TCGA cohorts
| Risk factors | Clinicopathological features | Univariate analysis | Multivariate analysis | ||||
|---|---|---|---|---|---|---|---|
| HR | 95% (CI) | P value | HR | 95% (CI) | P value | ||
| Race | White | 1.000 | 0.731-1.551 | 0.744 | |||
| Others | 1.065 | ||||||
| Age(year) | ≤median | 1.000 | 0.884-1.600 | 0.252 | |||
| >median | 1.189 | ||||||
| Gender | Women | 1.000 | 0.980-1.861 | 0.067 | |||
| Men | 1.350 | ||||||
| TNM stage | Stage I and II | 1.000 | 1.264-2.385 | 0.001** | 1.000 | 1.215-2.304 | 0.002** |
| Stage III and IV | 1.736 | 1.673 | |||||
| FTO | Low | 1.000 | 1.068-1.955 | 0.017* | 1.000 | 0.991-1.857 | 0.057 |
| High | 1.445 | 1.356 | |||||
The analysis of TCGA and GEO databases showed that the expression levels of most m6A-related genes were upregulated in GC, including WTAP, KIAA1429, RBM15/5B, METTL3/14/16, HNRNPA2B1, HNRNPC, YTHDC1, YTHDF1/2/3 and FTO[37]. In addition, we also explored the protein expression of m6A-associated molecules in GC tissues through an IHC analysis and found that many m6A-related molecules expression was upregulated at protein level, including WTAP, KIAA1429, RBM15/15B, HNRNPC, YTHDF1/2/3 and FTO. The protein expression was consistent with gene expression level. These findings suggested that m6A-related genes were dysregulated in GC tissues and some of them might have an oncogenic role in GC patients. Consistent with the published results, Jasmin P et al. found that YTHDF2 was not only overexpressed but also essential for disease initiation and progression in human acute myelocytic leukemia (AML)[21]. Zhao et al. reported that YTHDF1 was marked upregulated in hepatocellular carcinoma (HCC) and played a crucial role in regulating HCC cell cycle progression and metabolism[38]. In addition, FTO was found highly expressed in lung squamous cell carcinoma (LUSC) and knockdown FTO suppressed cancel cell viability and invasion[20]. Xiaoyu C et al. revealed that the expression level of KIAA1429 in liver tumor was significantly higher than that in normal liver tissues and high expression of KIAA1429 was significantly related with poor overall survival[39]. Furthermore, it was reported that bladder cancer patients with positive WTAP expression had higher post-operative recurrence compared with those with negative WTAP expression[40]. Our results suggested that m6A-associated genes had a crucial role in initiation and progression of GC. The significant relationship between the expression of some m6A-associated genes and clinicopathological features had been confirmed in GC. For example, down-regulated expression of RBM15B and METTL3 was associated with the race. The age could influence the expression of WTAP and HNRNPA2B1. KIAA1429, RBM15 and METTL3 in GC cohorts with stage III and IV were upregulated compared with that in GC cohorts with stage I and II. Our findings for the first time demonstrated the interrelation of the expression of m6A-related genes and clinicopathological feature and raised the new direction for further research.
Moreover, we found that the upregulated expression of WATP and FTO were significant associated with poor prognosis in GC patients through the Kaplan-Meier method analysis of TCGA datasets. GC patients with high expression of WTAP and FTO had poor recurrence-free survival rates. Numerous studies had demonstrated that the dysregulation of m6A-associated genes were in connection with poor prognosis. For instance, Niu Y et al. found that FTO was overexpressed and significantly related with lower survival rates in patients with breast cancer[41]. FTO might be regarded as a novel target for breast cancer therapy. Li Y et al. found that aberrant expression of FTO as demethylase genes had a significant prognostic value in gastric cancer patients, suggesting that FTO might have a crucial role in GC progression and metastasis[42]. In addition, a large amount of studies suggested that WTAP as a novel oncogenic protein played a vital role in AML, and it also was a crucial factor on poor prognosis of malignant glioma[43]. Based on gene expression profile, we established a risk score model via lasso COX regression that had some predicted performance for prognosis of GC patients[44, 45]. The result of m6A risk score model suggested that m6A-related genes were significantly associated with prognosis of GC patients. Univariate analysis suggested that TNM stage, high expression of FTO and m6A risk score were prognosis factors in GC patients. Multivariate analysis indicated that TNM stage was independent prognostic factors. High expression of FTO (HR=1.356, P=0.057, 95%CI: 0.991-1.857) might be an independent prognostic factor in GC patients.
However, our study has some limitations. Though m6A-related genes have been demonstrated having high prognostic values in GC patients, their accurate mechanism in GC progression and prognosis need to be further studied. Moreover, the molecular mechanism by which m6A-associated genes facilitate GC development should be further explored both in vivo and in vitro.
Conclusions
The m6A-associated genes were dysregulated in GC and played a crucial role in progression and prognosis of GC patients. This study not only suggests the potential value of m6A-related genes as novel prognostic biomarkers in GC but also offers a new direction for the diagnosis and treatment of gastric cancer.
Abbreviations
m6A: N6-methyladenosine; GC: gastric cancer; TMA: tissue microarray; TCGA: The Cancer Genome Atlas; GEO: Gene Expression Omnibus; HPA: Human Protein Atlas database; OS: overall survival; RFS: recurrence-free survival; TNM: tumor node metastasis; AML: acute myeloid leukaemia; FTO: Fat Mass and Obesity associated protein; WTAP: wilms' tumour 1-associated protein; ALKBH5: alkB homolog 5; METTL3: Methyltransferase like 3; METTL14: Methyltransferase like 14; METTL16: Methyltransferase like 16; HNRNPA2B1: Heterogeneous Nuclear Ribonucleoprotein A2/B1; HNRNPC: Heterogeneous nuclear ribonucleoprotein C (C1/C2); RBM15: RNA binding motif protein 15; RBM15B: RNA binding motif protein 15B; YTHDC1: YTH domain containing 1; YTHDF1: YTH N6-methyladenosine RNA binding protein 1; YTHDF2: YTH N6-methyladenosine RNA binding protein 2; YTHDF3: YTHN6-methyladenosine RNA binding protein 3.
Supplementary Material
Supplementary figures and tables.
Acknowledgements
This study was subsidized by funds from the National Natural Science Foundation of China (81702346); National S&T Major Project (SQ2018ZX100301). National Engineering Laboratory for Internet Medical System and Application open fund project (NELIMSA2018P03). The funding body had no role in the design of the study, in the collection, analysis, and interpretation of the data, or in the manuscript writing.
Ethics approval and consent to participate
The research had been approved by the human ethic committee of the First Affiliated Hospital of Zhengzhou University. All patients signed written informed consent and the project was in accordance with the Helsinki Declaration of 1975.
Competing Interests
The authors have declared that no competing interest exists.
References
1. Figueiredo C, Camargo MC, Leite M, Fuentes-Panana EM, Rabkin CS, Machado JC. Pathogenesis of Gastric Cancer: Genetics and Molecular Classification. Current topics in microbiology and immunology. 2017;400:277-304
2. Ferro A, Peleteiro B, Malvezzi M, Bosetti C, Bertuccio P, Levi F. et al. Worldwide trends in gastric cancer mortality (1980-2011), with predictions to 2015, and incidence by subtype. European journal of cancer (Oxford, England: 1990). 2014;50:1330-44
3. Zhang F, Li K, Yao X, Wang H, Li W, Wu J. et al. A miR-567-PIK3AP1-PI3K/AKT-c-Myc feedback loop regulates tumour growth and chemoresistance in gastric cancer. EBioMedicine. 2019;44:311-21
4. Wang X, Wang Y, Qiu M, Li Q, Li ZP, He B. et al. Postoperative chemoradiotherapy in gastric cancer: a phase I study of radiotherapy with dose escalation of oxaliplatin, 5-fluorouracil, and leucovorin (FOLFOX regimen). Medical oncology (Northwood, London, England). 2011;28(Suppl 1):S274-9
5. Shekari N, Baradaran B, Shanehbandi D, Kazemi T. Circulating MicroRNAs: Valuable Biomarkers for the Diagnosis and Prognosis of Gastric Cancer. Current medicinal chemistry. 2018;25:698-714
6. Zhang X, Peng Y, Jin Z, Huang W, Cheng Y, Liu Y. et al. Integrated miRNA profiling and bioinformatics analyses reveal potential causative miRNAs in gastric adenocarcinoma. Oncotarget. 2015;6:32878-89
7. Chen K, Wei Z, Zhang Q, Wu X, Rong R, Lu Z. et al. WHISTLE: a high-accuracy map of the human N6-methyladenosine (m6A) epitranscriptome predicted using a machine learning approach. Nucleic acids research. 2019;47:e41
8. Niu Y, Zhao X, Wu YS, Li MM, Wang XJ, Yang YG. N6-methyl-adenosine (m6A) in RNA: an old modification with a novel epigenetic function. Genomics, proteomics & bioinformatics. 2013;11:8-17
9. Desrosiers R, Friderici K, Rottman F. Identification of methylated nucleosides in messenger RNA from Novikoff hepatoma cells. Proceedings of the National Academy of Sciences of the United States of America. 1974;71:3971-5
10. Roignant JY, Soller M. m(6)A in mRNA: An Ancient Mechanism for Fine-Tuning Gene Expression. Trends in genetics: TIG. 2017;33:380-90
11. Wu L, Wu D, Ning J, Liu W, Zhang D. Changes of N6-methyladenosine modulators promote breast cancer progression. BMC cancer. 2019;19:326
12. Zhang C, Fu J, Zhou Y. A Review in Research Progress Concerning m6A Methylation and Immunoregulation. Frontiers in immunology. 2019;10:922
13. Fu Y, Dominissini D, Rechavi G, He C. Gene expression regulation mediated through reversible m(6)A RNA methylation. Nature reviews Genetics. 2014;15:293-306
14. Jaffrey SR, Kharas MG. Emerging links between m(6)A and misregulated mRNA methylation in cancer. Genome medicine. 2017;9:2
15. Selberg S, Blokhina D, Aatonen M, Koivisto P, Siltanen A, Mervaala E. et al. Discovery of Small Molecules that Activate RNA Methylation through Cooperative Binding to the METTL3-14-WTAP Complex Active Site. Cell reports. 2019;26:3762-71.e5
16. Alarcon CR, Lee H, Goodarzi H, Halberg N, Tavazoie SF. N6-methyladenosine marks primary microRNAs for processing. Nature. 2015;519:482-5
17. Xiang Y, Laurent B, Hsu CH, Nachtergaele S, Lu Z, Sheng W. et al. RNA m(6)A methylation regulates the ultraviolet-induced DNA damage response. Nature. 2017;543:573-6
18. Nishimura S, Yashiro M, Sera T, Yamamoto Y, Kushitani Y, Sugimoto A. et al. Feasibility of Identifying Patients at High Risk of Hereditary Gastric Cancer Based on Clinicopathological Variables. Anticancer research. 2019;39:5057-64
19. Liu L, Liu X, Dong Z, Li J, Yu Y, Chen X. et al. N6-methyladenosine-related Genomic Targets are Altered in Breast Cancer Tissue and Associated with Poor Survival. Journal of Cancer. 2019;10:5447-59
20. Li J, Han Y, Zhang H, Qian Z, Jia W, Gao Y. et al. The m6A demethylase FTO promotes the growth of lung cancer cells by regulating the m6A level of USP7 mRNA. Biochemical and biophysical research communications. 2019;512:479-85
21. Paris J, Morgan M, Campos J, Spencer GJ, Shmakova A, Ivanova I. et al. Targeting the RNA m(6)A Reader YTHDF2 Selectively Compromises Cancer Stem Cells in Acute Myeloid Leukemia. Cell stem cell. 2019;25:137-48.e6
22. Ianniello Z, Paiardini A, Fatica A. N(6)-Methyladenosine (m(6)A): A Promising New Molecular Target in Acute Myeloid Leukemia. Frontiers in oncology. 2019;9:251
23. Zhang S, Zhao BS, Zhou A, Lin K, Zheng S, Lu Z. et al. m(6)A Demethylase ALKBH5 Maintains Tumorigenicity of Glioblastoma Stem-like Cells by Sustaining FOXM1 Expression and Cell Proliferation Program. Cancer cell. 2017;31:591-606.e6
24. Cui X, Wang Z, Li J, Zhu J, Ren Z, Zhang D. et al. Cross talk between RNA N6-methyladenosine methyltransferase-like 3 and miR-186 regulates hepatoblastoma progression through Wnt/beta-catenin signalling pathway. Cell Prolif. 2020 e12768
25. Liu X, Liu L, Dong Z, Li J, Yu Y, Chen X. et al. Expression patterns and prognostic value of m(6)A-related genes in colorectal cancer. American journal of translational research. 2019;11:3972-91
26. Chen JA, Yu Y, Xue C, Chen XL, Cui GY, Li J. et al. Low microRNA-139 expression associates with poor prognosis in patients with tumors: A meta-analysis. Hepatobiliary & pancreatic diseases international: HBPD INT. 2019;18:321-31
27. Zhu W, Wang JZ, Xu Z, Cao M, Hu Q, Pan C. et al. Detection of N6methyladenosine modification residues (Review). International journal of molecular medicine. 2019;43:2267-78
28. Zhao BS, Wang X, Beadell AV, Lu Z, Shi H, Kuuspalu A. et al. m(6)A-dependent maternal mRNA clearance facilitates zebrafish maternal-to-zygotic transition. Nature. 2017;542:475-8
29. Patil DP, Pickering BF, Jaffrey SR. Reading m(6)A in the Transcriptome: m(6)A-Binding Proteins. Trends in cell biology. 2018;28:113-27
30. Cui Q, Shi H, Ye P, Li L, Qu Q, Sun G. et al. m(6)A RNA Methylation Regulates the Self-Renewal and Tumorigenesis of Glioblastoma Stem Cells. Cell reports. 2017;18:2622-34
31. Cai X, Wang X, Cao C, Gao Y, Zhang S, Yang Z. et al. HBXIP-elevated methyltransferase METTL3 promotes the progression of breast cancer via inhibiting tumor suppressor let-7g. Cancer letters. 2018;415:11-9
32. Chen T, Hao YJ, Zhang Y, Li MM, Wang M, Han W. et al. m(6)A RNA methylation is regulated by microRNAs and promotes reprogramming to pluripotency. Cell stem cell. 2015;16:289-301
33. Rong ZX, Li Z, He JJ, Liu LY, Ren XX, Gao J. et al. Downregulation of Fat Mass and Obesity Associated (FTO) Promotes the Progression of Intrahepatic Cholangiocarcinoma. Frontiers in oncology. 2019;9:369
34. Dominissini D, Moshitch-Moshkovitz S, Schwartz S, Salmon-Divon M, Ungar L, Osenberg S. et al. Topology of the human and mouse m6A RNA methylomes revealed by m6A-seq. Nature. 2012;485:201-6
35. Linder B, Grozhik AV, Olarerin-George AO, Meydan C, Mason CE, Jaffrey SR. Single-nucleotide-resolution mapping of m6A and m6Am throughout the transcriptome. Nature methods. 2015;12:767-72
36. Barbieri I, Tzelepis K, Pandolfini L, Shi J, Millan-Zambrano G, Robson SC. et al. Promoter-bound METTL3 maintains myeloid leukaemia by m(6)A-dependent translation control. Nature. 2017;552:126-31
37. Li J, Liu L, Liu X, Xu P, Hu Q, Yu Y. The Role of Upregulated DDX11 as A Potential Prognostic and Diagnostic Biomarker in Lung Adenocarcinoma. Journal of Cancer. 2019;10:4208-16
38. Zhao X, Chen Y, Mao Q, Jiang X, Jiang W, Chen J. et al. Overexpression of YTHDF1 is associated with poor prognosis in patients with hepatocellular carcinoma. Cancer biomarkers: section A of Disease markers. 2018;21:859-68
39. Cheng X, Li M, Rao X, Zhang W, Li X, Wang L. et al. KIAA1429 regulates the migration and invasion of hepatocellular carcinoma by altering m6A modification of ID2 mRNA. OncoTargets and therapy. 2019;12:3421-8
40. Chen L, Wang X. Relationship between the genetic expression of WTAP and bladder cancer and patient prognosis. Oncology letters. 2018;16:6966-70
41. Niu Y, Lin Z, Wan A, Chen H, Liang H, Sun L. et al. RNA N6-methyladenosine demethylase FTO promotes breast tumor progression through inhibiting BNIP3. Mol Cancer. 2019;18:46
42. Zhou B, Lu Q, Liu J, Fan L, Wang Y, Wei W. et al. Melatonin Increases the Sensitivity of Hepatocellular Carcinoma to Sorafenib through the PERK-ATF4-Beclin1 Pathway. Therapeutic advances in medical oncology. 2019;15:1905-20
43. Bansal H, Yihua Q, Iyer SP, Ganapathy S, Proia DA, Penalva LO. et al. WTAP is a novel oncogenic protein in acute myeloid leukemia. Leukemia. 2014;28:1171-4
44. Liu GM, Xie WX, Zhang CY, Xu JW. Identification of a four-gene metabolic signature predicting overall survival for hepatocellular carcinoma. J Cell Physiol. 2020;235:1624-36
45. Wang D, Yang Y, Jin L, Wang J, Zhao X, Wu G. et al. Prognostic models based on postoperative circulating tumor cells can predict poor tumor recurrence-free survival in patients with stage II-III colorectal cancer. Journal of Cancer. 2019;10:4552-63

 Global reach, higher impact