Impact Factor ISSN: 1837-9664

 Global reach, higher impact
J Cancer 2020; 11(13):3751-3761. doi:10.7150/jca.44034 This issue Cite
Research Paper
Improved Prognostic Prediction of Glioblastoma using a PAS Detected from Single-cell RNA-seq
Hongwei Liu1,2*, Qi Yang1,2*, Yi Xiong1,2,3, Zujian Xiong1,2,3, Xuejun Li1,2 ![]()
1. Department of Neurosurgery, Xiangya Hospital, Central South University, Changsha, Hunan, 410008, China
2. Hunan International Scientific and Technological Cooperation Base of Brain Tumor Research, Xiangya Hospital, Central South University, Changsha, Hunan, 410008, China
3. Xiangya Medical School, Central South University, Changsha, Hunan, 410008, China
*Authors contributed equally to this work.
Received 2020-1-16; Accepted 2020-3-28; Published 2020-4-6
Abstract
Glioblastoma (GBM) is a common malignant brain tumor of the central nervous system with a poor prognosis. In order to identify the prognostic signatures of GBM, we screened differentially expressed genes (DEGs) that were based on a single-cell RNA sequencing (scRNA-seq) dataset. These genes characteristically represent the intra-tumor heterogenicity of glioblastoma. Moreover, we performed univariate analysis, log-rank test and multivariate Cox regression analyses to confirm a gene set that could be related to the overall survival (OS) among DEGs. Prognostic associated signatures (PAS) were utilized to construct a model for predicting OS in GBM patients. When considering either the training or the validation sets, time-dependent receiver operating characteristic (ROC) curves all indicated that our model displayed an excellent predictive ability. Additionally, we analyzed PAS at the single-cell level and found that the PAS score was associated with somatic mutations and clinical factors. Three factors, which included the PAS score, radiotherapy status, and age, were all used to establish a nomogram to predict the 6-month and 1-year survival probabilities. In conclusion, we constructed an optimal model that was derived from scRNA-seq to better predict the survival probability of GBM patients. These genes might also act as potential prognostic biomarkers and enable surgeons to develop individually therapeutic schedules and improve the prognosis of GBM patients.
Keywords: glioblastoma, single cell, differentially expressed genes, survival analysis, prognostic model
Introduction
Glioblastoma (GBM) is the most common malignancy among primary central nervous system (CNS) tumors, which is classified as a grade IV glioma according to the World Health Organization (WHO) [1]. The median overall survival (OS) of GBM patients remains at only 15 months post-diagnosis, with a 5-year disease-free survival probability of 10 percent [2-4]. The poor-prognosis is mostly due to a high proliferation rate, treatment-resistance to chemotherapy and targeted therapies, and aggressive infiltration of cancer cells into the surrounding normal brain tissues [5].
Over the past few decades, microarray analysis and RNA sequencing (RNA-seq) from bulk tissue has evolved as an important tool in the analysis of differential gene expression across the transcriptome [6]. With the development of this technology, many public cancer databases that are associated with various omics approaches have been established to reveal the underlying mechanisms accounting for disease occurrence, which includes the Cancer Genome Atlas (TCGA) [7] and the Gene Expression Omnibus (GEO). Using these gene expression profiles to identify biomarkers associated with prognosis, subsequent studies are increasingly being reported. However, GBM is a highly heterogeneous cancer wherein differential genes that are screened from bulk tissue data are not sufficiently representative of this disease [8].
Recently, single-cell RNA-seq (scRNA-seq) analysis has gradually emerged as a new area of intense research effort with its advances helping to explain intra-tumorigenic heterogeneity [9-11]. In addition, tumor tissue that is resected from the core tumor of affected patients might include different cell types that harbor distinct phenotypic states [12]. Single-cell RNA-seq technology enables scientists to identify individual cells in heterogeneous cell populations, which can overcome the aforementioned limitations [13, 14]. Moreover, scRNA-seq analysis enables the discovery of significant genes that are truly characteristic of tumor cells [15].
In this current study, we first identified differentially expressed genes (DEGs) from a scRNA-seq dataset of tumor cells as compared normal cells. These genes characteristically represent the intra-tumor heterogenicity of glioblastoma. Then we integrated the dataset with the bulk RNA-seq dataset from the TCGA and microarray datasets of GEO to obtain a prognosis-associated gene set. Finally, we explored utilizing this gene set to construct a more effective model to accurately predict the prognosis of GBM patients. This approach has the potential of providing guidance for additionally targeted and individualized treatment of patients.
Materials and Methods
Data sources
Raw sequencing data of single-cell datasets in this study was fetched from the Gene Expression Omnibus (GEO) database under the accession number GSE84465, for which, 3589 cells were included in the following analysis for which PAS scored an initial quality check. Raw fastq data was mapped to the hg19 human reference genome by HISAT2 (v2.1.0) [16] (with parameters: -k 10 -rdg 99999999, 99999999 -rfg 99999999, 99999999 -mp 1, 1 -np 1 -score -min L, 0, -0.1 -no-mixed -no -softclip -no -discordant -secondary -seed 12345), and aligned reads were quantified by feature counts software [17] to the count level.
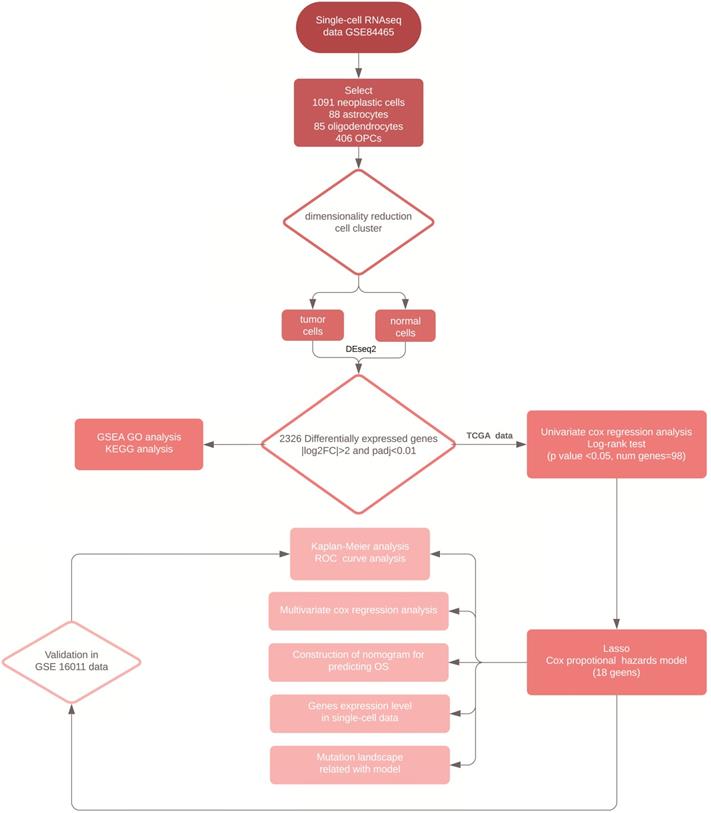
We downloaded the TCGA-GBM RNA-seq and clinical data as a training set from the University of California at Santa Cruz (UCSC) Xena Browser. The fragments per kilobase of exon per million fragments mapped (FPKM) value, was used to normalize gene expression from which, we transformed it into log2 (FPKM+1) datasets. The microarray data from the GSE16011 was also collected from the GEO database as a validation set and was processed by normalizing gene expression signals and log2 transformation through mas5 algorithm in R package “affy” (v1.64.0). In total, there were 154 GBM patients in the TCGA- GBM dataset and 155 GBM patients in the GSE16011 dataset with complete clinical data. In addition, the MuTect2 somatic mutation data was obtained from the UCSC Xena Browser. A workflow of the analysis conducted in this study was shown in Figure 1.
Workflow of the analytical procedure for constructing and validating prognostic signatures in GBM patients.
Cell clustering in single-cell RNA-seq data
We used the statistical R package “Seurat” (v3.1.1) [18, 19] to process single-cell data. First, we normalized the data by following the standard pre-processing workflow in Seurat. Then, we calculated a subset of features that exhibited high cell-to-cell variation, from which we selected the top 500 features by setting the method as dispersion. Finally, the Uniform Manifold Approximation and Projection (UMAP) algorithm was used to perform dimensionality reduction. The same marker profiles of the cell type that were reported in the original paper [12] were compared with our current study to define the type of each cell.
Differential expression analysis
Differentially expressed genes (DEGs) were identified with the R package “DESeq2” (v1.22.2) [20] by defining neoplastic cells as the tumor group, and then astrocytes, oligodendrocytes, oligodendrocyte progenitor cells (OPCs) as the normal group. The DESeq2 pipeline was used with default settings. We filtered genes with the criteria by a log2 fold change >2 and adjusted this to an alpha value of p <0.01.
Functional and pathway enrichment analysis
To compare the biological processes (BP), cellular components (CC) and molecular functions (MF) of DEGs, we used the R package “clusterProfiler” (v3.10.1) [21] to conduct gene set enrichment analysis (GSEA) of the Gene Ontology (GO). The five most significant biological processes in the results were shown with an adjusted alpha value of p <0.05. Additionally, the Kyoto Encyclopedia of Genes and Genomes (KEGG) pathway enrichment analysis of DEGs was performed with the same package. An UpSet plot of the top 10 pathways were drawn from this research.
Survival analysis
The log-rank test, univariate Cox regression analysis and multi-Cox regression analysis were respectively used to screen PAS with OS values using the R package “survival” (v3.1-8). The threshold with significance in all methods was set at an alpha value of p <0.05. In addition, Kaplan Meier (KM) survival curves were generated to graphically exhibit the prognostic outcomes between high and low risk groups that were divided through the median of gene expression levels or the PAS score.
Construction of the prognostic model
Due to the high-dimension features and complexity of the data, we performed a least absolute shrinkage and selection operator (LASSO) method analysis using the R package “glmnet” (v2.0-18) [22]. In addition, 10-fold cross-validation was used to establish a best Cox proportional hazards model. Then, to quantify the risk of OS for each patient, the PAS score was calculated as the sum product of the RNA (Expi) expression levels and LASSO coefficients (Li). The efficacy of the prognostic model was validated by depicting the areas under the curve (AUC) of the ROC by using the R package “survivalROC” (v1.0.3). To monitor the OS and to predict the survival probability in GBM patients, we merged the PAS score with interesting clinical variables and constructed a nomogram using the R package “regplot” (v0.2).
Oncoprint of somatic mutation
Somatic mutation information was stored in Mutation Annotation Format (MAF) form and was visualized using the R package “maftools” (v1.8.10) tool [23]. All parameters were set to the default settings.
Statistical Methods
All data analyses were completed using the 'R” statistical software package (v3.5.3) and the corresponding fundamental analyses packages. An alpha value of p <0.05 was considered statistically significant.
Results
Differentially expressed gene identification from a single-cell RNA-seq dataset
We selected 1670 single cells that included 1091 neoplastic cells, 88 astrocytes, 85 oligodendrocytes, and 406 oligodendrocyte progenitor cells (OPCs). These cells were analyzed by the standard workflow of the R package “Seurat.” A linear dimensionality reduction method helped identify significant components (Figure 2A). Additionally, we used the Uniform Manifold Approximation and Projection (UMAP) algorithm, which is a novel manifold learning technique for dimension reduction to visualize the single-cell RNA-seq data based on the significant components. We discovered that cells could be clustered into four groups (Figure 2B). The differential marker genes between clusters are illustrated in Table S1, and the top 10 most enriched genes in each cluster were exhibited in the heat map (Figure 2C). Next, we compared the marker genes in our study with those identified in the original article [12] and used the same marker genes to name the clusters, where results were similar.
Characteristics of single-cell RNA-seq data and DEGs. (A) Jack Straw Plot showing the p-value distributions for each PC. (B) Dimension reduction analysis of single-cell RNA-seq data by the UMAP algorithm that clusters cells into four groups. (C) Heat map expression profiles of the top 10 genetic markers in each cluster. (D) PCA of tumorigenic and normal cells that can be clearly separated. (E) Volcano plot of DEGs with a log2 fold-change >2, and an adjusted alpha value of p <0.01. (F) Heat map expression profiles of the 100 most significant genes for tumorigenic and normal cells.
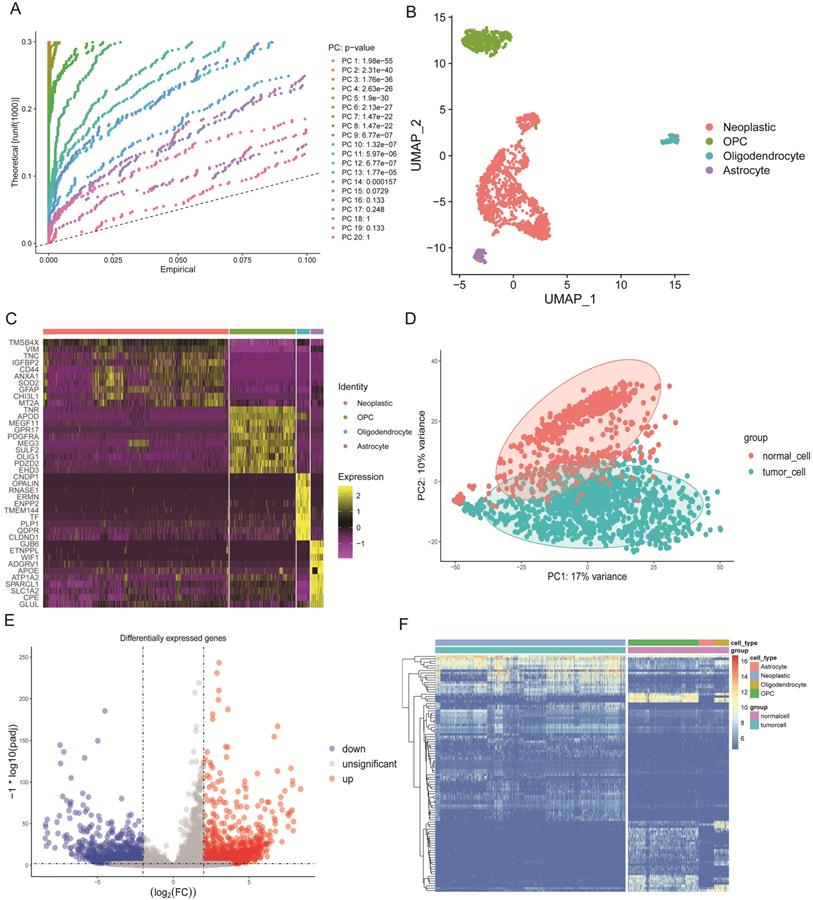
Concrete classification information of cells used in this study are illustrated in Table S2. In order to find the DEGs between tumorigenic and normal cells, we defined astrocytes, oligodendrocytes and OPCs as normal cells. By principal component analysis (PCA), tumorigenic and normal cells were separated based on principle component 1 (PC1) and PC2 (Figure 2D). Then the “DEseq2” package identified the DEGs. We excluded genes with the cut-off criteria of log2 fold change >2 and adjusted the alpha value to p<0.01. In the results, we included the 1367 identified up-regulated genes and the 959 down-regulated genes in tumor cells that were displayed in the volcano plot (Figure 2E). The two groups were clearly discriminated by these 100 DEGs in the heat map (Figure 2F).
GSEA of GO and KEGG pathway enrichment analysis in DEGs
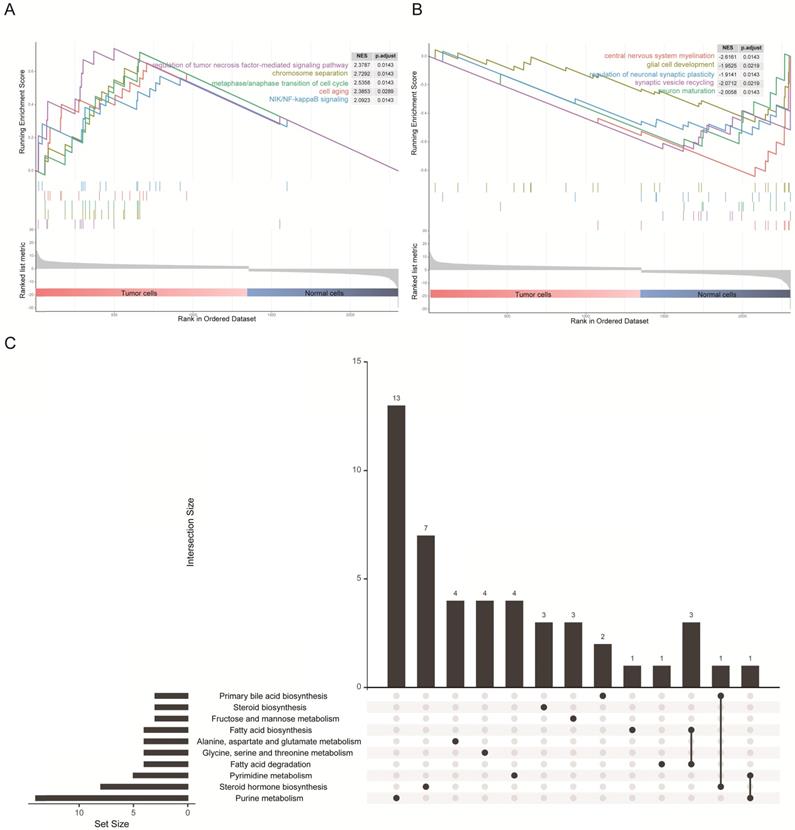
The 1367 DEGs of the transcriptomic data from single cells were selected for gene set enrichment analysis (GSEA) to explore the biological effects. We chose the log2 fold change as the reference phenotype and the five most significant Gene Ontology (GO) biological processes were listed. We observed that up-regulated genes in tumor cells were enriched in the cell cycle, cell division process and tumor-associated pathways (Figure 3A), as for cellular components and molecular functions, these genes were enriched in the nuclear and DNA binding associated molecular process (Figure S1A and Figure S1B). By contrast, up-regulated genes in normal cells were enriched in glial cell development and synaptic transmission (Figure 3B), as for cellular components and molecular functions, these genes were enriched in cytoplasm and transmembrane transportation (Figure S1A and Figure S1B). These results were consistent with the characteristics of both cell types. In addition, it is intriguing to note that the KEGG pathway enrichment analysis revealed an association of DEGs with lipid and fatty acid metabolism (Figure 3C), and similar results were shown on enrichment analysis of just up-regulated or down-regulated DEGs (Figure S1C and Figure S1D). Precisely how an altered associated metabolism contributed to progression of GBM remains unknown. However, quite valuable research study outcomes have been published that illustrated how fatty acid synthesis was related to EGFR signaling in glioma stem cells [24].
GSEA results and KEGG analysis of differentially expressed genes. (A) The five most significant biological processes for tumor cells in the GSEA of GO. (B) The five most significant biological processes for normal cells in the GSEA of GO. (C) Diagram illustrating the top 10 pathways in the KEGG enrichment analysis of DEGs.
Construction of prognostic-associated signatures in the TCGA-GBM cohort
To discover prognostic-associated signatures, we combined the 2326 DEGs that were defined above with the TCGA-GBM bulk RNA-seq and clinical data. There were 154 GBM patients with intact clinical data and 110 genes of DEGs were not expressed in TCGA bulk RNA-seq data. Before constructing a Cox proportional hazards model to better predict OS in GBM patients, we used the log-rank test and univariate cox regression analysis respectively to preliminarily screen genes with prognostic potential.
In the obtained results, we found that 181 genes had prognostic potential in the log-rank test and 279 genes had prognostic potential as determined by univariate Cox regression analysis (p < 0.05). We generally thought that the more up-regulated genes that were expressed in tumor cells of studied patients, then the worse their prognosis would be. Similarly, the greater the number of down-regulated genes that were expressed in tumor cells of studied patients, the better their prognosis would be. Thus, a total of 98 genes that included 89 up-regulated genes with a hazard ratio (HR) >1, and 9 down-regulated genes with a HR < 1 (p < 0.05; both in the log-rank test, and univariate cox regression analysis), were selected to construct a Cox proportional hazards model (Figure 4A).
Establishing a survival model in the GBM cohort. (A) Summary of the selected DEGs with a prognostic capacity, in which we only selected genes during the area covered by indicated colors. (B) The optimal account of genes that corresponded to minimum lambda was 18 in the TCGA-GBM cohort. (C) The ROC analysis curves in predicting OS by the PAS score in the TCGA-GBM cohort. (D) The KM curves for low- and high-risk groups in the TCGA-GBM cohort. (E) The ROC curves for predicting OS by the PAS score in the GSE16011 cohort. (F) The KM curves for low- and high-risk groups in the GSE16011 cohort.
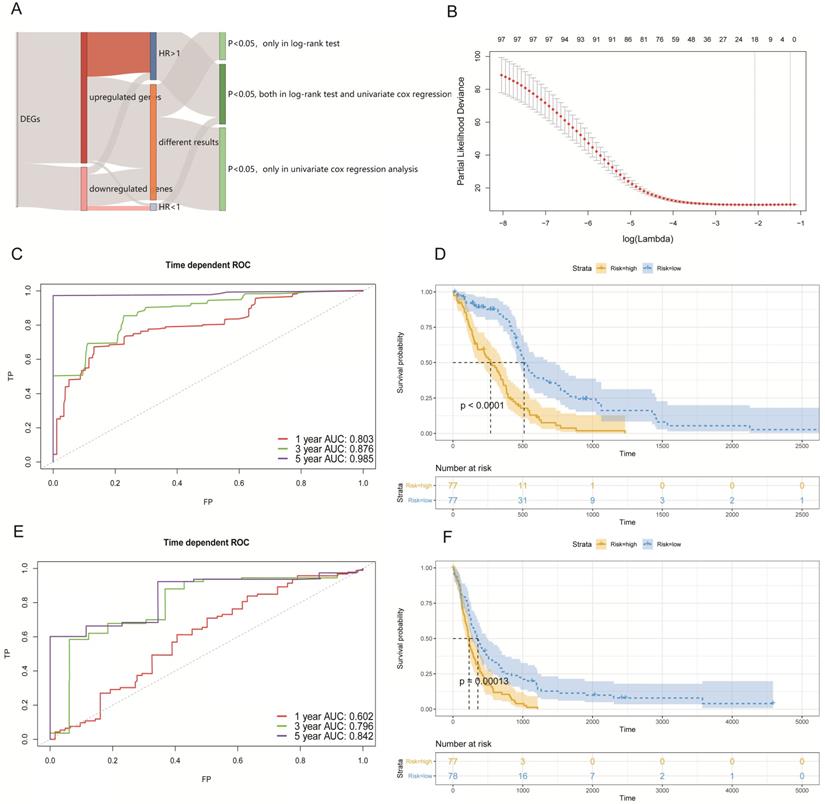
By utilizing the least absolute shrinkage and selection operator (LASSO) method, we established a best Cox proportional hazards model (10-fold cross- validation) with 18 genes (Figure 4B). The complete information related to the OS of these 18 genes are shown in Table 1. In addition, Kaplan-Meier (KM) curves of each gene can be seen in Figure S2. The prognostic associated signature score (PAS score) for each patient was calculated as the sum of the product of the RNA expression levels (Expi) and LASSO coefficients (Li). In the TCGA-GBM cohort, the areas under the curve (AUC) of the receiver operating characteristic (ROC) curves of this model for predicting 1-, 3-, and 5-year OS were 0.803, 0.876, and 0.985 respectively (Figure 4C).
Statistical analysis of 18 genes associated with survival in the TCGA-GBM cohort.
| Variables | Log-rank test | Univariate cox regression analysis | LASSO | |
|---|---|---|---|---|
| P value | HR (95% CI) | P value | Coefficient | |
| AGAP2-AS1 | 0.018 | 1.24(1.10-1.40) | <0.001 | 0.057478 |
| CLEC18C | 0.012 | 3.73(1.58-8.80) | 0.003 | 0.2067 |
| CNPY4 | 0.046 | 1.87(1.32-2.65) | <0.001 | 0.054552 |
| COL22A1 | 0.015 | 1.38(1.15-1.65) | <0.001 | 0.090813 |
| CRNDE | 0.010 | 1.31(1.04-1.66) | 0.025 | 0.002454 |
| HOXB2 | 0.001 | 1.19(1.05-1.34) | 0.007 | 0.014237 |
| HOXD11 | 0.049 | 1.32(1.06-1.64) | 0.012 | 0.019821 |
| LOXL1 | 0.011 | 1.43(1.21-1.69) | <0.001 | 0.034217 |
| MBLAC1 | 0.006 | 1.79(1.18-2.73) | 0.007 | 0.10079 |
| OSMR-AS1 | 0.013 | 2.92(1.69-5.05) | <0.001 | 0.44677 |
| PCDHB3 | 0.029 | 1.24(1.01-1.52) | 0.039 | 0.01033 |
| PTPRN | <0.001 | 1.42(1.21-1.67) | <0.001 | 0.19405 |
| RGS14 | 0.006 | 1.57(1.18-2.07) | 0.002 | 0.121256 |
| TCAF2 | <0.001 | 1.85(1.31-2.62) | <0.001 | 0.09673 |
| TSHZ2 | <0.001 | 1.93(1.34-2.78) | <0.001 | 0.023308 |
| TSPAN4 | 0.015 | 2.11(1.40-3.18) | <0.001 | 0.0621 |
| BEST3 | 0.037 | 0.73(0.59-0.91) | 0.006 | -0.0173 |
| FERMT1 | 0.004 | 0.81(0.70-0.94) | 0.006 | -0.02211 |
Furthermore, we divided patients into high-risk and low-risk groups according to the median of PAS score. KM analysis indicated that patients with a high PAS score suffered significantly poorer OS outcomes (p < 0.0001; Figure 4D). These results lend support to our model possessing good sensitivity and specificity.
Validation of PAS in an external GBM cohort
To validate our PAS, we selected external data from GEO under accession number GSE16011 to determine whether it made sense in other cohorts. There were 155 GBM patients with complete survival data and microarrays. We conducted the same workflows to measure the AUC of the ROC curves and divided patients into two groups by the median of the PAS score. In the results analyses, the AUC of the ROC curves of this model in predicting 1-, 3-, and 5-year OS rates were 0.602, 0.796, and 0.842 respectively (Figure 4E). Further, KM analysis also indicated that patients with a high PAS score suffered significantly poorer OS outcomes (p < 0.001; Figure 4F). All results revealed that these PAS were important in GBM patients without an increased level of bias.
PAS levels in a single-cell dataset that is correlated with somatic mutations
After we identified 18 prognostic-associated signatures, we mapped the expression of the signatures to the UMAP-reduction plot, which was done in the single-cell dataset that was described above. It showed that two genes had lower expression levels in neoplastic cell clusters as compared to normal cells, while 16 genes displayed higher expression levels in the neoplastic cell cluster (Figure 5A and Figure S3). Specifically, five genes were involved in cell adhesion and migration, which included FERMT1, COL22A1, LOXL1, PCDHB3, and TCAF2. Four genes were transcription factor or involved in the regulation of transcription, like HOXB2, HOXD11, PTPRN, and TSHZ2. Moreover, we explored somatic mutation that was found when comparing the high with the low PAS score groups in the TCGA-GBM cohort.
Analysis of 18 prognostic genes in the single-cell and bulk analysis dataset. (A) Differential expression levels of each gene in four clusters in the single-cell dataset. (B) The somatic mutation landscape of TCGA-GBM patients with a high PAS score. (C) The somatic mutational landscape of TCGA-GBM patients with a low PAS score.
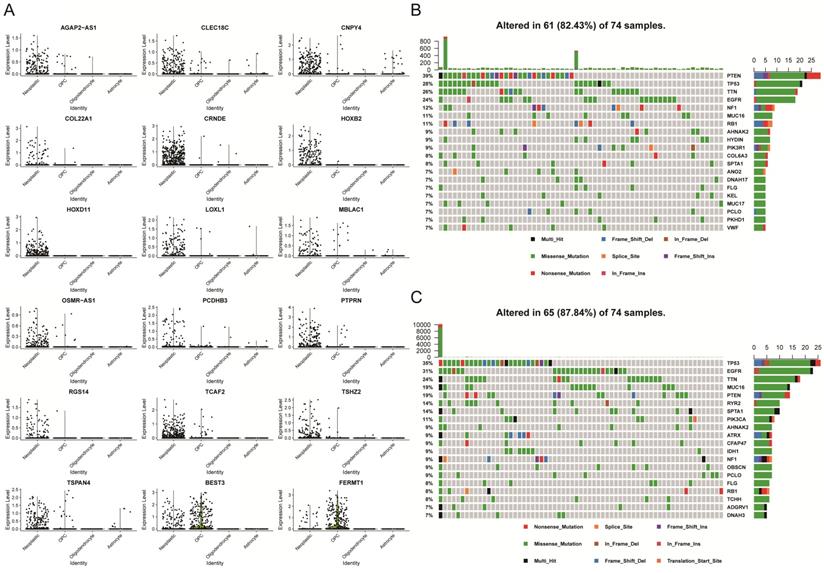
The mutational landscape indicated that both groups had different mutation events, and the low PAS score group was found to have an increased frequency of mutation events (Figures 5B and 5C). In addition, patients with higher mutations might have an increased number of neoantigens that will increase the sensitivity of patients to chemotherapy, immunotherapy and targeted molecular therapy [25-27]. Thus, these observations might provide a key reason to account for why low PAS score patients had improved prognostic outcomes.
Development of a nomogram for predicting OS in GBM patients
For the purpose of establishing a comprehensive model to predict the OS probability in GBM patients, we first analyzed an association between the PAS score and several clinical factors in the TCGA-GBM dataset. The hazard ratios for OS according to the PAS score, age, gender, and radiotherapy status were measured by multivariate Cox regression analysis (Figure 6A). It revealed that the PAS score and radiotherapy status were independent prognostic factors (p <0.001). Considering that the resistance of the human body to disease weakens with age, we also included age into the nomogram that was integrated with two independent factors.
Development of a nomogram in predicting the 6-month and 1-year survival probabilities in GBM patients. (A) Multivariate Cox regression analysis of the PAS score with several clinical factors. (B) Integration of three factors to construct a nomogram for the prediction of 6-month and 1-year OS rates. (C) Calibration curve to validate the predictive efficacy of the model for 6 month and 1-year OS rates.
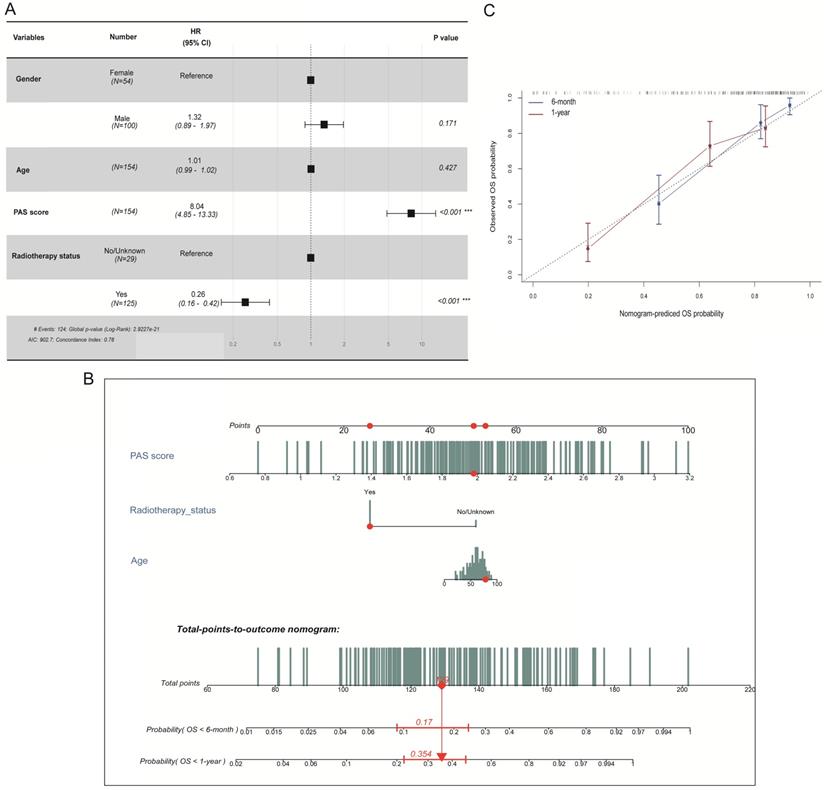
The final three prognostic factors were utilized to develop a nomogram for predicting 6-month and 1-year OS probability (Figure 6B). A calibration curve was drawn to validate model efficacy (Figure 6C). Thus, the actual observed OS outcomes were approximately consistent with the predicted OS outcomes regardless of the 6-month or 1-year time frame, which showed an excellent working ability.
Discussion
Bulk RNA-seq data from the TCGA-GBM dataset fails to accurately reflect the status of tumor and intra-tumorigenic heterogeneity [9, 10]. This is in part due to the dominant cell cluster masking the transcriptomic characteristics of other cellular clusters. With the aid of single-cell RNA-seq datasets that were analyzed in this study, we compared and precisely discovered the DEGs between glioma cells and their original cells. These DEGs better describe the intra-tumorigenic heterogeneity of glioma, and provide us with a gene set for further analysis.
Furthermore, these DEGs indicated distinct molecular networks in glioma cells as compared to glia cells. GSEA analysis on DEGs revealed that up-regulated genes in glioma cells were enriched in the cell cycle, the cell division process and other tumor-associated pathways. By contrast, for normal cells, up-regulated genes were enriched in glial cell development-associated and synaptic function- associated pathways. KEGG enrichment analysis showed intriguing results as well, which were mostly enriched in pathways associated with lipid metabolism. Recent reports have shown that lipid metabolism is critical to glioma cells in terms of energy synthesis [28, 29], and fatty acids were shown to regulate the EGFR signaling pathway and to promote survival and proliferation of glioblastoma stem cells [24].
To connect the DEGs with prognosis, we first employed Cox regression and log-rank test analytics to preliminarily select genes with prognostic predicting potential, following which, we then employed variable selection analysis on the TCGA-GBM dataset. The final model included 18 genes that performed well on the dataset with a five-year OS AUC of 0.985.
Moreover, we used data from the GSE16011 cohort to test the generalization ability of the model, in which we found that accuracy was slightly decreased, and yet still achieved a five-year OS AUC of 0.842. In addition, patients that were divided by the PAS value displayed a distinct mutational landscape, which partially explained differences on OS. Demographic information that included age, and clinical information like chemotherapy were also good prognostic prediction factors, and thus we established a model using a nomogram to predict the overall survival of patients.
Conclusion
We discovered a signature with only 18 genes by using a single cell RNA-seq dataset, from which we developed a PAS to evaluate patient prognoses. These genes characteristically represent the intra-tumor heterogenicity of glioblastoma. This signature has acceptable performance in terms of both the training and external datasets and showed acceptable generalization capabilities. This is a simple model with good performance characteristics that can be applied in the clinic. PAS is also associated with the somatic mutation profile of patients. These genes might act as potential prognostic biomarkers and provide useful clinical guidance to clinicians with the intent of developing personalized therapeutic schedules.
Abbreviations
GBM: glioblastoma; WHO: World Health Organization; OS: overall survival; RNA-seq: RNA sequencing; TCGA: The Cancer Genome Atlas; GEO: Gene Expression Omnibus; scRNA-seq: single-cell RNA sequencing; DEGs: differentially expressed genes; UCSC: University of California at Santa Cruz; FPKM: Fragments per kilobase of exon per million fragments mapped; UMAP: Uniform Manifold Approximation and Projection; OPCs: oligodendrocyte progenitor cells; GSEA: gene set enrichment analysis; GO: Gene Ontology; KEGG: Kyoto Encyclopedia of Genes and Genomes; PAS: prognostic associated signature; KM: Kaplan Meier; PAS score: prognostic associated signature score; LASSO: least absolute shrinkage and selection operator; ROC: receiver operating characteristic; AUC: areas under the curve; MAF: Mutation Annotation Format; PCA: principal component analysis; HR: hazard ratio.
Supplementary Material
Supplementary figures.
Supplementary table 1.
Supplementary table 2.
Acknowledgements
This work was supported by the National Natural Science Foundation of China (Grant No. 81770781 and Grant No. 81472594).
Ethics Committee Approval and Patient Consent
This research study was approved by the local Ethics Committee of Xiangya Hospital Central South University, China.
Competing Interests
The authors have declared that no competing interest exists.
References
1. Louis DN, Perry A, Reifenberger G, von Deimling A, Figarella-Branger D, Cavenee WK. et al. The 2016 World Health Organization Classification of Tumors of the Central Nervous System: a summary. Acta neuropathologica. 2016;131:803-20
2. Stupp R, Hegi ME, Mason WP, van den Bent MJ, Taphoorn MJ, Janzer RC. et al. Effects of radiotherapy with concomitant and adjuvant temozolomide versus radiotherapy alone on survival in glioblastoma in a randomised phase III study: 5-year analysis of the EORTC-NCIC trial. The Lancet Oncology. 2009;10:459-66
3. Stupp R, Mason WP, van den Bent MJ, Weller M, Fisher B, Taphoorn MJ. et al. Radiotherapy plus concomitant and adjuvant temozolomide for glioblastoma. The New England journal of medicine. 2005;352:987-96
4. Thakkar JP, Dolecek TA, Horbinski C, Ostrom QT, Lightner DD, Barnholtz-Sloan JS. et al. Epidemiologic and molecular prognostic review of glioblastoma. Cancer epidemiology, biomarkers & prevention: a publication of the American Association for Cancer Research, cosponsored by the American Society of Preventive Oncology. 2014;23:1985-96
5. Luoto S, Hermelo I, Vuorinen EM, Hannus P, Kesseli J, Nykter M. et al. Computational Characterization of Suppressive Immune Microenvironments in Glioblastoma. Cancer research. 2018;78:5574-85
6. Stark R, Grzelak M, Hadfield J. RNA sequencing: the teenage years. Nature reviews Genetics. 2019;20:631-56
7. Cancer Genome Atlas Research Network. Comprehensive genomic characterization defines human glioblastoma genes and core pathways. Nature. 2008;455:1061-8
8. Bedard PL, Hansen AR, Ratain MJ, Siu LL. Tumour heterogeneity in the clinic. Nature. 2013;501:355-64
9. Neftel C, Laffy J, Filbin MG, Hara T, Shore ME, Rahme GJ. et al. An Integrative Model of Cellular States, Plasticity, and Genetics for Glioblastoma. Cell. 2019;178:835-49.e21
10. Patel AP, Tirosh I, Trombetta JJ, Shalek AK, Gillespie SM, Wakimoto H. et al. Single-cell RNA-seq highlights intratumoral heterogeneity in primary glioblastoma. Science (New York, NY). 2014;344:1396-401
11. Yu L, Zhao H, Meng L, Zhang C. Application of Single Cell Sequencing in Cancer. Advances in experimental medicine and biology. 2018;1068:135-48
12. Darmanis S, Sloan SA, Croote D, Mignardi M, Chernikova S, Samghababi P. et al. Single-Cell RNA-Seq Analysis of Infiltrating Neoplastic Cells at the Migrating Front of Human Glioblastoma. Cell reports. 2017;21:1399-410
13. Nguyen QH, Pervolarakis N, Nee K, Kessenbrock K. Experimental Considerations for Single-Cell RNA Sequencing Approaches. Frontiers in cell and developmental biology. 2018;6:108
14. Ashton JM. Single-Cell Genomics: Best Practices and New Insights. Journal of biomolecular techniques: JBT. 2019;30:S61-s2
15. Kulkarni A, Anderson AG, Merullo DP, Konopka G. Beyond bulk: a review of single cell transcriptomics methodologies and applications. Current opinion in biotechnology. 2019;58:129-36
16. Pertea M, Kim D, Pertea GM, Leek JT, Salzberg SL. Transcript-level expression analysis of RNA-seq experiments with HISAT, StringTie and Ballgown. Nature protocols. 2016;11:1650-67
17. Liao Y, Smyth GK, Shi W. featureCounts: an efficient general purpose program for assigning sequence reads to genomic features. Bioinformatics (Oxford, England). 2014;30:923-30
18. Butler A, Hoffman P, Smibert P, Papalexi E, Satija R. Integrating single-cell transcriptomic data across different conditions, technologies, and species. Nature biotechnology. 2018;36:411-20
19. Stuart T, Butler A, Hoffman P, Hafemeister C, Papalexi E, Mauck WM 3rd. et al. Comprehensive Integration of Single-Cell Data. Cell. 2019;177:1888-902.e21
20. Love MI, Huber W, Anders S. Moderated estimation of fold change and dispersion for RNA-seq data with DESeq2. Genome biology. 2014;15:550
21. Yu G, Wang LG, Han Y, He QY. clusterProfiler: an R package for comparing biological themes among gene clusters. Omics: a journal of integrative biology. 2012;16:284-7
22. Friedman J, Hastie T, Tibshirani R. Regularization Paths for Generalized Linear Models via Coordinate Descent. Journal of statistical software. 2010;33:1-22
23. Mayakonda A, Lin DC, Assenov Y, Plass C, Koeffler HP. Maftools: efficient and comprehensive analysis of somatic variants in cancer. Genome research. 2018;28:1747-56
24. Gimple RC, Kidwell RL, Kim LJY, Sun T, Gromovsky AD, Wu Q. et al. Glioma Stem Cell-Specific Superenhancer Promotes Polyunsaturated Fatty-Acid Synthesis to Support EGFR Signaling. Cancer discovery. 2019;9:1248-67
25. Rizvi NA, Hellmann MD, Snyder A, Kvistborg P, Makarov V, Havel JJ. et al. Cancer immunology. Mutational landscape determines sensitivity to PD-1 blockade in non-small cell lung cancer. Science (New York, NY). 2015;348:124-8
26. Capalbo C, Scafetta G, Filetti M, Marchetti P, Bartolazzi A. Predictive Biomarkers for Checkpoint Inhibitor-Based Immunotherapy: The Galectin-3 Signature in NSCLCs. International journal of molecular sciences. 2019 20
27. Wang JY, Bettegowda C. Genetics and immunotherapy: using the genetic landscape of gliomas to inform management strategies. Journal of neuro-oncology. 2015;123:373-83
28. Strickland M, Stoll EA. Metabolic Reprogramming in Glioma. Frontiers in cell and developmental biology. 2017;5:43
29. Guo D, Bell EH, Chakravarti A. Lipid metabolism emerges as a promising target for malignant glioma therapy. CNS oncology. 2013;2:289-99
Author contact
![]() Corresponding author: Xuejun Li, M.D., Professor, Director, Department of Neurosurgery, Xiangya Hospital, Central South University, 87 Xiangya Road, Changsha, Hunan Province, 410008, China. Email: lxjneuroedu.cn.
Corresponding author: Xuejun Li, M.D., Professor, Director, Department of Neurosurgery, Xiangya Hospital, Central South University, 87 Xiangya Road, Changsha, Hunan Province, 410008, China. Email: lxjneuroedu.cn.