Impact Factor ISSN: 1837-9664

 Global reach, higher impact
J Cancer 2020; 11(13):3986-3999. doi:10.7150/jca.41123 This issue Cite
Research Paper
Prognostic significance of age related genes in patients with lower grade glioma
Haiwei Wang1,2,*, ![]() , Xinrui Wang1,2,*, Liangpu Xu1,2, Ji Zhang3
, Xinrui Wang1,2,*, Liangpu Xu1,2, Ji Zhang3 ![]() , Hua Cao1,2
, Hua Cao1,2 ![]()
1. Fujian Key Laboratory for Prenatal Diagnosis and Birth Defect, Fujian Maternity and Child Health Hospital, Affiliated Hospital of Fujian Medical University, Fuzhou, Fujian, China.
2. Key Laboratory of Technical Evaluation of Fertility Regulation for Non-human Primate, National Health and Family Planning Commission, Fuzhou, Fujian, China.
3. State Key Laboratory for Medical Genomics, Shanghai Institute of Hematology, Rui-Jin Hospital Affiliated to School of Medicine, Shanghai Jiao Tong University, Shanghai, China.
* These authors equally contributed to this work.
Received 2019-10-12; Accepted 2020-2-12; Published 2020-4-6
Abstract
Objective: To analyze the prognostic effects of age in different tumor types and determine the prognostic significance of age related genes in patients with lower grade glioma (LGG).
Methods: The relationships between age and tumor overall survival were determined by Kaplan-Meier survival analysis using The Cancer Genome Atlas (TCGA) dataset. The age related genes were identified using TCGA RNA-seq data. Univariate and multivariate cox regression were used to determine the prognostic significance of age related genes. The results derived from TCGA dataset were further validated using Gene Expression Omnibus (GEO) and Chinese Glioma Genome Atlas (CGGA) datasets.
Results: Age at initial pathologic diagnosis was most associated with the overall survival of LGG patients than other types of tumor patients. Age related genes EMP3, IGFBP2, TIMP1 and SERPINE1 were highly expressed in old LGG patients. The hypo-methylations of EMP3 and SERPINE1 were contributing to the high expressions of EMP3 and SERPINE1 in old LGG patients. Also, EMP3, IGFBP2, TIMP1 and SERPINE1 were highly expressed in LGG tumor tissues, compared with normal brain tissues. Moreover, high expressions of IGFBP2, EMP3, TIMP1 and SERPINE1 were associated with the worse prognosis of LGG patients. Furthermore, we demonstrated that EMP3 and SERPINE1 were connected with each other and the combination of EMP3 and SERPINE1 had better prognostic effects in glioma patients.
Conclusions: Age related genes IGFBP2, EMP3, TIMP1 and SERPINE1 have significant prognostic effects in LGG patients.
Keywords: Age related genes, Lower grade glioma, EMP3, SERPINE1, TCGA
Introduction
Cancer is an age related disease. With the increasing of age, somatic mutations are accumulating, contributing to the high incidence of cancer in older adults [1-4]. Moreover, old tumor patients demonstrate different histological characteristics and prognostic outcomes as compared with young tumor patients [5-12]. Those observations highlight the prognostic importance of age of tumor patients at initial pathologic diagnosis. However, the prognostic effects of age across different tumor types and the age related genes in determining the clinical outcomes are unclear.
For the decade, The Cancer Genome Atlas (TCGA) program collects the clinical characteristics and molecular signatures of more than 11,000 human tumor patients across 33 different tumor types [13, 14]. Molecular profiles, like gene expression portraits, DNA mutation signatures and DNA methylation characteristics are quite associated with the clinical overall survival of tumor patients [15-19]. Similar dataset is established in the Chinese Glioma Genome Atlas (CGGA) to provide massive amounts of data for basic and clinical research of glioma [20-22]. With the available TCGA, CGGA and Gene Expression Omnibus (GEO) datasets, here, we systematically define the molecular characteristics of age related genes and reveal their prognostic effects in determining the clinical overall survival of tumor patients, particularly LGG patients.
Glioma is the most common type of brain tumor [23]. According to the World Health Organization classification system, LGG is grade II- III glioma, contrast to the high grade glioblastoma (GBM) (grade IV glioma) [24]. GBM and LGG demonstrate different clinical and molecular characteristics [25, 26]. Unlike other tumor types, LGG is more likely developed in younger patients [27]. Indeed, nearly 90% LGG patients are developed under 60 years old, according to the TCGA clinical data. Furthermore, our results show that the initial pathologic diagnostic age is most significantly associated with the tumor incidence and clinical overall survival of LGG patients compared with other types of tumor patients.
Previous results suggested that EMP3 [28-32] and IGFBP2 [33-35] were critical biomarkers in glioma prognosis. However, the inner mechanisms of how EMP3 and IGFBP2 involving the glioma overall survival are unclear. In here, we show that both EMP3 and IGFBP2 are age related genes, and highly expressed in old LGG patients. Additionally, we identify two prognostic genes TIMP1 and SERPINE1. Similar to EMP3 and IGFBP2, TIMP1 and SERPINE1 are highly expressed in old LGG patients. And IGFBP2, EMP3, TIMP1 and SERPINE1 are all highly expressed in LGG tumor tissues compared with normal brain tissues. Moreover, higher expressions of IGFBP2, EMP3, TIMP1 and SERPINE1 are associated with worse prognosis of LGG patients. At last, we demonstrate the prognostic effects of combination of EMP3 and SERPINE1 genes in glioma patients.
Taken together, our results suggest that age related genes IGFBP2, EMP3, TIMP1 and SERPINE1 have significant prognostic effects in LGG patients and represent suitable biomarkers for prognostic or therapeutic strategies for LGG patients.
Materials and Methods
Data collection
The TCGA datasets were downloaded from the TCGA hub (tcga.xenahubs.net), where all TCGA clinical data and molecular data were available. In the TCGA clinicalMatrix dataset, solid primary tumor patients with age at initial pathologic diagnosis and overall survival time were selected for further studies. Tumor types with favorable clinical outcomes, like kidney chromophobe (KICH), thyroid cancer (THCA) were excluded, since most of tumor patients were survived during the following time.
The gene expression series matrix of normal and cancerous brain tissues was downloaded from the Gene Expression Omnibus (GEO) website (www.ncbi.nlm.nih.gov/geo), and included the GEO datasets GSE4920 [36], GSE16011 [37] and GSE50161 [38]. The gene expression and survival data of patients with glioma were downloaded from the GEO dataset GSE43378 [39].
The Chinese Glioma Genome Atlas (CGGA) datasets were downloaded from http://www.cgga.org.cn/index.jsp website, where all CGGA clinical data and gene expression data were available.
TCGA data processing
Gene expression profile between old and young tumor patients of each tumor type was analyzed using TCGA RNA-seq dataset. The different gene expression between old and young tumor patients was determined by Student's t test. The DNA methylation profile of age related genes in glioma patients was analyzed through TCGA Human Methylation450 microarray dataset.
GEO data processing
The GEO expression datasets were processed using R software. The matrix file of each dataset was annotated with corresponding platform. When multiple probes corresponded to the same gene symbol, the expression values were averaged using “plyr” package R software. The different gene expression between normal and glioma samples was determined using Student's t test.
Heatmap presentation
Heatmaps were created by R software “pheatmap” package. The “pheatmap” package and the basic usage were downloaded from bioconductor. The clustering scale was determined by "average" method.
Survival analysis
The overall survival curves were generated from prims5.0. Kaplan-Meier estimator was applied to determine the significance of different factors in determining tumor overall survival. P values were determined using Log-rank test.
The construction of transcriptional network
The transcriptional network of age related genes was created by Cytoscape GeneMANIA App. Cytoscape is an open source software platform for constructing complex networks and could be download from Cytoscape website.
Univariate and multivariate cox regression
Univariate and multivariate cox regression were analyzed by R software “survival” package. The “survival” package and the basic usage were downloaded from bioconductor. Log-rank test was used to calculate the P values.
Venn diagram
The Venn diagram was generated using VENNY 2.1. VENNY 2.1 is an online tool for comparing lists (https://bioinfogp.cnb.csic.es/tools/venny/).
Spearman correlation
Spearman correlation was used to study the correlation between EMP3 and SERPINE1 gene expression in glioma patients through the “lm” method in R software.
Statistical analysis
The box plots were generated from prims5.0. Statistical analysis was performed using the Student's t test. P value less than 0.05 was chosen to be significantly different.
Results
Older age is associated with the low overall survival of tumor patients
Age at initial pathologic diagnosis and tumor overall survival were extracted from the clinicalMatrixs which were launched by the TCGA network. Totally, 8,810 tumor patients from 20 tumor types were collected for further studies. The abbreviations of tumor types and the number of tumor patients in each tumor type were illustrated in Table 1. The abbreviation of each tumor type was further used. The detailed clinical parameters of 8,810 tumor patients, including gender, weight, height, pathologic stage were provide in supplementary table.
Summary of tumor types and the number of tumor patients in TCGA dataset used in this study.
| Abbreviations | Tumor type | Overall | Old | Young |
|---|---|---|---|---|
| BLCA | Bladder Urothelial Carcinoma | 408 | 301 | 107 |
| BRCA | Breast Invasive Carcinoma | 1082 | 482 | 600 |
| CESC | Cervical Squamous Cell Carcinoma | 294 | 54 | 240 |
| COAD | Colon Adenocarcinoma | 441 | 306 | 135 |
| ESCA | Esophageal Adenocarcinoma | 185 | 93 | 92 |
| GBM | Glioblastoma Multiforme | 596 | 272 | 324 |
| HNSC | Head and Neck Squamous Cell Carcinoma | 525 | 267 | 258 |
| KIRC | Kidney Renal Clear Cell Carcinoma | 535 | 269 | 266 |
| KIRP | Kidney Renal Papillary Cell Carcinoma | 286 | 152 | 134 |
| LGG | Brain Lower Grade Glioma | 511 | 61 | 450 |
| LIHC | Liver Hepatocellular Carcinoma | 371 | 195 | 176 |
| LUAD | Lung Adenocarcinoma | 498 | 339 | 159 |
| LUSC | Lung Squamous Cell Carcinoma | 492 | 385 | 107 |
| OV | Ovarian Serous Cystadenocarcinoma | 580 | 258 | 322 |
| PAAD | Pancreatic Adenocarcinoma | 184 | 123 | 61 |
| PRAD | Prostate Adenocarcinoma | 497 | 274 | 223 |
| SARC | Sarcoma | 261 | 133 | 128 |
| SKCM | Skin Cutaneous Melanoma | 107 | 66 | 41 |
| STAD | Stomach Adenocarcinoma | 413 | 276 | 137 |
| UCEC | Uterine Corpus Endometrial Carcinoma | 544 | 335 | 209 |
| PAN-Cancer | 8810 | 4641 | 4169 |
Collectively, the mean age of those tumor patients was 60.58 years old. Based on the age at initial pathologic diagnosis, tumor patients were divided into old (older than 60 years) and young group (equal or younger than 60 years). There were 4,169 tumor patients in old group and 4,641 tumor patients in young group (Table 1). Although, generally, cancer was an old related disease, we showed that some tumor types were preferentially developed in young adults. Particularly, more than three quarter of LGG and CESC patients were younger than 60 years (Figure 1A), while, more than three quarter of BLCA and LUSC patients were older than 60 years (Figure 1A).
Age is most associated with the overall survival of LGG patients than other types of tumor patients. (A) Box plot showed the percentage of old (red) and young patients (blue) across 21 tumor types. (B) Overall survival was analyzed in old (red) and young patients (blue) across 21 tumor types. P value was generated from Log-rank test. (C) Overall survival was analyzed in old (red) and young patients (blue) in each 12 individual tumor type.
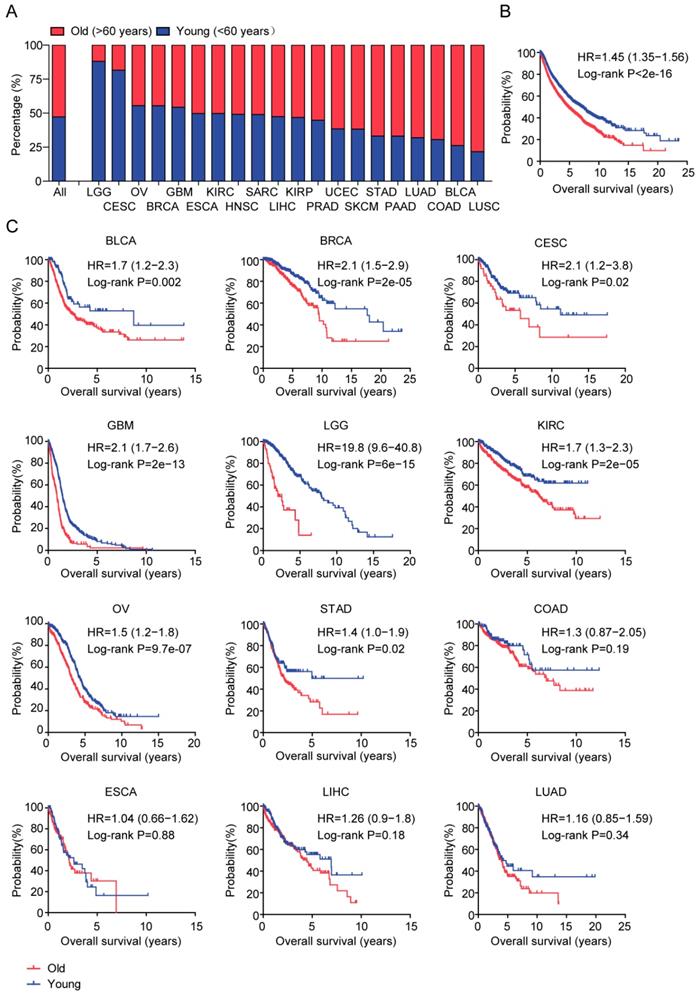
Next, we tested the associations between age and tumor overall survival. The Kaplan-Meier survival analysis showed that tumor patients in old group had lower overall survival compared with the tumor patients in young group (P<2e-16) (Figure 1B). The median survival time of young tumor patients was 7.05 years, much longer than the 4.76 years of old tumor patients.
Age is most associated with the overall survival of LGG patients than other types of tumor patients
Next, we studied the association between age and tumor overall survival in each tumor type. The Kaplan-Meier survival analysis demonstrated that age at initial pathologic diagnosis was a critical prognostic factor in 8 out of 21 tumor types, including BLCA, BRCA, CESC, GBM, LGG, KIRC, OV and STAD (Figure 1C). Particularly, age was most correlated with the overall survival of LGG patients (P=6e-15 and HR=19.8) (Figure 1C). The median survival time of old LGG patients was 1.99 years, contrast to the 7.88 years in young LGG patients. Although not as significant as LGG, the overall survival of old BCAL, BRCA, CESC, GBM, KIRC, OV and STAD patients were also significantly lower than young BCAL, BRCA, CESC, GBM, KIRC, OV and STAD patients (Figure 1C). However, age at initial pathologic diagnosis was not a prognostic factor in other tumor types, like COAD, ESCA, LIHC and LUAD (Figure 1C).
Our results suggested that, in most of tumor types and across tumor types, age at initial pathologic diagnosis was a critical prognostic factor. Particularly, age was most associated with the overall survival of LGG patients than other types of tumor patients.
Identification of age related genes in TCGA dataset
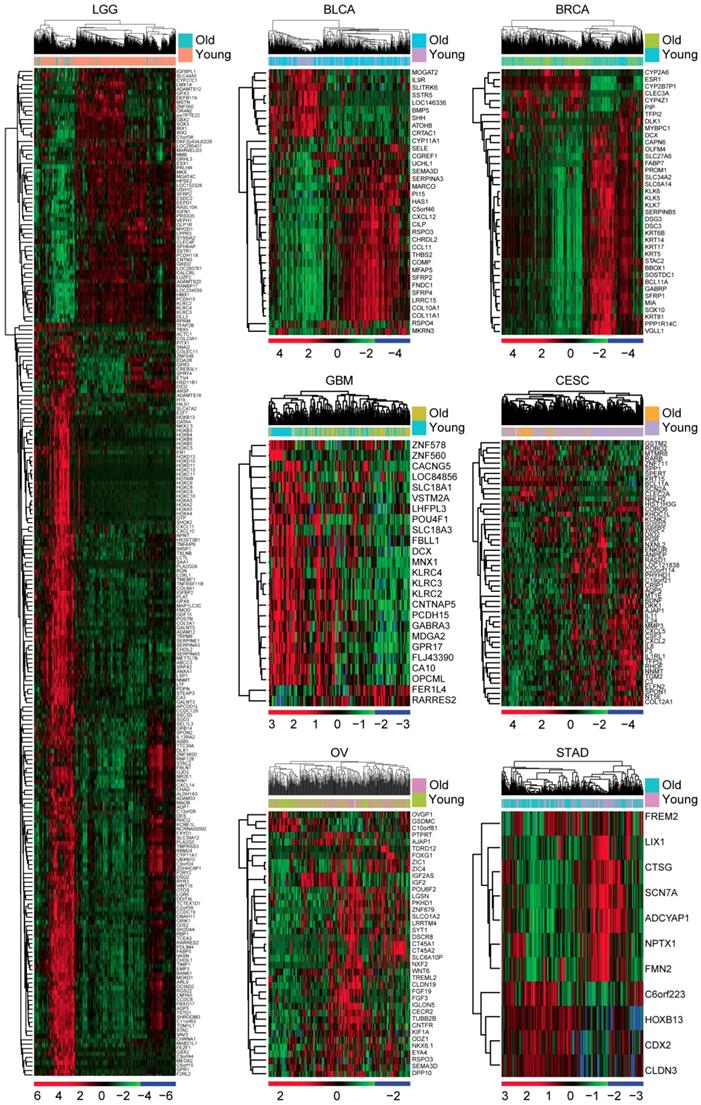
Next, we tried to determine the inner mechanisms of how age influenced the overall survival of tumor patients. Gene expression profiles of old patients in each age related tumor type were analyzed. Compared with the young tumor patients, genes up or down regulated in old tumor patients were identified respectively (fold change >2). We found that 230 genes were differentially expressed in old LGG patients (Figure 2). However, only 25 genes were differentially expressed in old GBM patients and 11 genes were differentially expressed in old STAD patients (Figure 2). Compared with young BLCA, BRCA, CESC and OV patients, genes differentially expressed in old BLCA, BRCA, CESC and OV patients were also identified (Figure 2). Consistent with the previous result that age was most associated with the overall survival of LGG patients than other types of tumor patients, we found that there were most age related genes in old LGG patients. So, in our further studies, we focused on LGG tumor type.
Identification of age related genes in TCGA dataset. Unsupervised clustering heatmaps demonstrated the differentially expressed genes (fold change >2) in old and young LGG, BLCA, BRCA, GBM, CESC, OV and STAD patients.
Validation of age related genes in glioma patients derived from GEO dataset
From the TCGA dataset, we found that old LGG patients were associated with low overall survival, and 230 genes were differentially expressed in old LGG patients. To further confirm those findings, we analyzed the functions of age related genes from GEO datasets.
GSE43378 included gene expression, age at initial pathologic diagnosis and overall survival of 50 glioma patients [39]. Similar with the results derived from the TCGA dataset, old glioma patients were associated with low tumor overall survival in GSE43378 dataset (P=0.0012) (Figure 3A). Compared with the young glioma patients, genes up or down regulated in old glioma patients were also identified (fold change >2). Heatmap demonstrated 165 age related genes in glioma patients derived from GSE43378 dataset (Figure 3B). Among them, 32 genes were also differentially expressed in LGG patients derived from TCGA dataset (Figure 3C). We then focused on those 32 genes for our further studies.
Validation of age related genes in glioma patients derived from GEO dataset. (A) Overall survival was analyzed in old (red) and young (blue) glioma patients in GSE43378 dataset. P value was generated from Log-rank test. (B) Unsupervised clustering heatmap demonstrated the differentially expressed genes (fold change >2) in old and young glioma patients in GSE43378 dataset. (C) Venn diagram depicted the common differentially expressed genes from TCGA and GSE43378 datasets. (D) Regulatory network was created by cytoscape using the 32 age related genes. (E) Box plots showed the IGFBP2, EMP3, TIMP1 and SERPINE1 expressions (log2 normalization count) in TCGA LGG patients. (F) Box plots showed the IGFBP2, EMP3, TIMP1 and SERPINE1 expressions (log2 signaling intensity) in GSE43378 glioma patients.
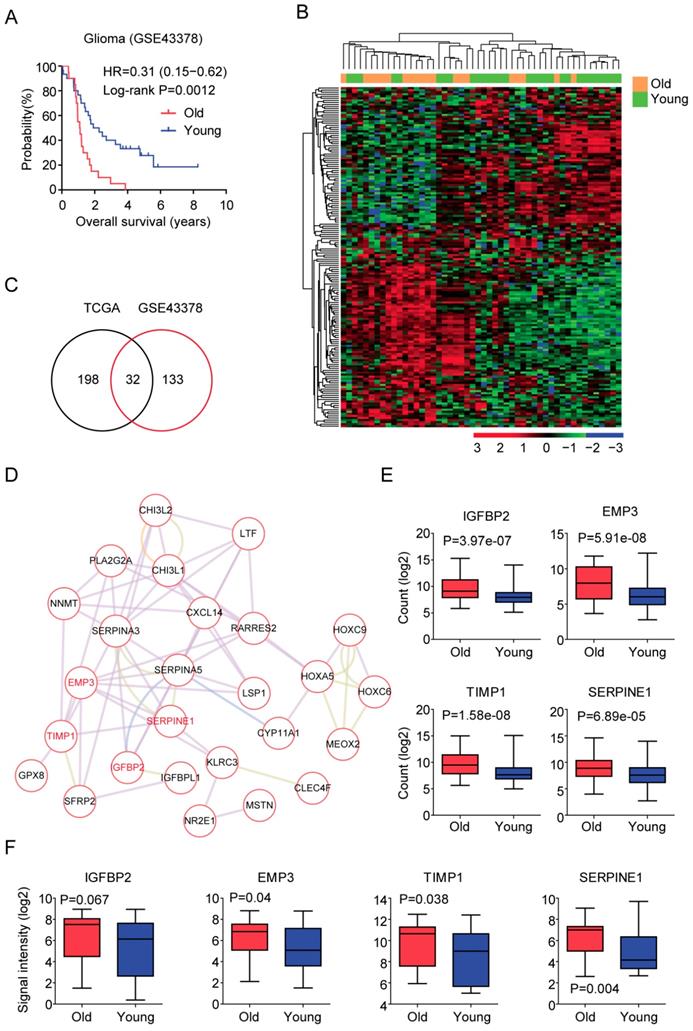
First, the regulatory network of those 32 age related genes was constructed using Cytoscape (Figure 3D). EMP3 was one of the hub genes in this network. Previous results suggested that EMP3 was a critical biomarker in glioma prognosis [28-32]. EMP was connected with TIMP1 and SERPINE1 and SERPINE1 was connected with IGFBP2 (Figure 3D). It had been reported that IGFBP2 could promote glioma development and was also a critical biomarker in glioma prognosis [33-35]. However, the prognostic effects of TIMP1 and SERPINE1 in LGG patients were unclear. We showed that IGFBP2, EMP3, TIMP1 and SERPINE1 were all highly expressed in old LGG patients compared with young LGG patients in TCGA dataset (Figure 3E). Similarly, old glioma patients were with high expressions of those genes in GSE43378 dataset (Figure 3F).
DNA methylation profiles of age related genes in LGG patients
Secondly, we tested the DNA methylation of age related genes in old LGG patients. Heatmap demonstrated the DNA methylation intensity (Beta value) of the 32 age related genes (Figure 4A). We found that some genes, for example TIMP1, NNMT and CHI3L2 genes were hyper-methylated in LGG patients, while, HOXC9, MEOX2, METTL7B, PRLHR, CXCL14 and IGFBP2 genes were hypo-methylated in LGG patients (Figure 4A).
DNA methylation profiles of age related genes in LGG patients. (A) Unsupervised clustering heatmap demonstrated the DNA methylation intensity (Beta value) of the 32 age related genes in old and young LGG patients. (B) Box plots showed the IGFBP2, EMP3, TIMP1 and SERPINE1 DNA methylation intensity (Beta value) in TCGA LGG patients.
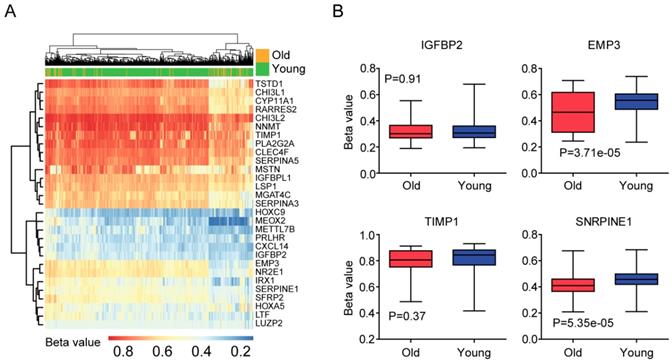
Previous results suggested that the expression of EMP3 in glioma patients was controlled by DNA methylation [29]. We found that DNA methylation intensity of EMP3 gene was lower in old LGG patients, compared with young LGG patients (P=3.71e-05) (Figure 4B). Similarly, age related gene SERPINE1 was hypo-methylated in old LGG patients, compared with young LGG patients (P=5.35e-05) (Figure 4B). We speculated that the hypo-methylations of EMP3 and SERPINE1 were contributing to the high expressions of EMP3 and SERPINE1 in old LGG patients (Figure 3E and 3F). However, we did not find significant different methylation intensity of IGFBP2 and TIMP1 between old and young LGG patients (Figure 4B). And how IGFBP2 and TIMP1 genes were increased in old LGG patients still needed further studies.
Expression profiles of age related genes in normal and glioma tissues
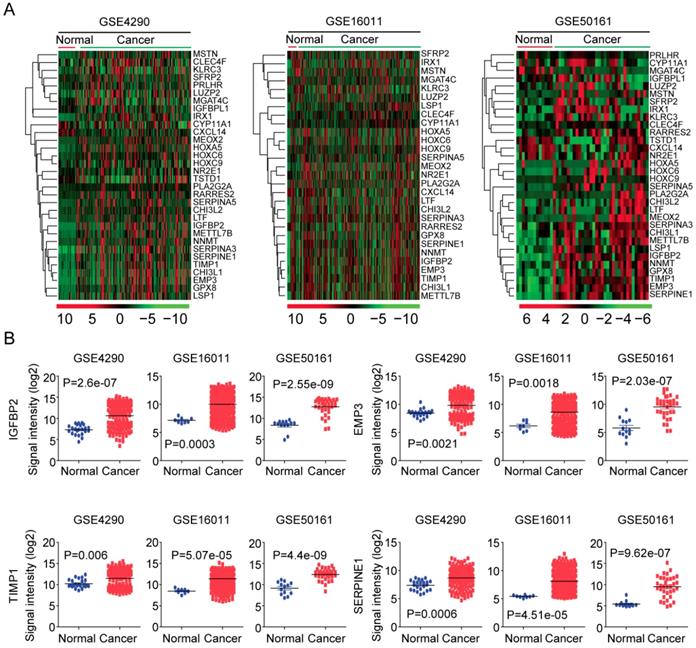
Next, using GSE4920 [36], GSE16011 [37] and GSE50161 [38] datasets, we tested the expressions of the 32 age related genes in normal brain tissues and glioma tumor tissues. As illustrated in the heatmaps, most age related genes were up regulated in glioma tumor tissues (Figure 5A). Interestingly, IGFBP2, EMP3, TIMP1 and SERPINE1 were clustered into a small group of genes in GSE4920, GSE16011 and GSE50161 three datasets. And as illustrated in the box plots, IGFBP2, EMP3, TIMP1 and SERPINE1 were all highly expressed in glioma tumor tissues, compared with the normal brain tissues (Figure 5B).
Expression profiles of age related genes in normal and glioma tissues. (A) Unsupervised clustering heatmaps demonstrated the expressions of the 32 age related genes in normal brain tissues and glioma tissues in GSE4920, GSE16011 and GSE50161 three datasets. (B) Box plots showed the IGFBP2, EMP3, TIMP1 and SERPINE1 expressions (log2 signaling intensity) in normal brain tissues and glioma tissues in GSE4920, GSE16011 and GSE50161 three datasets.
Prognostic significance of age related genes in glioma patients
Next, using univariate cox regression analysis, we determined the prognostic significance of age related genes in glioma patients in both TCGA and GSE43378 datasets. 25 genes out of 32 genes were significantly associated with tumor overall survival in both TCGA and GSE43378 datasets (P< 0.05) (Table 2), suggesting that the age related genes played important roles in determining the overall survival of LGG patients. For example, high IGFBP2, EMP3, TIMP1 and SERPINE1 expressions were all positively associated with the overall survival of LGG patients, while, high SFRP2, IRX1, KLRC3 and LUZP2 expressions were all negatively associated with the overall survival of LGG patients (Table 2).
Univariate cox regression was used to reveal the prognostic significance of age related genes in glioma patients.
| TCGA | GSE43378 | |||||||
|---|---|---|---|---|---|---|---|---|
| symbol | Coefficient | HR | P-value | 95% CI | Coefficient | HR | P-value | 95% CI |
| IGFBP2 | 0.44 | 1.55 | <2e-16 | 1.43-1.68 | 0.37 | 1.44 | 3.38e-06 | 1.24-1.68 |
| HOXA5 | 0.34 | 1.35 | <2e-16 | 1.27-1.44 | 0.25 | 1.28 | 0.0013 | 1.1-1.49 |
| SERPINA5 | 0.25 | 1.28 | <2e-16 | 1.21-1.36 | 0.365 | 1.43 | 4.50e-05 | 1.2-1.7 |
| RARRES2 | 0.23 | 1.26 | 1.2E-09 | 1.17-1.36 | 0.24 | 1.27 | 0.0012 | 1-1.46 |
| TIMP1 | 0.37 | 1.44 | <2e-16 | 1.33-1.57 | 0.42 | 1.52 | 1.07e-06 | 1.28-1.79 |
| PLA2G2A | 0.2 | 1.22 | 5.3e-11 | 1.15-1.29 | 0.31 | 1.37 | 4.30e-05 | 1.18-1.59 |
| CYP11A1 | 0.16 | 1.17 | 0.00455 | 1.05-1.30 | -0.03 | 0.97 | 0.79 | 0.81-1.18 |
| MEOX2 | 0.29 | 1.3 | <2e-16 | 1.25-1.41 | 0.26 | 1.29 | 0.0031 | 1.1-1.53 |
| HOXC9 | 0.39 | 1.46 | <2e-16 | 1.35-1.58 | 0.18 | 1.19 | 0.01 | 1.04-1.37 |
| HOXC6 | 0.31 | 1.36 | <2e-16 | 1.27-1.46 | 0.17 | 1.18 | 0.0097 | 1.04-1.34 |
| CXCL14 | 0.1 | 1.11 | 0.0177 | 1.02-1.2 | 0.21 | 1.24 | 0.022 | 1.03-1.48 |
| NR2E1 | 0.35 | 1.42 | 8.8e-01 | 1.27-1.6 | 0.15 | 1.17 | 0.13 | 0.96-1.42 |
| LSP1 | 0.45 | 1.57 | 2.1e-13 | 1.39-1.77 | 0.47 | 1.59 | 0.0031 | 1.17-2.16 |
| SERPINA3 | 0.29 | 1.33 | 2.7e-13 | 1.23-1.44 | 0.25 | 1.28 | 0.00031 | 1.12-1.46 |
| NNMT | 0.3 | 1.34 | 7.2e-16 | 1.25-1.44 | 0.25 | 1.29 | 1.04e-05 | 1.15-1.44 |
| LTF | 0.16 | 1.16 | 1.8e-10 | 1.11-1.22 | 0.14 | 1.15 | 0.000185 | 1.07-1.24 |
| GPX8 | 0.43 | 1.53 | <2e-16 | 1.39-1.68 | 0.41 | 1.5 | 2.90e-06 | 1.27-1.78 |
| EMP3 | 0.45 | 1.56 | <2e-16 | 1.44-1.7 | 0.37 | 1.44 | 4.19e-05 | 1.21-1.72 |
| SERPINE1 | 0.29 | 1.33 | 1.9e-11 | 1.23-1.45 | 0.37 | 1.45 | 7.70e-06 | 1.23-1.7 |
| METTL7B | 0.49 | 1.5 | <2e-16 | 1.38-1.64 | 0.44 | 1.55 | 4.39e-07 | 1.3-1.84 |
| CHI3L2 | 0.26 | 1.29 | 1.9e-10 | 1.19-1.39 | 0.27 | 1.3 | 0.00064 | 1.12-1.52 |
| CHI3L1 | 0.27 | 1.31 | <2e-16 | 1.24-1.38 | 0.27 | 1.31 | 2.81e-05 | 1.15-1.48 |
| TSTD1 | 0.35 | 1.42 | 1.7E-12 | 1.29-1.57 | 0.15 | 1.16 | 0.12 | 0.96-1.4 |
| IGFBPL1 | -0.13 | 0.88 | 0.0039 | 0.81-0.96 | -0.19 | 0.82. | 0.082 | 0.66-1.02 |
| MGAT4C | -0.31 | 0.73 | 1.2e-11 | 0.67-0.8 | -0.35 | 0.71 | 0.0001 | 0.59-0.84 |
| MSTN | -0.03 | 0.97 | 0.397 | 0.9-1.04 | -0.26 | 0.77 | 0.0033 | 0.65-0.92 |
| SFRP2 | -0.25 | 0.78 | <2e-16 | 0.73-0.82 | -0.13 | 0.88 | 0.031 | 0.78-0.99 |
| CLEC4F | -0.31 | 0.74 | 2.8e-08 | 0.66-0.82 | -0.13 | 0.88 | 0.19 | 0.72-1.1 |
| PRLHR | -0.23 | 0.79 | 6.2e-14 | 0.74-0.84 | -0.24 | 0.78 | 0.0011 | 0.68-0.91 |
| IRX1 | -0.04 | 0.96 | 0.26 | 0.9-1.03 | -0.02 | 0.98 | 0.82 | 0.84-1.15 |
| KLRC3 | -0.26 | 0.77 | 1.8e-13 | 0.72-0.83 | -0.18 | 0.83 | 0.017 | 0.71-0.97 |
| LUZP2 | -0.32 | 0.73 | <2e-16 | 0.67-0.78 | -0.35 | 0.71 | 0.0003 | 0.58-0.85 |
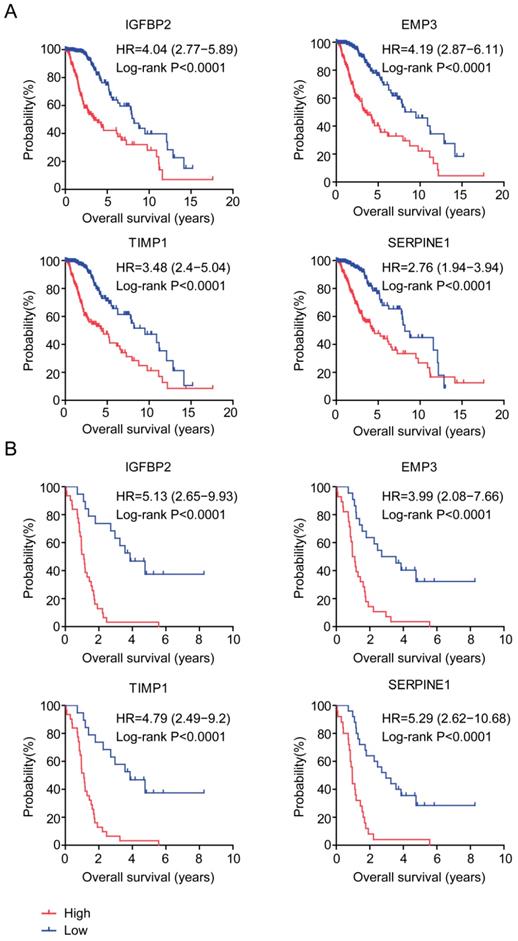
The prognostic significance of age related genes IGFBP2, EMP3, TIMP1 and SERPINE1 were further demonstrated in Kaplan-Meier survival analysis in glioma patients. Our results showed that, high expressions of IGFBP2, EMP3, TIMP1 and SERPINE1 genes were unfavorable prognostic markers in TCGA (Figure 6A) and GSE43378 patients (Figure 6B). LGG patients with higher expression of IGFBP2, EMP3, TIMP1 and SERPINE1 had worse prognosis than patients with low expression of those genes.
Prognostic significance of age related genes in glioma patients. (A) Relationships of IGFBP2, EMP3, TIMP1 and SERPINE1 expressions and overall survival were analyzed in TCGA dataset. Kaplan-Meier survival analysis was used to compare IGFBP2, EMP3, TIMP1 and SERPINE1 highly expressed LGG patients (red) with IGFBP2, EMP3, TIMP1 and SERPINE1 lowly expressed LGG patients (blue). P values were generated from Log-rank test. (B) Relationships of IGFBP2, EMP3, TIMP1 and SERPINE1 expressions and overall survival were analyzed in GSE43378 dataset.
Combined EMP3 and SERPINE1 genes in glioma overall survival prediction
We also used multivariate cox regression to reveal the connection of IGFBP2, EMP3, TIMP1 and SERPINE1 genes in determining the clinical overall survival of LGG patients. We found that IGFBP2, EMP3 and TIMP1 were independent prognostic markers in TCGA LGG patients (Figure 7A). However, in GSE43378 dataset, IGFBP2, EMP3, TIMP1 and SERPINE1 genes were interconnected with each other, and those genes were not independent prognostic markers (Figure 7A).
Combined EMP3 and SERPINE1 genes in glioma overall survival prediction. (A) Multivariate cox regression was used to test the relationships of IGFBP2, EMP3, TIMP1 and SERPINE1 expressions and overall survival in glioma patients in TCGA and GSE43378 datasets. (B) Kaplan-Meier plotters demonstrated the different overall survival of glioma patients with high expressions of EMP3 and SERPINE1 and glioma patients with low expressions of EMP3 or SERPINE1 in TCGA and GSE43378 datasets. Log-rank test was used to determine the P values. (C) Spearman correlation between EMP3 and SERPINE1 expressions in TCGA and GSE43378 datasets was determined.
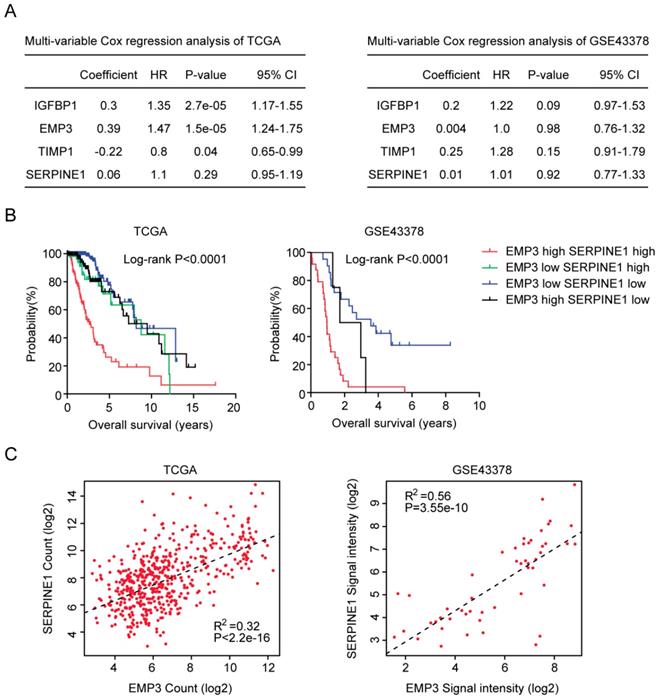
So, in both TCGA and GSE43378 datasets, SERPINE1 was not an independent prognostic marker. We thought that the combination of SERPINE1 with other age related genes, particular EMP3, could be used as better prognostic marker in LGG patients. To test this hypothesis, the average expression level of EMP3 and SERPINE1 was calculated. Based on the average expression level of EMP3 and SERPINE1, glioma patients were divided into four groups. We found that patients with both high EMP3 and SERPINE1 expressions were particular with lowest overall survival in glioma patients (Figure 7B). Patients with the low expression of EMP3 or SERPINE1 had better clinical outcomes (Figure 7B). At last, we tried to determine the connection between EMP3 and SERPINE1. Spearman correlation demonstrated a high correlation between EMP3 and SERPINE1 in glioma expression TCGA and GSE43378 datasets ((Figure 7C).
Validation of age related genes in Chinese LGG patients
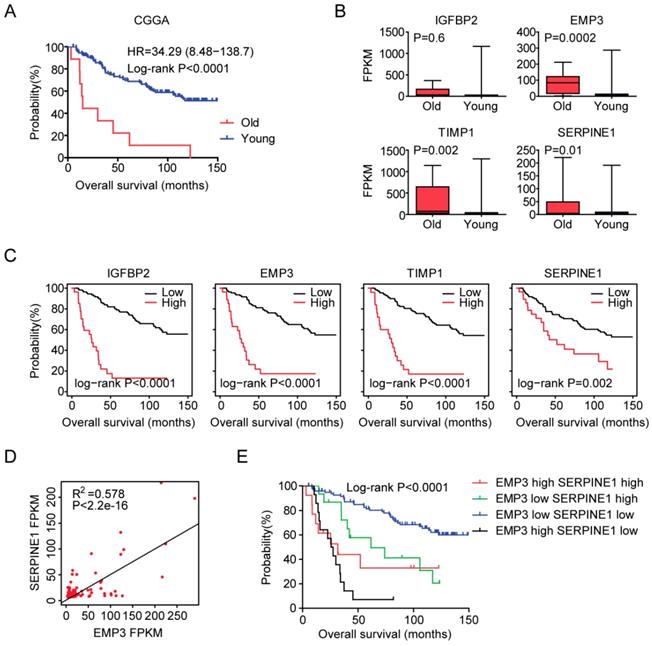
At last, we tried to validate the age related genes in Chinese LGG patients. 140 LGG patients were collected from the Chinese Glioma Genome Atlas (CGGA) dataset. Similar with the previous results, old LGG patients (older than 60 years) were associated with low tumor overall survival in CGGA dataset (P<0.0001) (Figure 8A). Also, EMP3, TIMP1 and SERPINE1 were all highly expressed in old LGG patients compared with young LGG patients (Figure 8B). However, we did not find significant different expression level of IGFBP2 between old and young LGG patients. We also showed that the high expressions of IGFBP2, EMP3, TIMP1 and SERPINE1 genes were associated with the unfavorable prognosis of LGG patients in CGGA dataset (Figure 8C). Moreover, EMP3 and SERPINE1 were highly correlated with each other (Figure 8D) and the combination of EMP3 and SERPINE1 genes had better survival prediction in Chinese patients with LGG (Figure 8E). All those results were quietly similar with the results derived from TCGA and GSE43378 datasets.
Validation of age related genes in Chinese LGG patients derived from CGGA dataset. (A) Overall survival was analyzed in old (red) and young (blue) LGG patients in CGGA dataset. P value was generated from Log-rank test. (B) Box plots showed the IGFBP2, EMP3, TIMP1 and SERPINE1 expressions (FPKM) in CGGA LGG patients. (C) Relationships of IGFBP2, EMP3, TIMP1 and SERPINE1 expressions and overall survival were analyzed in CGGA dataset. Kaplan-Meier survival analysis was used to compare IGFBP2, EMP3, TIMP1 and SERPINE1 highly expressed LGG patients (red) with IGFBP2, EMP3, TIMP1 and SERPINE1 lowly expressed LGG patients (black). P values were generated from Log-rank test. (D) Spearman correlation between EMP3 and SERPINE1 expression in CGGA dataset was determined. (E) Kaplan-Meier plotters demonstrated the different overall survival of glioma patients with high expressions of EMP3 and SERPINE1 and glioma patients with low expressions of EMP3 or SERPINE1 in CGGA dataset. Log-rank test was used to determine the P values.
Discussion
With the increasing of age, high incidence of cancer is occurred. For example, more than 70% of LUSC, BLCA and COAD patients are diagnosed in old adults (Figure 1A). However, some tumors are particularly developed in young adults, like LGG and CESC. Nearly 90% LGG and CESC patients are developed under 60 years old (Figure 1A). Those observations highlight the age related disparities in different tumor types. Although, in general, old tumor patients have worse prognosis than young tumor patients (Figure 1B), age only is not always associated with the overall survival in all tumor types [40, 41]. For example, there is no difference in the clinical overall survival in old LUAD, LIHC, ESCA and COAD patients compared with young LUAD, LIHC, ESCA and COAD patients (Figure 1C). However, LGG is one of the most age related tumor type. Age is most associated with the overall survival of LGG patients than other types of tumor patients (Figure 1C). Moreover, there are most age related genes in old LGG patients (Figure 2). Those observations intrigue great interests for the further studies of age related molecular profiles in LGG patients.
First, the age related genes in LGG patients are identified from TCGA dataset (Figure 2), and validated using GSE43378 and CGGA datasets (Figure 3 and 8). DNA methylation intensity (Figure 4A and 4B) and prognostic effects (Table 2) of those age related genes are also demonstrated. Furthermore, the expression profiles of age related genes in normal and glioma tissues are revealed (Figure 5A). Base on those results, we find four age related genes IGFBP2, EMP3, TIMP1 and SERPINE1 may represent suitable biomarkers for prognostic strategies of LGG patients.
The prognostic effects of EMP3 [28-32] and IGFBP2 [33-35] in glioma patients are extensively studied. Here, we find two EMP3 and IGFBP2 associated genes TIMP1 and SERPINE1 are also suitable biomarkers for prognosis of glioma patients. EMP3, IGFBP2, TIMP1 and SERPINE1 are highly expressed in old LGG patients (Figure 3E and 3F). In LGG tumor tissues, EMP3, IGFBP2, TIMP1 and SERPINE1 are all highly expressed, compared with normal brain tissues (Figure 5B). Furthermore, high expressions of IGFBP2, EMP3, TIMP1 and SERPINE1 are associated with low overall survival of LGG patients (Figure 6). Interestingly, EMP3 and SERPINE1 are connected with each other and the combination of EMP3 and SERPINE1 genes have better prognostic effects in glioma patients (Figure 7B and 7C).
Our results also show some inner mechanisms of how EMP3 and SERPINE1 are increased in old LGG patients. We find that EMP3 and SERPINE1 are hypo-methylated in old LGG patients, compared with young LGG patients (Figure 4B). Although the expression of IGFBP2 is controlled by epigenetic DNA methylation in glioma patients [42], we find no significant different methylation intensity of IGFBP2 and TIMP1 genes between old and young LGG patients (Figure 4B). So, how IGFBP2 and TIMP1 genes are increased in old LGG patients still need further studies.
Overall, our results provide deep understandings of how age and age related genes influence the clinical overall survival of LGG patients. Although clinical further validations are needed, our analysis suggest that IGFBP2, EMP3, TIMP1 and SERPINE1 genes, particular the combination of EMP3 and SERPINE1, could be used as biomarkers to predict the overall survival of LGG patients.
Conclusions
Age related genes IGFBP2, EMP3, TIMP1 and SERPINE1 have significant prognostic effects in LGG patients.
Abbreviations
TCGA: The Cancer Genome Atlas; GEO: Gene Expression Omnibus; CGGA: Chinese Glioma Genome Atlas; BLCA: Bladder Urothelial Carcinoma; BRCA: Breast Invasive Carcinoma; CESC: Cervical Squamous Cell Carcinoma; COAD: Colon Adenocarcinoma; ESCA: Esophageal Adenocarcinoma; GBM: Glioblastoma Multiforme; HNSC: Head and Neck Squamous Cell Carcinoma; KIRC: Kidney Renal Clear Cell Carcinoma; KIRP: Kidney Renal Papillary Cell Carcinoma; LGG: Brain Lower Grade Glioma; LIHC: Liver Hepatocellular Carcinoma; LUAD: Lung Adenocarcinoma; LUSC: Lung Squamous Cell Carcinoma; OV: Ovarian Serous Cystadenocarcinoma; PAAD: Pancreatic Adenocarcinoma; PRAD: Prostate Adenocarcinoma; SARC: Sarcoma; SKCM: Skin Cutaneous Melanoma; STAD: Stomach Adenocarcinoma; UCEC: Uterine Corpus Endometrial Carcinoma.
Supplementary Material
Supplementary table.
Acknowledgements
This study was supported by grants from Fujian Provincial Maternity and Children's Hospital (No.YCXB 18-10 and No.YCXM 19-04). This study was also supported by National Natural Science Foundation (No.81370655).
Competing Interests
The authors have declared that no competing interest exists.
References
1. Xie M, Lu C, Wang J, McLellan MD, Johnson KJ, Wendl MC. et al. Age-related mutations associated with clonal hematopoietic expansion and malignancies. Nat Med. 2014;20:1472-8
2. Ben-Aharon I, Elkabets M, Pelossof R, Yu KH, Iacubuzio-Donahue CA, Leach SD. et al. Genomic Landscape of Pancreatic Adenocarcinoma in Younger versus Older Patients: Does Age Matter? Clin Cancer Res. 2019;25:2185-93
3. Andersson AK, Ma J, Wang J, Chen X, Gedman AL, Dang J. et al. The landscape of somatic mutations in infant MLL-rearranged acute lymphoblastic leukemias. Nat Genet. 2015;47:330-7
4. Tomasetti C, Vogelstein B, Parmigiani G. Half or more of the somatic mutations in cancers of self-renewing tissues originate prior to tumor initiation. Proc Natl Acad Sci U S A. 2013;110:1999-2004
5. Goldvaser H, Purim O, Kundel Y, Shepshelovich D, Shochat T, Shemesh-Bar L. et al. Colorectal cancer in young patients: is it a distinct clinical entity? Int J Clin Oncol. 2016;21:684-95
6. Reding KW, Doody DR, McTiernan A, Hsu L, Davis S, Daling JR. et al. Age-related variation in the relationship between menopausal hormone therapy and the risk of dying from breast cancer. Breast Cancer Res Treat. 2011;126:749-61
7. Yin Z, Wang Y, Wu Y, Zhang X, Wang F, Wang P. et al. Age distribution and age-related outcomes of olfactory neuroblastoma: a population-based analysis. Cancer Manag Res. 2018;10:1359-64
8. Marcucci G, Metzeler KH, Schwind S, Becker H, Maharry K, Mrozek K. et al. Age-related prognostic impact of different types of DNMT3A mutations in adults with primary cytogenetically normal acute myeloid leukemia. J Clin Oncol. 2012;30:742-50
9. Wang J, Wang FW. Impact of age on clinical presentation, treatment, and cancer-specific survival of patients with small-cell carcinoma of the prostate. Clin Interv Aging. 2013;8:871-7
10. Mao JH, Diest PJV, Perez-Losada J, Snijders AM. Revisiting the impact of age and molecular subtype on overall survival after radiotherapy in breast cancer patients. Sci Rep. 2017;7:12587
11. Aquina CT, Mohile SG, Tejani MA, Becerra AZ, Xu Z, Hensley BJ. et al. The impact of age on complications, survival, and cause of death following colon cancer surgery. Br J Cancer. 2017;116:389-97
12. Sakakibara A, Matsui K, Katayama T, Higuchi T, Terakawa K, Konishi I. Age-related survival disparity in stage IB and IIB cervical cancer patients. J Obstet Gynaecol Res. 2019;45:686-94
13. Weinstein JN, Collisson EA, Mills GB, Shaw KR, Ozenberger BA, Ellrott K. et al. The Cancer Genome Atlas Pan-Cancer analysis project. Nat Genet. 2013;45:1113-20
14. Hutter C, Zenklusen JC. The Cancer Genome Atlas: Creating Lasting Value beyond Its Data. Cell. 2018;173:283-5
15. Uhlen M, Zhang C, Lee S, Sjostedt E, Fagerberg L, Bidkhori G. et al. A pathology atlas of the human cancer transcriptome. Science. 2017 357
16. Liu J, Lichtenberg T, Hoadley KA, Poisson LM, Lazar AJ, Cherniack AD. et al. An Integrated TCGA Pan-Cancer Clinical Data Resource to Drive High-Quality Survival Outcome Analytics. Cell. 2018;173:400-16 e11
17. Bailey MH, Tokheim C, Porta-Pardo E, Sengupta S, Bertrand D, Weerasinghe A. et al. Comprehensive Characterization of Cancer Driver Genes and Mutations. Cell. 2018;174:1034-5
18. Saghafinia S, Mina M, Riggi N, Hanahan D, Ciriello G. Pan-Cancer Landscape of Aberrant DNA Methylation across Human Tumors. Cell Rep. 2018;25:1066-80 e8
19. Weisenberger DJ. Characterizing DNA methylation alterations from The Cancer Genome Atlas. J Clin Invest. 2014;124:17-23
20. Bao ZS, Chen HM, Yang MY, Zhang CB, Yu K, Ye WL. et al. RNA-seq of 272 gliomas revealed a novel, recurrent PTPRZ1-MET fusion transcript in secondary glioblastomas. Genome Res. 2014;24:1765-73
21. Zhao Z, Meng F, Wang W, Wang Z, Zhang C, Jiang T. Comprehensive RNA-seq transcriptomic profiling in the malignant progression of gliomas. Sci Data. 2017;4:170024
22. Hu H, Mu Q, Bao Z, Chen Y, Liu Y, Chen J. et al. Mutational Landscape of Secondary Glioblastoma Guides MET-Targeted Trial in Brain Tumor. Cell. 2018;175:1665-78 e18
23. Ostrom QT, Gittleman H, Liao P, Rouse C, Chen Y, Dowling J. et al. CBTRUS statistical report: primary brain and central nervous system tumors diagnosed in the United States in 2007-2011. Neuro Oncol. 2014;16(Suppl 4):iv1-63
24. Louis DN, Perry A, Reifenberger G, von Deimling A, Figarella-Branger D, Cavenee WK. et al. The 2016 World Health Organization Classification of Tumors of the Central Nervous System: a summary. Acta Neuropathol. 2016;131:803-20
25. Network TCGAR. Comprehensive genomic characterization defines human glioblastoma genes and core pathways. Nature. 2008;455:1061-8
26. Brat DJ, Verhaak RG, Aldape KD, Yung WK, Salama SR, Cooper LA. et al. Comprehensive, Integrative Genomic Analysis of Diffuse Lower-Grade Gliomas. N Engl J Med. 2015;372:2481-98
27. Noushmehr H, Weisenberger DJ, Diefes K, Phillips HS, Pujara K, Berman BP. et al. Identification of a CpG island methylator phenotype that defines a distinct subgroup of glioma. Cancer Cell. 2010;17:510-22
28. Ernst A, Hofmann S, Ahmadi R, Becker N, Korshunov A, Engel F. et al. Genomic and expression profiling of glioblastoma stem cell-like spheroid cultures identifies novel tumor-relevant genes associated with survival. Clin Cancer Res. 2009;15:6541-50
29. Yue H, Xu Q, Xie S. High EMP3 expression might independently predict poor overall survival in glioblastoma and its expression is related to DNA methylation. Medicine (Baltimore). 2018;97:e9538
30. Gao YF, Zhu T, Mao CX, Liu ZX, Wang ZB, Mao XY. et al. PPIC, EMP3 and CHI3L1 Are Novel Prognostic Markers for High Grade Glioma. Int J Mol Sci. 2016 17
31. Pasini A, Iorio P, Bianchi E, Cerasoli S, Cremonini AM, Faedi M. et al. LOH 19q indicates shorter disease progression-free interval in low-grade oligodendrogliomas with EMP3 methylation. Oncol Rep. 2012;28:2271-7
32. Shu C, Wang Q, Yan X, Wang J. Whole-Genome Expression Microarray Combined with Machine Learning to Identify Prognostic Biomarkers for High-Grade Glioma. J Mol Neurosci. 2018;64:491-500
33. Huang LE, Cohen AL, Colman H, Jensen RL, Fults DW, Couldwell WT. IGFBP2 expression predicts IDH-mutant glioma patient survival. Oncotarget. 2017;8:191-202
34. Moore LM, Holmes KM, Smith SM, Wu Y, Tchougounova E, Uhrbom L. et al. IGFBP2 is a candidate biomarker for Ink4a-Arf status and a therapeutic target for high-grade gliomas. Proc Natl Acad Sci U S A. 2009;106:16675-9
35. Hsieh D, Hsieh A, Stea B, Ellsworth R. IGFBP2 promotes glioma tumor stem cell expansion and survival. Biochem Biophys Res Commun. 2010;397:367-72
36. Sun L, Hui AM, Su Q, Vortmeyer A, Kotliarov Y, Pastorino S. et al. Neuronal and glioma-derived stem cell factor induces angiogenesis within the brain. Cancer Cell. 2006;9:287-300
37. Gravendeel LA, Kouwenhoven MC, Gevaert O, de Rooi JJ, Stubbs AP, Duijm JE. et al. Intrinsic gene expression profiles of gliomas are a better predictor of survival than histology. Cancer Res. 2009;69:9065-72
38. Griesinger AM, Birks DK, Donson AM, Amani V, Hoffman LM, Waziri A. et al. Characterization of distinct immunophenotypes across pediatric brain tumor types. J Immunol. 2019;191:4880-8
39. Kawaguchi A, Yajima N, Tsuchiya N, Homma J, Sano M, Natsumeda M. et al. Gene expression signature-based prognostic risk score in patients with glioblastoma. Cancer Sci. 2013;104:1205-10
40. Gately L, Collins A, Murphy M, Dowling A. Age alone is not a predictor for survival in glioblastoma. J Neurooncol. 2016;129:479-85
41. Li D, Morris JS, Liu J, Hassan MM, Day RS, Bondy ML. et al. Body mass index and risk, age of onset, and survival in patients with pancreatic cancer. JAMA. 2009;301:2553-62
42. Zheng S, Houseman EA, Morrison Z, Wrensch MR, Patoka JS, Ramos C. et al. DNA hypermethylation profiles associated with glioma subtypes and EZH2 and IGFBP2 mRNA expression. Neuro Oncol. 2011;13:280-9
Author contact
![]() Corresponding authors: 1) Haiwei Wang, Email: hwwangac.cn, Phone: +86 15901919376. 2) Hua Cao, Email: caohua69edu.cn, Phone: +86 0591 88010282. 3) Ji Zhang, Email: Zj11222com.cn, Phone: +86 021 64370045
Corresponding authors: 1) Haiwei Wang, Email: hwwangac.cn, Phone: +86 15901919376. 2) Hua Cao, Email: caohua69edu.cn, Phone: +86 0591 88010282. 3) Ji Zhang, Email: Zj11222com.cn, Phone: +86 021 64370045