Impact Factor ISSN: 1837-9664

 Global reach, higher impact
J Cancer 2020; 11(15):4542-4549. doi:10.7150/jca.45077 This issue Cite
Research Paper
Circulating let-7f-5p improve risk prediction of prostate cancer in patients with benign prostatic hyperplasia
Yuqiu Ge1* ![]() , Qiangdong Wang2,3*, Wei Shao4*, You Zhao5, Qianqian Shi5, Qinbo Yuan2,3
, Qiangdong Wang2,3*, Wei Shao4*, You Zhao5, Qianqian Shi5, Qinbo Yuan2,3 ![]() , Li Cui5
, Li Cui5 ![]()
1. Department of Public Health and Preventive Medicine, Wuxi School of Medicine, Jiangnan University, Wuxi, China.
2. Department of Urology, Huaiyin Hospital of Huai'an City, Huai'an, China.
3. Department of Urology, Huaiyin People's Hospital of Huai'an City, Huai'an, China.
4. Department of Science and Technology, Sir Run Run Hospital, Nanjing Medical University, Nanjing, China.
5. Department of Urology, The Third Affiliated Hospital of Soochow University, Changzhou, China.
*These authors contributed equally to this work.
Received 2020-2-19; Accepted 2020-4-21; Published 2020-5-18
Abstract
Background: Although the prostate-specific antigen (PSA) testing was widely used for early detection of prostate cancer (PCa), it is difficult for PSA to distinguish the PCa from benign prostatic hyperplasia (BPH) patients. Emerging evidence has shown that microRNA (miRNA) was a promising biomarker for PCa screening.
Methods: We applied miRNA profiling from microarray or high-throughput sequencing in Gene Expression Omnibus (GEO) and The Cancer Genome Atlas (TCGA) databases to identify the differentially expressed miRNAs in PCa patients (n = 1,017) and controls (n = 413). Then, qRT-PCR analysis was used to validate the expression of candidate miRNAs in our independent cohort, include 66 PCa cases and 63 BPH patients diagnosed by biopsy. The area under the receiver operating characteristic curve (AUC) was conducted to evaluate the diagnostic efficacy of miRNAs and PSA.
Results: In the microarray analysis, we identified two consistently differently expressed miRNAs (miR-103a-3p and let-7f-5p) between PCa patients and controls. In the subsequent qRT-PCR analysis, the let-7f-5p was upregulated in PCa compared with BPH patients (P=2.17E-07), but no statistically difference of miR-103a-3p expression was observed (P=0.456). The AUC was 0.904 for combination of lef-7f-5p and PSA, which was significantly higher than that of let-7f-5p (0.782) or PSA (0.795) alone (P=7.55E-04 and P=2.09E-03, respectively). Besides, the results of decision curve analysis and nomogram prediction indicated that combination of let-7f-5p and PSA had superior predictive accuracy of PCa.
Conclusions: Our study suggests that plasma let-7f-5p combining PSA could serve as potentially diagnostic biomarkers for PCa.
Keywords: microRNA, prostate cancer, benign prostatic hyperplasia, diagnostic biomarker
Introduction
Globally, prostate cancer (PCa) is the third common cancer for men with 1.33 million cases and 0.42 million deaths in 2017[1]. It was reported that the incidence of advanced and metastatic PCa was increased in the United States from 2007[2]. In recent years, prostate-specific antigen (PSA) was widely used in early detection of PCa and had an effect on the reduction of metastatic PCa at diagnosis [3]. However, PSA is still a controversial biomarker for its limited specificity and low negative predictive value for antidiastole of PCa versus benign disease [4]. The new biomarkers for improvements of PCa screening were urgent.
It is well established that small non-coding RNAs known as microRNAs (miRNAs) are involved in the carcinogenesis of cancer by altering the post-transcriptional regulation [5]. The miRNAs participated in a diversity of biologic processes, such as cell differentiation, proliferation and apoptosis [6, 7]. The aberrant miRNAs were often observed in multiple cancers [8]. There were many deregulated miRNAs in PCa tissues, for example downregulation of the miR-205 [9] or miR-143/145 cluster [10], and upregulation of miR-21 [11] or miR-183 family [12]. For the important functions of miRNAs, mounting evidence supported that miRNAs may act as diagnostic and prognostic biomarkers for PCa [13, 14]. Recently, Luo et al. found that miR-1246 was a promising biomarker for diagnosis and monitor the aggressiveness of PCa [15]. Another study revealed that miRNAs combined with PSA testing may increase the accuracy of PCa detection [16]. To identify PCa-associated miRNAs and assess its diagnostic value may provide beneficial information for screening and management of PCa patients.
In the present study, we used multiple high-sequencing miRNA profiles or miRNA array files in public databases, including Gene Expression Omnibus (GEO) and The Cancer Genome Atlas (TCGA), to systematically screen differentially expressed miRNAs (DEMIs) between PCa cases and cancer-free controls. Furthermore, we validated the expression of these significant miRNAs in independent PCa and benign prostatic hyperplasia (BPH) patients and assessed their discernibility ability of PCa detection.
Materials and Methods
Clinical samples and ethical statement
A total of 66 PCa and 63 BPH plasma samples were acquired from Changzhou hospital between Sep, 2017 and Aug, 2018. The diagnosis of PCa and BPH were confirmed by two clinical pathologists using biopsy. All of the subjects have written the informed consents. The Institutional Review Board of The Third Affiliated Hospital of Soochow University approved this study.
Data availability
In the discovery phase, the miRNA microarrays in GEO dataset (GSE112264 [17] and GSE113234 [16]) were used to identify differentially expressed circulating miRNAs between PCa and cancer-free samples. Then we applied the other independent miRNA array datasets to identify and validate the consistently significant miRNAs. GSE113486 [18] and GSE60117 [19] were used in the first validation phase (validation I). The miRNA expression by RNAseq from TCGA database, downloaded in UCSC Xena project (http://xena.ucsc.edu/), was used in the second validation phase (validation II). The detail information of GEO and TCGA datasets is summarized in Supplementary Table 1.
Measurement of markers in human plasma
Quantitative real-time PCR (qRT-PCR) analysis was applied to detect the expression of candidate miRNAs in our plasma samples. The RNA was extracted from 100 μL of plasma using QIAGEN miRNeasy Mini Kit (Qiagen, CA, USA) according to the instructions in the manual. We applied Takara RNA PCR Kit (AMV) to conduct miRNA reverse transcription. The qRT-PCR was performed using SYBR(R) PrimeScript™ RT-PCR Kit (Takara Bio). The ABI 7900HT Real-Time PCR System (Applied Biosystem, Foster City, CA, USA) was used to detect the expression of candidate miRNAs and the internal reference was U6. Raw data were exported using SDS software and analyzed with the RQ manager software (Applied Biosystems, Foster City, CA, USA). The reverse transcription primer and PCR primers sequence of candidate miRNAs (miR-103a-3p and let-7f-5p) and U6 are shown in Supplementary Table 2.
Statistical analysis
Continuous variables were described as mean ± standard deviation, and student's t test was conducted to assess the differences of miRNA expression between two groups. Univariate and multivariable logistic regression models were applied to assess the effects of let-7f-5p, PSA alone and combination of let-7f-5p and PSA. We calculated the area under the curve (AUC) and corresponding 95% confidence interval (95%CI) to evaluate the diagnostic efficacy of let-7f-5p and PSA. To investigate whether the AUC of let-7f-5p, PSA alone and their combination were different, DeLong's test was conducted to assess the difference in AUC between two models. Decision Curve Analysis was applied to compare the clinical net benefit of different prediction models. We used the nomogram to evaluate the risk of PCa and the calibration curve was used to assess predictive accuracy of monogram. In this study, two-sided P value less than 0.05 was treated as statistically significant. All statistical analyses were performed by R 3.6.1 software. Receiver operating characteristic (ROC) curve analysis was conducted by “pROC” package. Decision Curve Analysis was done using “rmda” package. Nomogram and calibration curve analysis was performed with “rms” package.
Results
Screening of candidate miRNAs for PCa
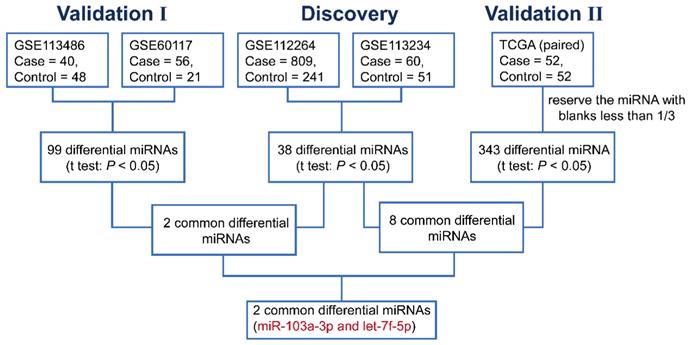
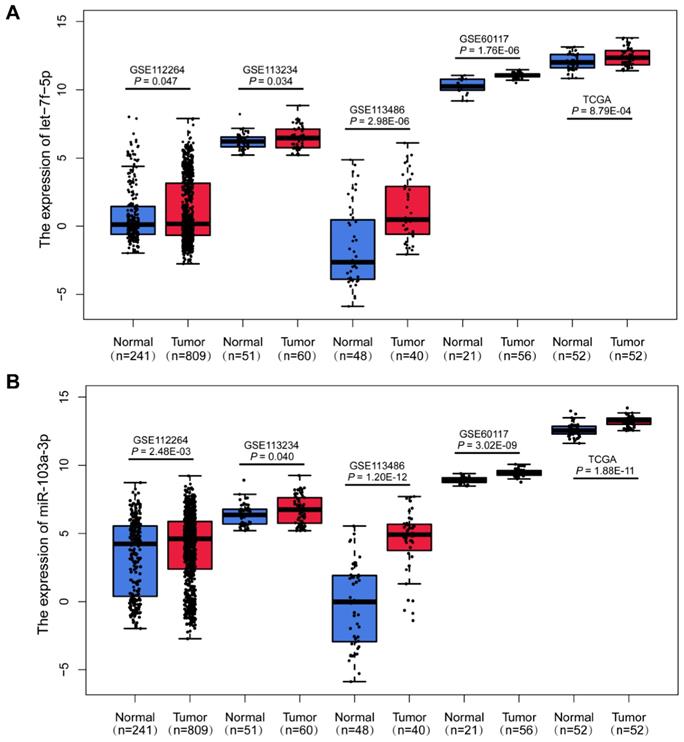
In the discovery phase, we downloaded the miRNA expression profiles from GEO database (GSE112264; GSE113234), and identified 38 differentially expressed miRNAs (DEMIs) between PCa cases and controls in the both datasets (P<0.05). In the following validation I, the other two GEO datasets (GSE113486; GSE60117) were analyzed and 99 DEMIs were observed. Among them, 2 miRNAs were significantly dysregulated in both discovery and validation I phase. Furthermore, miRNA expression from TCGA RNAseq dataset of 52 paired PCa tissues and adjacent normal tissues was acquire (validation II). And there were 343 DEMIs between PCa tumor and adjacent normal tissues and 8 consistently dysregulated miRNAs were found in both discovery and validation II phase. Altogether, we integrated and acquired the consistently dysregulated miRNAs between discovery, validation I and validation II phases. Two consistently differential miRNAs miR-103a-3p and let-7f-5p were screened by microarray and RNAseq analysis (Figure 1). As shown in Figure 2, the expression level of miR-103a-3p and let-7f-5p were both significantly higher in PCa patients than that in cancer-free controls (P<0.05).
The flow chart for selecting candidate miRNAs in PCa.
Upregulation of miR-103a-3p and let-7f-5p in PCa. Boxplots of let-7f-5p (A) and miR-103a-3p (B) expression in PCa patients and cancer-free controls from GSE112264, GSE113234, GSE113486, GSE60117 and TCGA datasets.
Validation of miR-103a-3p and let-7f-5p in our plasma samples
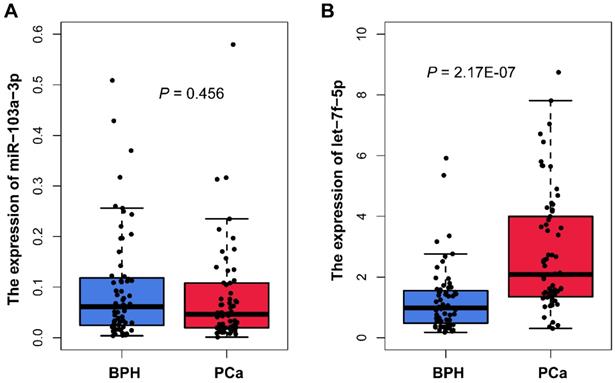
We measured the miR-103a-3p and let-7f-5p expression in plasma samples from 66 PCa and 63 BPH patients using qRT-PCR analysis. The characteristics of samples are summarized in Table 1. The results showed that there was no statistically difference in miR-103a-3p expression between PCa and BPH patients (P=0.456; Figure 3A). For another candidate miRNA let-7f-5p, the result of qRT-PCR was consistency with the microarray analysis. We found significant higher expression of let-7f-5p in PCa plasma, as compared with BPH patients (P=2.17E-07; Figure 3B). We also evaluated whether the let-7f-5p was related to the clinical features of PCa patients recruited in this study. The results indicated that the expression level of let-7f-5p was slightly associated with the age of patient (P=0.064), and no significant associations were observed in stage, gleason score, PSA level and bone metastasis status (Table 2).
Characteristics of PCa and BPH patients
| Variables | Prostate cancer (n=66) | Benign Prostatic Hyperplasia (n=63) |
|---|---|---|
| Age | 72.0 ±7.1 | 69.2 ±7.6 |
| PSA (ng/ml) | ||
| ≤10 | 11 (16.7%) | 36 (58.1%) |
| >10 | 55 (83.3%) | 26 (41.9%) |
| Tumor | ||
| T1/T2 | 62 (93.9%) | |
| T3/T4 | 4 (6.1%) | |
| Node | ||
| N0 | 63 (95.5%) | |
| N1-3 | 3 (4.5%) | |
| Metastasis | ||
| M0 | 52 (78.8%) | |
| M1 | 14 (21.2%) | |
| Stage | ||
| I/II | 47 (71.2%) | |
| III/IV | 19 (28.8%) | |
| Gleason score | ||
| ≤7 | 43 (65.2%) | |
| >7 | 23 (34.8%) | |
| Bone metastasis | ||
| No | 44 (71.0%) | |
| Yes | 18 (29.0%) |
Plasma miR-103a-3p and let-7f-5p expression from patient with PCa and BPH in our cohort.
The distribution of let-7f-5p expression in PCa patients
| Variables | Cases | let-7f-5p expression | t value | P |
|---|---|---|---|---|
| Age | ||||
| ≤70 | 30 | 3.27±2.33 | 1.89 | 0.064 |
| >70 | 36 | 2.38±1.50 | ||
| Stage | ||||
| I/II | 47 | 2.82±1.95 | 0.22 | 0.828 |
| III/IV | 19 | 2.70±2.02 | ||
| Gleason score | ||||
| ≤7 | 43 | 3.03±2.01 | 1.42 | 0.161 |
| >7 | 23 | 2.32±1.81 | ||
| PSA (ng/ml) | ||||
| ≤10 | 11 | 2.56±1.23 | -0.42 | 0.679 |
| >10 | 55 | 2.83±2.08 | ||
| Bone metastasis | ||||
| No | 44 | 2.97±2.08 | 1.20 | 0.234 |
| Yes | 18 | 2.30±1.77 |
Diagnostic value of let-7f-5p and PSA for PCa
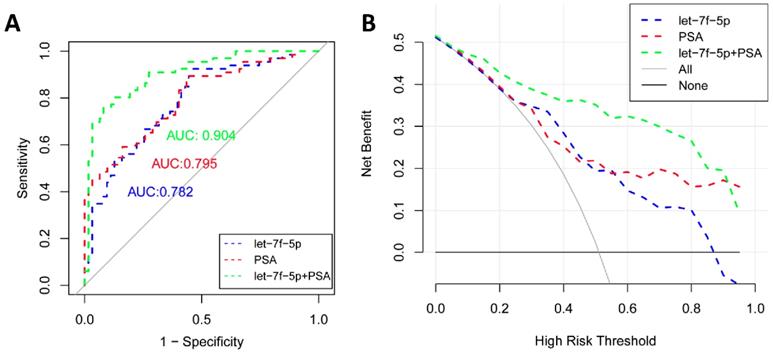
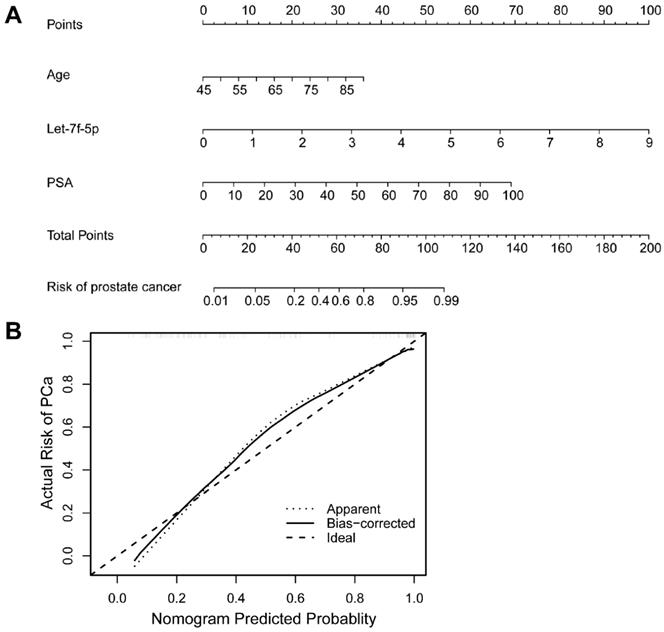
As shown in Figure 4A, the ROC curve analyses were applied to assess the ability of significantly expressed miRNA let-7f-5p and PSA to discriminate the PCa and BPH patients. The AUC and 95%CI for all models are summarized in Table 3. For let-7f-5p alone, the AUC is 0.782 (95%CI: 0.703-0.861). For PSA alone, the AUC is 0.795 (95%CI: 0.720-0.871). Importantly, for the combination of let-7f-5p and PSA, the AUC is 0.904 (95%CI: 0.852-0.957). The DeLong's test was conducted to evaluate whether the AUC were different between two models. The results indicated that the AUC of combination of lef-7f-5p and PSA was significantly higher than that of let-7f-5p or PSA alone (P=7.55E-04 and P=2.09E-03, respectively). The decision curve analysis also showed that combination of let-7f-5p and PSA model had best performance in risk predication and clinical benefit among the three models (Figure 4B). In addition, we applied a nomogram to predict the PCa risk using the variables of age, let-7f-5p and PSA levels and the concordance index reached up to 0.921(Figure 5A). The calibration plot demonstrated the agreements between the predicted probability of PCa using nomogram and observed risk of PCa. Our results indicated good consistency between predictive and actual PCa risk, suggesting the high predictive accuracy of the nomogram for PCa risk (Figure 5B).
The ROC curve and decision curve analysis for prediction models of PCa and BPH patients. (A) ROC curves for let-7f-5p, PSA, and combination of let-7f-5p and PSA expression in plasma samples from PCa and BPH patients. (B) Decision curve analysis was applied to compare the net benefit between different prediction models. The y-axis means the net benefit. The blue dashed line: model including let-7f-5p only; The red dashed line: model including PSA only; The green dashed line: model including let-7f-5p and PSA; The grey solid line means all subjects at risk; The black solid line means none subjects at risk.
ROC analysis of let-7f-5p and PSA from patients with PCa and BPH
| Factors | AUC | 95%CI | P value |
|---|---|---|---|
| let-7f-5p | 0.782 | 0.703-0.861 | |
| PSA | 0.795 | 0.720-0.871 | |
| let-7f-5p+PSA | 0.904 | 0.852-0.957 | |
| let-7f-5p vs. let-7f-5p+PSA | 7.55E-04 | ||
| PSA vs. let-7f-5p+PSA | 2.09E-03 |
A nomogram and calibration curve for predicting PCa risk integrated with age, let-7f-5p and PSA levels. (A) Nomogram of logistic regression model for PCa. The nomogram enabled the user to obtain the probability of PCa risk corresponding to a patient's combination of covariates. The upper-most point scale represents the predicator points of each variable. Then the user can add up the points and read the corresponding predicted values at the bottom of the nomogram. (B) Calibration curve of the nomogram for predicting PCa risk. The calibration curve represents the agreement between the nomogram predicted risk probability (x-axis) and the actual risk probability of PCa (y-axis). The diagonal dotted line is the ideal curve. The other dotted line means the predictive performance of nomogram. The black line represents bias-corrected curve.
Discussion
PSA testing decreased the mortality of PCa but was related to a high risk of overdiagnosis[20]. It is difficult for PSA to distinguish the PCa from BPH patients, which may contribute to a mass of misdiagnose and unnecessary biopsies [21]. Therefore, improved biomarkers for detection of PCa remain necessary [22].
The circulating miRNAs were stable and could be treated as non-invasive biomarkers [23]. Compelling evidence indicates that miRNA can act as potential diagnostic biomarker in cancers, including PCa [24]. Recently, microarray or high-throughput sequencing has been extensively applied to measure the expression of miRNAs and identify the differential expressed miRNAs. In the present study, through integration of multiple miRNA expression profiles from GEO and TCGA databases, we identified two miRNAs, miR-103a-3p and let-7f-5p, consistently upregulated in PCa patients. It is noteworthy that we used both miRNA profiling by microarray or high-throughput sequencing technology, and the datasets include miRNA expression in plasma and tissue of PCa cases and cancer-free controls. Regardless of the sample sizes and the platforms of datasets varied, these two miRNAs (miR-103a-3p and let-7f-5p) were significantly dysregulated in PCa cases from all datasets. Furthermore, a significant higher expression of let-7f-5p was also observed in PCa cases, compared with BPH patients in our cohort. The expression of candidate miRNA miR-103a-3p had no remarkable difference between groups. Another study was in inconsistence with our results. It was reported that miR-103a-3p was upregulated in PCa and had good detectability of overall and clinically significant PCa [16]. This controversial result should be investigated in the further study.
The result of the microarray and qRT-PCR analysis confirmed that expression level of let-7f-5p was upregulated in PCa. To our knowledge, the association between miRNA let-7f-5p and PCa has not been reported. The role of let-7f-5p have investigated in other diseases. The expression level of let-7f-5p was upregulated in colon cancer [25, 26], thyroid cancer cells [27], typical and atypical carcinoid tumors [28]. However, downregulation of let-7f-5p was observed in amyotrophic lateral sclerosis [29]. Besides, a recent study found that let-7f-5p promoted the resistance of colorectal cancer cells and silence of let-7f-5p may provide a novel therapeutic strategy for colorectal cancer [26]. The role of let-7f-5p acted as biomarker was also explored. A previous study revealed that let-7f-5p was a prognostic biomarker for chemoresistance in adenocarcinomas of the esophagogastric junction [30]. In addition, Marcia et al found that let-7f-5p combined with other four miRNAs showed high diagnostic accuracy for Parkinson's disease [31].
The limitations of PSA have promoted investigation of new biomarkers for detection of PCa, which can reduce unnecessary biopsies [32]. Mounting evidence has shown that combination of new biomarker and PSA may improve the predictive accuracy of PSA testing in diagnosis of PCa [33]. In the present study, we determined the effect of let-7f-5p and PSA on diagnose of PCa. The results showed that the AUC of PSA was slightly higher than that of let-7f-5p. Moreover, combined panel of let-7f-5p and PSA could discriminate PCa patients from BPH subjects with higher performance than PSA alone, suggesting this panel can improve the diagnostic route of PSA testing.
The present study has several important strengths. Firstly, we acquired and downloaded multiple large-scale miRNA datasets from a variety of platforms (1,017 cases, 413 controls). Through integrative analysis of database of GEO and TCGA, we systematically screened and identified two candidate miRNAs involved in PCa. Moreover, the results in microarray analysis were validated in an independent PCa cases and BPH subjects, who were confirmed by biopsy. There are some limitations in our study. The sample size in qRT-PCR analysis was relatively small, which may influence the power of detecting differentially expressed miRNAs. Besides, more multi-center case-control studies with large sample may need for further validation of the diagnostic effect of let-7f-5p and PSA.
In summary, we identified and validated that miRNA let-7f-5p was significantly upregulated in PCa. The combination of let-7f-5p and PSA had a better discernibility of PCa and BPH patients. Our study suggests that let-7f-5p and PSA panel may serve as biomarker for PCa detection. Further studies in large-scale independent population are warrant to validate and define the diagnostic effect of this panel.
Supplementary Material
Supplementary tables.
Acknowledgements
This work was supported by the Natural Science Foundation of Jiangsu Province (BK20190600); The 5th Jiangsu Provincial 333 High-level Talents Cultivation Project; The Fundamental Research Funds for the Central Universities (JUSRP11951); Public Health Research Center at Jiangnan University (JUPH201823).
Competing Interests
The authors have declared that no competing interest exists.
References
1. Global Burden of Disease Cancer C, Fitzmaurice C, Abate D, Abbasi N, Abbastabar H, Abd-Allah F. et al. Global, Regional, and National Cancer Incidence, Mortality, Years of Life Lost, Years Lived With Disability, and Disability-Adjusted Life-Years for 29 Cancer Groups, 1990 to 2017: A Systematic Analysis for the Global Burden of Disease Study. JAMA Oncol. 2019
2. Weiner AB, Matulewicz RS, Eggener SE, Schaeffer EM. Increasing incidence of metastatic prostate cancer in the United States (2004-2013). Prostate Cancer Prostatic Dis. 2016;19:395-7
3. Stephan C, Ralla B, Jung K. Prostate-specific antigen and other serum and urine markers in prostate cancer. Biochim Biophys Acta. 2014;1846:99-112
4. Cucchiara V, Cooperberg MR, Dall'Era M, Lin DW, Montorsi F, Schalken JA. et al. Genomic Markers in Prostate Cancer Decision Making. Eur Urol. 2018;73:572-82
5. Bartel DP. MicroRNAs: genomics, biogenesis, mechanism, and function. Cell. 2004;116:281-97
6. Piperigkou Z, Karamanos NK. Dynamic Interplay between miRNAs and the Extracellular Matrix Influences the Tumor Microenvironment. Trends Biochem Sci. 2019;44:1076-88
7. Lai WF, Lin M, Wong WT. Tackling Aging by Using miRNA as a Target and a Tool. Trends Mol Med. 2019;25:673-84
8. Adams BD, Parsons C, Walker L, Zhang WC, Slack FJ. Targeting noncoding RNAs in disease. J Clin Invest. 2017;127:761-71
9. Kalogirou C, Spahn M, Krebs M, Joniau S, Lerut E, Burger M. et al. MiR-205 is progressively down-regulated in lymph node metastasis but fails as a prognostic biomarker in high-risk prostate cancer. Int J Mol Sci. 2013;14:21414-34
10. Peng X, Guo W, Liu T, Wang X, Tu X, Xiong D. et al. Identification of miRs-143 and -145 that is associated with bone metastasis of prostate cancer and involved in the regulation of EMT. PLoS One. 2011;6:e20341
11. Ribas J, Lupold SE. The transcriptional regulation of miR-21, its multiple transcripts, and their implication in prostate cancer. Cell Cycle. 2010;9:923-9
12. Zhang QH, Sun HM, Zheng RZ, Li YC, Zhang Q, Cheng P. et al. Meta-analysis of microRNA-183 family expression in human cancer studies comparing cancer tissues with noncancerous tissues. Gene. 2013;527:26-32
13. Fabris L, Ceder Y, Chinnaiyan AM, Jenster GW, Sorensen KD, Tomlins S. et al. The Potential of MicroRNAs as Prostate Cancer Biomarkers. Eur Urol. 2016;70:312-22
14. Sun T, McKay R, Lee GS, Kantoff P. The role of miRNAs in prostate cancer. Eur Urol. 2015;68:589-90
15. Luo S, Liu Y, Liang G, Zhao M, Wu H, Liang Y. et al. The role of microRNA-1246 in the regulation of B cell activation and the pathogenesis of systemic lupus erythematosus. Clin Epigenetics. 2015;7:24
16. Mello-Grand M, Gregnanin I, Sacchetto L, Ostano P, Zitella A, Bottoni G. et al. Circulating microRNAs combined with PSA for accurate and non-invasive prostate cancer detection. Carcinogenesis. 2019;40:246-53
17. Urabe F, Matsuzaki J, Yamamoto Y, Kimura T, Hara T, Ichikawa M. et al. Large-scale Circulating microRNA Profiling for the Liquid Biopsy of Prostate Cancer. Clin Cancer Res. 2019;25:3016-25
18. Usuba W, Urabe F, Yamamoto Y, Matsuzaki J, Sasaki H, Ichikawa M. et al. Circulating miRNA panels for specific and early detection in bladder cancer. Cancer Sci. 2019;110:408-19
19. Lefort K, Ostano P, Mello-Grand M, Calpini V, Scatolini M, Farsetti A. et al. Dual tumor suppressing and promoting function of Notch1 signaling in human prostate cancer. Oncotarget. 2016;7:48011-26
20. Schroder FH, Hugosson J, Roobol MJ, Tammela TL, Ciatto S, Nelen V. et al. Screening and prostate-cancer mortality in a randomized European study. N Engl J Med. 2009;360:1320-8
21. Logozzi M, Angelini DF, Giuliani A, Mizzoni D, Di Raimo R, Maggi M. et al. Increased Plasmatic Levels of PSA-Expressing Exosomes Distinguish Prostate Cancer Patients from Benign Prostatic Hyperplasia: A Prospective Study. Cancers (Basel). 2019 11
22. Cuzick J, Thorat MA, Andriole G, Brawley OW, Brown PH, Culig Z. et al. Prevention and early detection of prostate cancer. Lancet Oncol. 2014;15:e484-92
23. Hayes J, Peruzzi PP, Lawler S. MicroRNAs in cancer: biomarkers, functions and therapy. Trends Mol Med. 2014;20:460-9
24. Kanwal R, Plaga AR, Liu X, Shukla GC, Gupta S. MicroRNAs in prostate cancer: Functional role as biomarkers. Cancer Lett. 2017;407:9-20
25. Pathak S, Meng WJ, Nandy SK, Ping J, Bisgin A, Helmfors L. et al. Radiation and SN38 treatments modulate the expression of microRNAs, cytokines and chemokines in colon cancer cells in a p53-directed manner. Oncotarget. 2015;6:44758-80
26. Tie Y, Chen C, Yang Y, Qian Z, Yuan H, Wang H. et al. Upregulation of let-7f-5p promotes chemotherapeutic resistance in colorectal cancer by directly repressing several pro-apoptotic proteins. Oncol Lett. 2018;15:8695-702
27. Wachter S, Damanakis AI, Elxnat M, Roth S, Wunderlich A, Verburg FA. et al. Epigenetic Modifications in Thyroid Cancer Cells Restore NIS and Radio-Iodine Uptake and Promote Cell Death. J Clin Med. 2018 7
28. Di Fazio P, Maass M, Roth S, Meyer C, Grups J, Rexin P. et al. Expression of hsa-let-7b-5p, hsa-let-7f-5p, and hsa-miR-222-3p and their putative targets HMGA2 and CDKN1B in typical and atypical carcinoid tumors of the lung. Tumour Biol. 2017;39:1010428317728417
29. Liguori M, Nuzziello N, Introna A, Consiglio A, Licciulli F, D'Errico E. et al. Dysregulation of MicroRNAs and Target Genes Networks in Peripheral Blood of Patients With Sporadic Amyotrophic Lateral Sclerosis. Front Mol Neurosci. 2018;11:288
30. Just C, Knief J, Lazar-Karsten P, Petrova E, Hummel R, Rocken C. et al. MicroRNAs as Potential Biomarkers for Chemoresistance in Adenocarcinomas of the Esophagogastric Junction. J Oncol. 2019;2019:4903152
31. Dos Santos MCT, Barreto-Sanz MA, Correia BRS, Bell R, Widnall C, Perez LT. et al. miRNA-based signatures in cerebrospinal fluid as potential diagnostic tools for early stage Parkinson's disease. Oncotarget. 2018;9:17455-65
32. Sharma S, Zapatero-Rodriguez J, O'Kennedy R. Prostate cancer diagnostics: Clinical challenges and the ongoing need for disruptive and effective diagnostic tools. Biotechnol Adv. 2017;35:135-49
33. Louie KS, Seigneurin A, Cathcart P, Sasieni P. Do prostate cancer risk models improve the predictive accuracy of PSA screening? A meta-analysis. Ann Oncol. 2015;26:848-64
Author contact
![]() Corresponding authors: Li Cui, Department of Urology, The Third Affiliated Hospital of Soochow University, Changzhou, China. E-mail: cuili_changzhoucom; And Qinbo Yuan, Department of Urology, Huaiyin Hospital of Huai'an City, Huai'an, China. Email: qinbo_yuancom. And Yuqiu Ge, Department of Public Health and Preventive Medicine, Wuxi School of Medicine, Jiangnan University, Wuxi, China. Email: yuqiuge0816com.
Corresponding authors: Li Cui, Department of Urology, The Third Affiliated Hospital of Soochow University, Changzhou, China. E-mail: cuili_changzhoucom; And Qinbo Yuan, Department of Urology, Huaiyin Hospital of Huai'an City, Huai'an, China. Email: qinbo_yuancom. And Yuqiu Ge, Department of Public Health and Preventive Medicine, Wuxi School of Medicine, Jiangnan University, Wuxi, China. Email: yuqiuge0816com.