Impact Factor ISSN: 1837-9664

 Global reach, higher impact
J Cancer 2020; 11(15):4581-4588. doi:10.7150/jca.44766 This issue Cite
Research Paper
Prognostic significance of Spinster homolog gene family in acute myeloid leukemia
Wenhui Huang1,2,3#, Tingting Qian1,2,3#, Zhiheng Cheng4, Tiansheng Zeng1,2,3, Chaozeng Si5, Chaojun Liu6, Cong Deng7, Xu Ye1, Yan Liu8 ![]() , Longzhen Cui8,9
, Longzhen Cui8,9 ![]() , Lin Fu1,2,3,8,9
, Lin Fu1,2,3,8,9 ![]()
1. Department of Hematology, The Second Affiliated Hospital of Guangzhou Medical University, Guangzhou, 510260, China
2. Translational Medicine Center, State Key Laboratory of Respiratory Disease, The Second Affiliated Hospital, Guangzhou Medical University, Guangzhou 510260, China
3. Guangdong Provincial Education Department Key Laboratory of Nano-Immunoregulation Tumor Microenvironment, The Second Affiliated Hospital of Guangzhou Medical University, Guangzhou, 510260, China
4. Department of Pathology and Medical Biology, University Medical Center Groningen, University of Groningen, Groningen, Netherlands
5. Information Center, China-Japan Friendship Hospital, Beijing, 100029, China.
6. Yinfeng Gene Technology Co., Ltd.; No.1109, Gangxing 3 Rd,New and High-tech Zone, Jinan City, Shandong Province, 250102, China
7. Department of Clinical laboratory, The Second Affiliated Hospital of Guangzhou Medical University, Guangzhou, 510260, China
8. Translational Medicine Center, Huaihe Hospital of Henan University, Kaifeng, 475000, China.
9. Department of Hematology, Huaihe Hospital of Henan University, Kaifeng, 475000, China
#These authors contributed equally to this work.
Received 2020-2-10; Accepted 2020-5-2; Published 2020-5-18
Abstract
Acute myeloid leukemia (AML) is a clonal and heterogeneous disease characterized by proliferation of immature myeloid cells, with impaired differentiation and maturation. Spinster homolog (SPNS) is a widely distributed transmembrane transporter, which assists sphingolipids in playing their roles through the cell membrane. However, the expression and clinical implication of the SPNS family has not been investigated in AML. From the Cancer Genome Atlas database, a total of 155 AML patients with complete clinical characteristics and SPNS1-3 expression data were contained in our study. In patients who received chemotherapy only, high expressions of SPNS2 and SPNS3 had adverse effects on event-free survival (EFS) and overall survival (OS) (all P<0.05). However, in the allogeneic hematopoietic stem cell transplantation (allo-HSCT) group, we only found a significant difference in OS between the high and low SPNS3 expression groups (P=0.001), while other SPNS members showed no effect on survival. Multivariate analysis indicated that high SPNS2 expression was an independent risk factor for both EFS and OS in chemotherapy patients. The results confirmed that high expression of SPNS2 and SPNS3 were poor prognostic factors, and the effect of SPNS2 can be neutralized by allo-HSCT.
Keywords: Acute myeloid leukemia, Prognosis, SPNS1, SPNS2, SPNS3
Introduction
Acute myeloid leukemia (AML) is a malignancy with malignant breeding of bone marrow precursor cells, and the function and production of the normal cells are restrained [1]. AML always accompanies with specific gene variations, which can be served as the basis of its onset and effective treatment [2, 3]. Some gene abnormalities have been identified as independent prognostic factors. For example, high expressions of FUT3/6/7, PDK2/3, PAK3/7 and NCALD were proved as poor prognosis factors in AML [4-7]. While high FUT4 and PAK2 expressers have longer EFS and OS after chemotherapy [4, 6]. On account of the previous studies, there should be more research to explore the effect of gene expression on prognosis.
Spinster homolog (SPNS) is a protein stretching across cell membrane, with the function of transmembrane transporter. According to amino acid sequence homology analysis, SPNS members belong to major facilitator superfamily (MFS) [8, 9]. Previous study reported that SPNS1 and the vacuolar-type H+-ATPase (v-ATPase) could regulate proper autolysosomal biogenesis with optimal acidification, which is closely associated to developmental senescence and survival [10]. In addition, Yanagisawa et. al identified that SPNS1 was a favorable factor in Niemann-Pick type C disease (NPC) (-/-) cells [11]. SPNS2 is notarized to be the physiologically functional Sphingosine 1-phosphate (S1P) transporters, S1P is an effective and biologically active signaling molecules, which can promote the development of cancer by regulating cell proliferation, survival, migration, vascularization and lymphoangiogenesis [12, 13]. The relation between SPNS2 and S1P were previously found in animals, such as zebrafishand and mouse. Then Hisano et. al demonstrated that human SPNS2 can also transport S1P and its analogue, indicating SPNS2 may participate in the progress of cancer adjustment [14]. There were studies indicated that SPNS3 involved in sphingolipid pathways to mediate airway hyperresponsiveness and mast cell activation in asthma patients [15]. People have probed some fundamental effects of SPNS3, nevertheless still don't understand most of the roles that SPNS3 play in human disorders. But the prognosis of SPNSs in AML has never been investigated.
Here we conducted a prognosis study to investigate the impact of the SPNS genes in AML patients. Our study disclosed the guiding significance of SPNS expression in prognosis of AML, high expression of SPNS2 and SPNS3 were poor prognosis in chemotherapy patients, and SPNS3 was a poor indicator for OS in allo-HSCT patients.
Subjects and Methods
Patients
A total of 155 AML patients with complete clinical data and SPNS expression from The Cancer Genome Atlas (TCGA) database were included in this study (https://cancergenome.nih.gov/). Eighty-four patients underwent chemotherapy only, and 71 also received allogeneic hematopoietic stem cell transplantation (allo-HSCT). Clinical characteristics of AML were expounded, the end points of this study were event-free survival (EFS) and overall survival (OS). OS referred to the time from diagnosis to death for any reason or the last follow-up time. EFS refers to the time from diagnosis to the first event, such as relapse, death, etc. Clinical and molecular characteristics were expounded, including peripheral blood (PB), white blood cell (WBC) counts, PB blasts, bone marrow (BM) blasts, French-American-British (FAB) subtypes, and the frequencies of known recurrent genetic mutations. The informed consent of patients was obtained, and the study protocol was approved by the Washington University Human Studies Committee.
Statistical analysis
The clinical and molecular characteristics of the patients were summarized using descriptive statistical methods. Data sets were described by median and/or range. The Mann-Whitney U-test was used as appropriate to compare numerical comparison and χ2 test for comparison of categorical and numerical data between two groups. Survival rates were estimated using the Kaplan-Meier method and the log-rank test. The univariate and multivariate Cox proportional hazard models of EFS and OS were established using a limited backward elimination process. The statistical significance level was 0.05 for a two tailed test. All statistical analyses were performed using SPSS software 25.0, and GraphPad Prism software 7.0.
Bioinformatic Analysis
The median expression of SPNS2 or SPNS3 was demanded in 84 patients with chemotherapy-only group. The patients were divided into two group according to the median expression of SPNS2 or SPNS3, then take the expression of SPNS2 and SPNS3 minus the median expression of SPNS2 and SPNS3 respectively. Gglot2 was used to map SPNS2 or SPNS3 gene expression profiles in these 84 AML patients. The gene expression above the median level is high expression. The Rice Hmisc package rcorr function was employed to investigate the Pearson correlation coefficient of the gene expression matrix, then genes related to SPNS2 or SPNS3 expression were extracted (p<0.01, absolute correlation coefficient >0.3). And genes associated with SPNS2 or SPNS3 expression were performed by the KEGG (Kyoto Encyclopedia of Genes and Genomes) pathway enrichment analysis. An unsupervised clustering heat map was generated for the first enriched significant pathway gene expression of SPNS2 or SPNS3 using the R-package ComplexHeatmap.
Results
Prognostic significance of SPNS family in AML
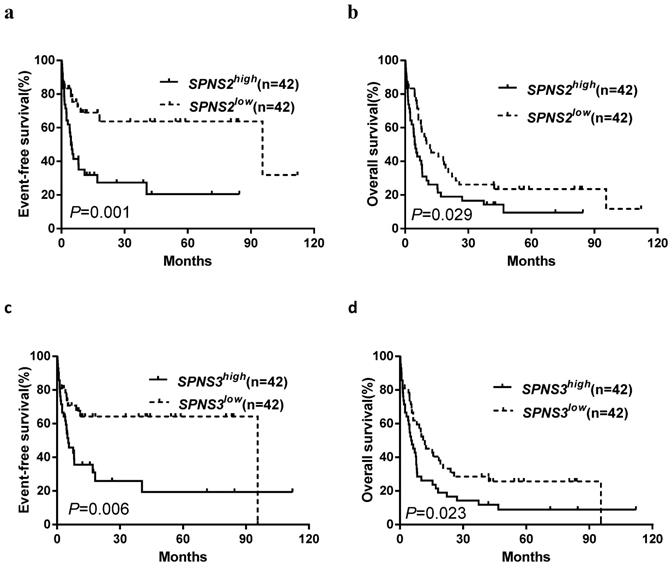
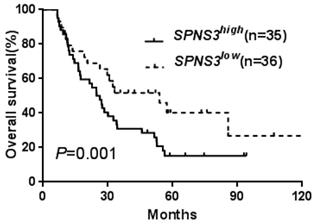
All patients were divided into two groups according to median expression levels of the three SPNS members. The differences of EFS and OS between high and low expression subgroups were presented in Table 1. Kaplan-Meier analysis revealed that the chemotherapy-only patients with high SPNS2 or SPNS3 expression had an adverse effect on EFS and OS (all P < 0.05, Table 1, Fig. 1a-d). In the allo-HSCT group, high SPNS3 expressers had a shorter OS than patients with low SPNS3 expression (Table 1, Fig. 2).
Comparison of EFS and OS between different expression levels of SPNS1-3
| Variables | EFS | OS | |||
|---|---|---|---|---|---|
| χ2 | P-value | χ2 | P-value | ||
| Chemotherapy-only group | |||||
| SPNS1 (high vs. low) | 0.635 | 0.425 | 0.131 | 0.718 | |
| SPNS2 (high vs. low) | 11.465 | 0.001 | 4.784 | 0.029 | |
| SPNS3 (high vs. low) | 7.618 | 0.006 | 4.599 | 0.023 | |
| Allo-HSCT group | |||||
| SPNS1 (high vs. low) | 0.137 | 0.711 | 0.034 | 0.854 | |
| SPNS2 (high vs. low) | 0.033 | 0.856 | 1.760 | O.185 | |
| SPNS3 (high vs. low) | 0.135 | 0.714 | 10.207 | 0.001 | |
Allo-HSCT allogeneic hematopoietic stem cell transplantation, EFS event-free survival, OS overall survival
Kaplan-Meier curves of event-free survival (EFS) and overall survival (OS) in patients who received chemotherapy-only. a, b High SPNS2 expressers had shorter EFS and OS than the low expressers. c, d High SPNS3 expressers had shorter EFS and OS than the low expressers.
Kaplan-Meier curves of overall survival (OS) in patients who received transplantation treatment. High SPNS3 expressers had shorter OS than the low expressers in allo-HSCT group.
Clinical and molecular characteristics of the patients
As shown in Table 2, the clinical and molecular characteristics of high and low SPNS2 and SPNS3 expression subgroups in chemotherapy group were compared. In the SPNS2high group, the group had more FAB-M1 (P < 0.001), fewer FAB-M4 (P = 0.004) and FAB-M5 patients (P = 0.003). No significant differences were observed in age and gender, WBC count, BM blasts, other FAB subtypes, risk stratification, frequencies of other genetic mutations (FLT3-ITD, NPM1, DNMT3A, IDH1/IDH2, RUNX1, NRAS/KRAS, TET2, and TP53) and relapse rates between the SPNS2high and SPNS2low groups. Compared with the SPNS3low subgroup, SPNS3high group had fewer patients with RUNX1-RUNX1T1 karyotype (P = 0.026), and fewer patients with good-risk (P = 0.026). There are no remarkable differences were found in age and gender, WBC count, BM blasts, and PB blasts, FAB subtypes, other risk stratification, frequencies of other genetic mutations (FLT3-ITD, NPM1, DNMT3A, IDH1/IDH2, RUNX1, NRAS/KRAS, TET2, and TP53) and relapse rates between the two subgroups.
Comparison of clinical and molecular characteristics in different SPNS2/3 expression groups among chemotherapy-only group.
| Characteristics | SPNS2 | P | SPNS3 | P | |||
|---|---|---|---|---|---|---|---|
| High (n=42) | Low (n=42) | High (n=42) | Low (n=42) | ||||
| Age (years), median (range) | 67.5 (25-88) | 66 (22-81) | 0.975a | 66 (33-88) | 67 (22-81) | 0.982a | |
| Age group, n (%) | 0.814b | 0.814b | |||||
| <60 years | 12 (28.6) | 14 (33.3) | 14 (33.3) | 12 (28.6) | |||
| ≥60 years | 30 (71.4) | 28 (66.7) | 28 (66.7) | 30 (71.4) | |||
| Gender, n (%) | 0.662b | 0.382b | |||||
| Male | 21 (50.0) | 24 (57.1) | 25 (59.5) | 20 (47.6) | |||
| Female | 21 (50.0) | 18 (42.9) | 17 (40.5) | 22 (52.4) | |||
| WBC (×109/L), median (range) | 14.8 (0.7-297.4) | 14.6 (1.9-131.5) | 0.862a | 16.5 (0.7-134.4) | 13.3 (1.0-297.4) | 0.943a | |
| BM blasts (%), median (range) | 73.5 (32-99) | 69.5 (30-95) | 0.455a | 74 (30-98) | 68 (32-99) | 0.785a | |
| PB blasts (%), median (range) | 49.5 (0-98) | 7.5 (0-90) | 0a | 38 (0-97) | 17.5 (0-98) | 0.149a | |
| FAB subtypes, n (%) | |||||||
| M0 | 6 (14.3) | 1 (2.4) | 0.109b | 3 (7.1) | 4 (9.5) | 1.000b | |
| M1 | 18 (42.9) | 2 (4.8) | 0b | 13 (31.0) | 7 (16.7) | 0.200b | |
| M2 | 13 (31.0) | 8 (19.0) | 0.314b | 9 (21.4) | 12 (28.6) | 0.615b | |
| M4 | 4 (9.5) | 16 (38.1) | 0.004b | 12 (28.6) | 8 (19.0) | 0.443b | |
| M5 | 1 (2.4) | 11 (26.2) | 0.003b | 4 (9.5) | 8 (19.0) | 0.350b | |
| M6 | 0 (0.0) | 1 (2.4) | 1.000b | 1 (2.4) | 0 (0.0) | 1.000b | |
| M7 | 0 (0.0) | 2 (4.8) | 0.494b | 0 (0.0) | 2 (4.8) | 0.494b | |
| Cytogenetics, n (%) | |||||||
| Normal | 19 (45.2) | 21 (50.0) | 0.827b | 22 (52.4) | 18 (42.9) | 0.512b | |
| t(9;22)/BCR-ABL1 | 0 (0.0) | 1 (2.44) | 1.000b | 0 (0.0) | 1 (2.4) | 1.000b | |
| inv(16)/CBFβ-MYH11 | 1 (2.4) | 5 (11.9) | 0.202b | 2 (4.8) | 4 (9.5) | 0.676b | |
| Complex | 7 (16.7) | 5 (11.9) | 0.520b | 7 (16.7) | 4 (9.5) | 0.520b | |
| 11q23/MLL | 1 (2.4) | 2 (4.8) | 1.000b | 2 (4.8) | 1 (2.4) | 1.000b | |
| t(8;12)/RUNX1-RUNX1T1 | 3 (7.1) | 3 (7.1) | 1.000b | 0 (0.0) | 6 (14.3) | 0.026b | |
| Others | 11 (26.2) | 6 (14.3) | 0.277b | 9 (21.4) | 8 (19.0) | 1.000b | |
| Risk, n (%) | |||||||
| Good | 4 (9.5) | 8 (19.0) | 0.350b | 2 (4.8) | 10 (23.8) | 0.026b | |
| Intermediate | 24 (57.1) | 27 (64.3) | 0.655b | 27 (64.3) | 24 (57.1) | 0.655b | |
| Poor | 12 (28.6) | 7 (16.7) | 0.297b | 11 (26.2) | 8 (19.0) | 0.603b | |
| FLT3, n (%) | 0.668b | 0.447b | |||||
| FLT3-ITD | 6 (4.3) | 9 (21.4) | 8 (19.0) | 7 (16.7) | |||
| FLT3-TKD | 9 (9.5) | 3 (7.1) | 5 (11.9) | 2 (4.8) | |||
| Wildtype | 32 (76.2) | 30 (71.4) | 29 (69.0) | 33 (78.6) | |||
| NPM1, n (%) | 0.641b | 0.160b | |||||
| Mutation | 15 (35.7) | 12 (28.6) | 17 (40.5) | 10 (23.8) | |||
| Wildtype | 27 (64.3) | 30 (71.4) | 25 (59.5) | 32 (76.2) | |||
| DNMT3A, n (%) | 0.625b | 0.141b | |||||
| Mutation | 13 (31.0) | 10 (23.8) | 15 (35.7) | 8 (19.0) | |||
| Wildtype | 29 (69.0) | 32 (76.2) | 27 (64.3) | 34 (81.0) | |||
| IDH1/IDH2, n (%) | 0.570b | 1.000b | |||||
| Mutation | 9 (21.4) | 6 (14.3) | 7 (16.7) | 8 (19.0) | |||
| Wildtype | 33 (78.6) | 36 (85.7) | 35 (83.3) | 34 (81.0) | |||
| RUNX1, n (%) | 0.713b | 1.000b | |||||
| Mutation | 5 (11.9) | 3 (7.1) | 4 (9.5) | 4 (9.5) | |||
| Wildtype | 37 (88.1) | 39 (92.9) | 38 (90.5) | 38 (90.5) | |||
| NRAS/KRAS, n (%) | 0.756b | 0.756b | |||||
| Mutation | 5 (11.9) | 7 (16.7) | 5 (11.9) | 7 (16.7) | |||
| Wildtype | 37 (88.1) | 35 (83.3) | 37 (88.1) | 35 (83.3) | |||
| TET2, n (%) | 0.194b | 1.000b | |||||
| Mutation | 8 (19.0) | 3 (7.1) | 5 (11.9) | 6 (14.3) | |||
| Wildtype | 34 (81.0) | 39 (92.9) | 37 (88.1) | 36 (85.7) | |||
| TP53, n (%) | 1.000b | 0.520b | |||||
| Mutation | 5 (11.9) | 6 (14.3) | 7 (16.7) | 4 (9.5) | |||
| Wildtype | 37 (88.1) | 36 (85.7) | 35 (83.3) | 38 (90.5) | |||
| Relapse/n (%) | 0.261b | 0.822b | |||||
| Yes | 13 (31.0) | 19 (45.2) | 15 (37.5) | 17 (40.5) | |||
| No | 29 (69.0) | 23 (54.8) | 27 (64.3) | 25 (59.5) | |||
WBC white blood cell, BM bone marrow, PB peripheral blood, FAB French American British
aMann-Whitney U-test
bChi-square test
The clinical and molecular characteristics of high and low SPNS3 expression in transplanted subgroup were shown in Table 3. Median age was 51 (range 18-72) years, with 19 cases older than 60 years. Thirty cases were man. The median WBC count, BM blasts, and PB blasts at diagnosis were 29.4 × 10⁹/L, 71%, and 48.5%, respectively. The primary FAB subtypes were M1, M2, and M4 (71.6%). Thirty-two patients had abnormal karyotypes. The proportion of good, intermediate, and poor-risk patients were 9.9, 59.2, and 29.6%, respectively. NPM1 had the highest mutation frequency (n = 18, 25.4%), followed by DNMT3A (n = 17, 23.9%), FLT3 (n = 17, 23.9%), IDH1/2 (n = 17, 23.9%), RUNX1 (n = 8, 11.3%), NRAS/KRAS (n =7, 9.9%), TET2 (n = 4, 5.6%), TP53 (n = 4, 5.6%).Forty-eight patients had AML relapse. In regard to SPNS3 expression, SPNS3high group had more patients with normal karyotype (P = 0.017), more intermediate-risk (P = 0.016). No significant differences were observed in age and gender, WBC count, BM blasts and PB blasts, FAB subtypes, risk stratification, frequencies of other genetic mutations (FLT3-ITD, NPM1, DNMT3A, IDH1/IDH2, RUNX1, NRAS/KRAS, TET2, and TP53) and relapse rates between the SPNS3high and SPNS3low groups.
Comparison of clinical and molecular characteristics in different SPNS3 expression groups among allo-HSCT group
| Characteristics | Total | SPNS3 | P | |
|---|---|---|---|---|
| High (n=35) | Low (n=36) | |||
| Age (years), median (range) | 51 (18-72) | 53 (21-65) | 48.5 (18-72) | 0.360a |
| Age group, n (%) | 0.793b | |||
| <60 years | 52 (73.2) | 25 (71.4) | 27 (75.0) | |
| ≥60 years | 19 (26.8) | 10 (28.6) | 9 (25.0) | |
| Gender, n (%) | 0.153b | |||
| Male | 30 (42.3) | 18 (51.4) | 12 (33.3) | |
| Female | 41 (57.7) | 17 (48.6) | 24 (66.7) | |
| WBC (×109/L), median (range) | 29.4 (0.6-223.8) | 19.6 (0.9-202.7) | 30.7 (0.6-223.8) | 0.441a |
| BM blasts (%), median (range) | 71 (30-100) | 69 (34-100) | 75 (30-99) | 0.982a |
| PB blasts (%), median (range) | 48.5 (0-96) | 57 (0-96) | 43 (0-94) | 0.118a |
| FAB subtypes, n (%) | ||||
| M0 | 9 (12.7) | 5 (14.3) | 4 (11.1) | 0.735b |
| M1 | 23 (32.4) | 14 (40.0) | 9 (25.0) | 0.211b |
| M2 | 18 (25.4) | 11 (31.4) | 7 (19.4) | 0.285b |
| M3 | 1 (1.4) | 0 (0.0) | 1 (2.8) | 1.000b |
| M4 | 13 (13.8) | 4 (11.4) | 9 (25.0) | 0.220b |
| M5 | 4 (5.6) | 1 (2.9) | 3 (8.3) | 0.614b |
| M6 | 1 (1.4) | 0 (0.0) | 1 (2.8) | 1.000b |
| M7 | 1 (1.4) | 0 (0.0) | 1 (2.8) | 1.000b |
| Cytogenetics, n (%) | ||||
| Normal | 32 (45.1) | 21 (60.0) | 11 (30.6) | 0.017b |
| t(9;22)/BCR-ABL1 | 2 (2.8) | 0 (0.0) | 2 (5.6) | 0.493b |
| inv(16)/CBFβ-MYH11 | 5 (7.0) | 1 (2.9) | 4 (11.1) | 0.357b |
| Complex | 11 (15.5) | 5 (14.3) | 6 (16.7) | 1.000b |
| 11q23/MLL | 3 (4.2) | 1 (2.9) | 2 (5.6) | 1.000b |
| t(8;12)/RUNX1-RUNX1T1 | 1 (1.4) | 0 (0.0) | 1 (2.8) | 1.000b |
| Others | 16 (22.5) | 6 (17.1) | 10 (27.8) | 0.396b |
| Risk, n (%) | ||||
| Good | 7 (9.9) | 1 (2.9) | 6 (16.7) | 0.107b |
| Intermediate | 42 (59.2) | 26 (74.3) | 16 (44.4) | 0.016b |
| Poor | 21 (29.6) | 8 (22.9) | 13 (36.1) | 0.300b |
| FLT3, n (%) | 0.099b | |||
| FLT3-ITD | 17 (23.9) | 11 (31.4) | 6 (16.7) | |
| FLT3-TKD | 3 (4.2) | 0 (0.0) | 3 (8.3) | |
| Wildtype | 51 (71.8) | 24 (68.6) | 27 (75.0) | |
| NPM1, n (%) | 0.107b | |||
| Mutation | 18 (25.4) | 12 (34.3) | 6 (16.7) | |
| Wildtype | 53 (74.6) | 13 (65.7) | 30 (83.3) | |
| DNMT3A, n (%) | 0.415b | |||
| Mutation | 17 (23.9) | 10 (28.6) | 7 (19.4) | |
| Wildtype | 54 (76.1) | 25 (71.4) | 29 (80.6) | |
| IDH1/IDH2, n (%) | 0.173b | |||
| Mutation | 17 (23.9) | 11 (31.4) | 6 (16.7) | |
| Wildtype | 54 (76.1) | 24 (68.6) | 30 (83.3) | |
| RUNX1, n (%) | 0.151b | |||
| Mutation | 8 (11.3) | 6 (17.1) | 2 (5.6) | |
| Wildtype | 63 (88.7) | 29 (82.9) | 34 (94.4) | |
| NRAS/KRAS, n (%) | 0.484b | |||
| Mutation | 7 (9.9) | 4 (11.4) | 3 (8.3) | |
| Wildtype | 64 (90.1) | 31 (88.6) | 33 (91.7) | |
| TET2, n (%) | 0.614b | |||
| Mutation | 4 (5.6) | 1 (2.9) | 3 (8.3) | |
| Wildtype | 67 (94.4) | 34 (97.1) | 33 (91.7) | |
| TP53, n (%) | 1.000b | |||
| Mutation | 4 (5.6) | 2 (5.7) | 2 (5.6) | |
| Wildtype | 67 (94.4) | 33 (94.3) | 34 (94.4) | |
| Relapse/n (%) | 0.614b | |||
| Yes | 48 (67.6) | 25 (71.4) | 23 (63.9) | |
| No | 23 (32.4) | 10 (28.6) | 13 (36.1) |
Multivariate analysis of possible prognostic factors in the chemotherapy-only group and allo-HSCT group
In order to evaluating the prognostic effects of SPNS2 and SPNS3, expression levels of SPNS2/3 (high vs. low), age (≥60 vs. <60 years), PB blast count (≥20% vs. <20%), FLT3-ITD (positive vs. negative), and other common genetic mutations (NPM1, DNMT3A, IDH1/IDH2, RUNX1 and TET2; mutated vs. wild) were selected for multivariate analysis (Table 4). In the chemotherapy-only group, we can conclude that high SPNS2 expression was an independent poor factor for EFS and OS (P = 0.006, P = 0.048, respectively). And in the allo-HSCT group, high SPNS3 expression (P = 0.002) and FLT3-ITD mutation (P = 0.035) were independent risk factors for OS.
Multivariate analysis of EFS and OS in chemotherapy-only group and allo-HSCT group.
| Variables | EFS | OS | |||
|---|---|---|---|---|---|
| HR(95%CI) | P-value | HR(95%CI) | P-value | ||
| Chemotherapy-only group | |||||
| SPNS2 | 3.072 (1.378-6.851) | 0.006 | 1.884 (1.006-3.526) | 0.048 | |
| SPNS3 | 1.525 (0.737-3.156) | 0.225 | 1.287 (0.728-2.276) | 0.386 | |
| PB (≥20 vs. <20 × 10%) | 0.680 (0.341-1.359) | 0.275 | 0.653 (0.374-1.140) | 0.134 | |
| FLT3-ITD (positive vs. negative) | 0.889 (0.398-1.988) | 0.775 | 0.863 (0.443-1.681) | 0.666 | |
| NPM1 (mutated vs. wild) | 0.870 (0.398-1.948) | 0.736 | 0.875 (0.473-1.617) | 0.670 | |
| DNMT3A (mutated vs. wild) | 1.265 (0.595-2.687) | 0.541 | 1.626 (0.920-2.871) | 0.094 | |
| TET2 (mutated vs. wild) | 0.476 (0.161-1.410) | 0.180 | 0.619 (0.296-1.294) | 0.202 | |
| Allo-HSCT | |||||
| SPNS3 | 1.092 (0.289-4.126) | 0.897 | 2.789 (1.257-5.339) | 0.002 | |
| Age (≥60 vs. <60 years) | 0.740 (0.235-2.331) | 0.607 | 1.061 (0.560-2.010) | 0.856 | |
| PB (≥20 vs. <20 × 10%) | 0.428 (0.149-1.227) | 0.114 | 0.774 (0.404-1.481) | 0.439 | |
| FLT3-ITD (positive vs. negative) | 2.068 (0.450-9.508) | 0.351 | 2.359 (1.062-5.240) | 0.035 | |
| NPM1 (mutated vs. wild) | 0.597 (0.132-2.697) | 0.502 | 0.502 (0.214-1.174) | 0.112 | |
| IDH1/IDH2 (mutated vs. wild) | 1.456 (0.407-5.204) | 0.563 | 0.789 (0.364-1.707) | 0.547 | |
| RUNX1(mutated vs. wild) | 2.275 (0.415-12.468) | 0.344 | 1.529 (0.614-3.807) | 0.361 |
EFS event-free survival, OS overall survival, HR hazard ratio, CI confidential interval, PB peripheral blood
Bioinformatic analysis of SPNS2 and SPNS3 in chemotherapy-only group
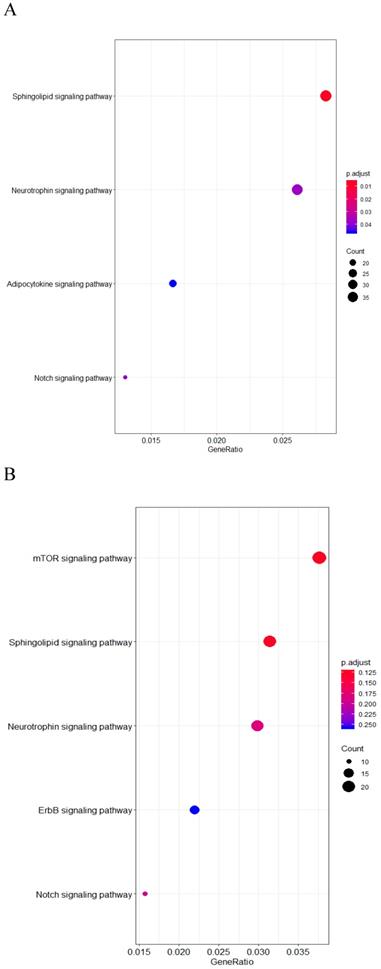
In order to explore the role of SPNS2 and SPNS3 in AML patients, we performed KEGG pathway enrichment analysis and mapped unsupervised clustering heat maps. The expressions of SPNS2 and SPNS3 were shown in Figure S1 and S2. There are 3100 positive and 1158 negative co-expression genes with SPNS2 (Table S1). The results of the KEGG pathway enrichment analysis revealed that Neurotrophin, North, Adipocytokine and Sphingolipid signaling pathway were enriched in high SPNS2 expressers (Fig 3A). And SPNS2 was positive correlated with AKT and TP53, and negative associated with PIK3R2, all these genes belong to Sphingolipid signaling pathway (Fig S2, Table S2). According to the Table S3, 1941 positive and 440 negative co-expression genes with SPNS3. Different from SPNS2, patients who have high expression of SPNS3 co-express with Sphingolipid, North, Neurotrophin, mTOR and ErbB signaling pathway (Fig 3B). Otherwise, the unsupervised clustering heat maps found that SPNS3 was associated with RPL and RPS family, which expressed in Sphingolipid signaling pathway (Fig S4, Table S4).
KEGG enrichment of Co-expression genes of SPNS2 and SPNS3. A. Results of the KEGG pathway enrichment analysis associated with SPNS2 expression. B. Results of the KEGG pathway enrichment analysis associated with SPNS3 expression.
Discussion
In this study, we found high expression of SPNS2 and SPNS3 were poor prognostic factors in the patients who underwent chemotherapy only. Moreover, high expression of SPNS3 was a negative prognosis factor for OS in allo-HSCT patients. SPNS2 and SPNS3 were independent dismal prognosis factors in chemotherapy and all-HSCT group respectively.
SPNS2, as a functional transporter of S1P, has been identified to be associated with many cancers. For example, previous study found that knockout SPNS2 gene can worsen non-small cell lung cancer [16], another research illustrated SPNS2 may play a role in inhibiting the development and progression of gastric cancer [17]. However, another previous paper revealed that lacking of SPNS2 can reduce the regulation ability of S1P on lymphocyte transport, leading to the reduced lymphocyte circulation in tissues, the proportion of T cells and NK cells then increased to kill the tumor cells more effectively [18]. And SPNS2 can also promote the tumor growth via transporting S1P to extracellular environment [19].
In addition, the KEGG pathway enrichment manifested that SPNS2 was closely related to the Sphingolipid signaling pathway, and a study revealed that Sphingomyelin pathway is a kind of Sphingolipid signaling pathway, which can lead to either cell proliferation and differentiation or to apoptosis. [20]. The unsupervised clustering heat maps showed SPNS2 can co-express with AKT in Sphingolipid signaling pathway. Previous passage talked a function material acid ceramide which participated in the Sphingolipid signaling pathway, can regulate cell apoptosis via AKT pathway. This suggested that there were some association between the AKT pathway and the Sphingolipid signaling pathway [21]. However, the mechanism is unclear. In multiple analysis, SPNS2 was proved to be an independent poor factor for the survival, indicating that SPNS2 may related to carcinogenic function in AML, but the mechanism still needs to be further investigated.
SPNS3 is an atypical Solute carriers (SLCs) of major facilitator superfamily (MFS) type [22], and it can mediate the progress of the apoptosis and autophagy in mammal [23-25]. Autophagy-lysosome pathway (ALP) is one of the most important approach to eliminate abnormal proteins in human cells and there were some studies indicated that some genetic variation in autophagy-lysosome pathway plays a vital role in cancer development, such as lung cancer, gastric cancer, breast cancer, and renal cell carcinoma [26]. From the KEGG genes enrichment we can see SPNS3 mainly takes part in the Sphingolipid signaling pathway, and SPNS3 may also develop its function via similar mechanism as SPNS2 in AML [20]. In our study, overexpressed SPNS3 had a bad significance in both the chemotherapy group and the all-HSCT group. According to the above information, overexpression of SPNS3 may regulate and control the progression, proliferation and differentiation of AML by autophagy. As patients with high SPNS3 expression had bad survivals, SPNS3 may can be used as predictor for AML patients in the future.
In multivariate analysis, SPNS2 was proved to be an independent unfavorable prognosis factor for both EFS and OS in chemotherapy group, and SPNS3 and FLT3-ITD were independent unfavorable prognosis factors for OS in the allo-HSCT group. Our result was along with the previous studies that FLT3-ITD was an adverse prognostic factor in AML [27, 28]. And in our study, SPNS2 and SPNS3 were proved to be independent negative prognosis factors in chemotherapy and allo-HSCT respectively.
In summary, high expressions of SPNS2 and SPNS3 can indicate adverse prognosis in chemotherapy AML patients, and the prognosis effect of SPNS2 can be overcome by allo-HSCT, and they might be used as predictors for AML patients in the future. Nevertheless, a larger sample size was needed to further validate our result and pathogenesis in AML still need further investigation.
Abbreviations
AML: Acute myeloid leukemia; SPNS: Spinster homolog; EFS: Event-free survival; OS: Overall survival; MFS: Major facilitator superfamily; NPC: Niemann-Pick type C disease; S1P: Sphingosine 1-phosphate; TCGA: The Cancer Genome Atlas; allo-HSCT: Allogeneic hematopoietic stem cell transplantation; PB: Peripheral blood; WBC: White blood cell; BM: Bone marrow; FAB: French-American-British; KEGG: Kyoto Encyclopedia of Genes and Genomes; SLCs: Solute carriers; ALP: Autophagy-lysosome pathway.
Supplementary Material
Supplementary figures and tables.
Acknowledgements
We thank the TCGA database for providing data for us in this report.
Funding
This work was supported by grants from the National Natural Science Foundation of China (81600089).
Author Contributions
LF designed the outline. WHH and TTQ, drafted the manuscript. WHH, TTQ and TSZ designed the figures and tables. ZHC, CZS, CJL and CD offered professional suggestions to the manuscript. All authors read and approved the final manuscript.
Availability of data and materials
The datasets of this report were generated by TCGA.
Ethical approval and consent to participate
This study was approved by the Helsinki declaration and its subsequent amendments.
Competing Interests
The authors have declared that no competing interest exists.
References
1. Goardon N, Marchi E, Atzberger A. et al. Coexistence of LMPP-like and GMP-like leukemia stem cells in acute myeloid leukemia. Cancer Cell. 2011;19:138-152
2. Oliansky DM, Appelbaum F, Cassileth PA. et al. The role of cytotoxic therapy with hematopoietic stem cell transplantation in the therapy of acute myelogenous leukemia in adults: an evidence-based review. Biol Blood Marrow Transplant. 2008;14(2):137-180
3. Lazarus HM, Perez WS, Klein JP. et al. Autotransplantation versus HLA-matched unrelated donor transplantation or acute myeloid leukaemia: a retrospective analysis from the Center for International Blood and Marrow Transplant Research. Br J Haematol. 2006;132(6):755-769
4. Dai YF, Cheng ZH, Pang YF. et al. Prognostic value of the FUT family in acute myeloid leukemia. Cancer Gene Ther. 2020;27(1-2):70-80
5. Cui LZ, Cheng ZH, Liu Y. et al. Overexpression of PDK2 and PDK3 reflects poor prognosis in acute myeloid leukemia. Cancer Gene Ther. 2020;27(1-2):15-21
6. Quan L, Cheng ZH, Dai YF. et al. Prognostic significance of PAK family kinases in acute myeloid leukemia. Cancer Gene Ther. 2020;27(1-2):30-37
7. Song Y, Zhang WL, He X. et al. High NCALD expression predicts poor prognosis of cytogenetic normal acute myeloid leukemia. J Transl Med. 2019;17:166
8. Deng D, Yan N. Structural basis and transport mechanism of the major facility superfamily (MFS) transporter. Chin Sci Bull. 2015;8(8):720-728
9. Wang Y, Hu JP. SPNS 2, a transporter of sphingosine-1-phosphate: research advances. J Int Pharm Res. 2016;43(6):1043-1047
10. Sasaki T, Lian SS, Khan A. et al. Autolysosome biogenesis and developmental senescence are regulated by both SPNS1 and v-ATPase. Autophagy. 2017;13(2):386-403
11. Yanagisawa H, Ishii T, Endo K. et al. L-leucine and SPNS1 coordinately ameliorate dysfunction of autophagy in mouse and human Niemann-Pick type C disease. Sci Rep. 2017;7(1):15944
12. Fukuhara S, Simmons S, Kawamura S. et al. The sphingosine-1-phosphate transporter SPNS2 expressed on endothelial cells regulates lymphocyte trafficking in mice. J Clin Invest. 2012;122(4):1416-1426
13. Nijnik A, Clare S, Hale C. et al. The role of sphingosine-1-phosphate transporter SPNS2 in immune system function. J Immunol. 2012;189(1):102-111
14. Hisano Y, Kobayashi N, Kawahara A. et al. The sphingosine 1-phosphate transporter, SPNS2, functions as a transporter of the phosphorylated form of the immunomodulating agent FTY720. J Biol Chem. 2011;286(3):1758-1766
15. Virkud YV, Kelly RS, Croteau-Chonka DC. et al. Novel eosinophilic gene expression networks associated with IgE in two distinct asthma populations. Clin Exp Allergy. 2018;48(12):1654-1664
16. Bradley E, Dasgupta S, Jiang X. et al. Critical role of SPNS2, a sphingosine-1-phosphate transporter, in lung cancer cell survival and migration. PLoS One. 2014;9(10):e110119
17. Yu LL, Bao J, Jiang P. et al. Expression of SPNS2 in gastric cancer tissue and its effect on the proliferation and migration of gastric cancer cells. J Med Postgra. 2018;31(10):1020-1025
18. van der Weyden L, Arends MJ, Campbell AD. et al. Genome-wide in vivo screen identifies novel host regulators of metastatic colonization. Nature. 2017;541(7636):233-236
19. Newton J, Lima S, Maceyka M. et al. Revisiting the sphingolipid rheostat: Evolving concepts in cancer therapy. Exp Cell Res. 2015;333(2):195-200
20. Tomiuk S, Hofmann K, Nix M. et al. Cloned mammalian neutral sphingomyelinase: Functions in sphingolipid signaling? PNAS. 1998;95(7):3638-3643
21. Cho SM, Kwon HJ. Acid ceramidase, an emerging target for anti-cancer and anti-angiogenesis. Arch Pharm Res. 2019;42(3):232-243
22. Perland E, Bagchi S, Klaesson A. et al. Characteristics of 29 novel atypical solute carriers of major facilitator superfamily type: evolutionary conservation, predicted structure and neuronal co-expression. Open Biol. 2017;7(9):170142
23. Nakano Y. Stories of spinster with various faces: from courtship rejection to tumor metastasis rejection. J Neurogenet. 2019;33(2):90-95
24. Han M, Chang H, Zhang P. et al. C13C4.5/Spinster, an evolutionarily conserved protein that regulates fertility in C. elegans through a lysosome-mediated lipid metabolism process. Protein Cell. 2013;4(5):364-372
25. Sakurai A, Nakano Y, Koganezawa M. et al. Phenotypic interactions of spinster with the genes encoding proteins for cell death control in Drosophila melanogaster. Ach Insect Biochem Physiol. 2010;73(3):119-127
26. Tan J, Fu L, Chen H. et al. Association study of genetic variation in the autophagy lysosome pathway genes and risk of eight kinds of cancers. Int J Cancer. 2018;143(1):80-87
27. Metzelder SK, Schroeder T, Lübbert M. et al. Long-term survival of sorafenib-treated FLT3-ITD-positive acute myeloid leukaemia patients relapsing after allogeneic stem cell transplantation. Eur J Cancer. 2017;86:233-239
28. Tang S, Shen H, Mao X. et al. FLT3-ITD with DNMT3A R882 double mutation is a poor prognostic factor in Chinese patients with acute myeloid leukemia after chemotherapy or allogeneic hematopoietic stem cell transplantation. Int J Hematol. 2017;106(4):552-561
Author contact
![]() Corresponding authors: Lin Fu, E-mail: fulin022com; Yan Liu, E-mail: liuyan5515com; Longzhen Cui, E-mail: clzhgxtcom
Corresponding authors: Lin Fu, E-mail: fulin022com; Yan Liu, E-mail: liuyan5515com; Longzhen Cui, E-mail: clzhgxtcom