Impact Factor ISSN: 1837-9664

 Global reach, higher impact
J Cancer 2020; 11(19):5768-5781. doi:10.7150/jca.44573 This issue Cite
Research Paper
A novel seven-gene signature as Prognostic Biomarker in Hepatocellular Carcinoma
Hui Xie1,2,3,4*, Shouping Liu1,2,3*, Ziying Zhang5, Peng Chen6, Yongguang Tao1,2,3,4,6 ![]()
1. Hunan Cancer Hospital and The Affiliated Cancer Hospital of Xiangya School of Medicine, Central South University.
2. Key Laboratory of Carcinogenesis and Cancer Invasion, Ministry of Education, Department of Pathology, Xiangya Hospital, Central South University, Hunan, 410078 China.
3. NHC Key Laboratory of Carcinogenesis (Central South University), Cancer Research Institute and School of Basic Medicine, Central South University, Changsha, Hunan, 410078 China.
4. Department of Thoracic Surgery, Hunan Key Laboratory of Early Diagnosis and Precision Therapy in Lung Cancer, Second Xiangya Hospital, Central South University, Changsha, 410011 China.
5. Department of Oncology, Third Xiangya Hospital, Central South University, Changsha, Hunan, 410013, China.
6. Department of Urology, Xiangya Hospital, Central South University, Changsha, Hunan, 410008, China.
*These authors contributed equally to this work.
Received 2020-2-4; Accepted 2020-3-29; Published 2020-7-31
Abstract
Purpose: Our study is designed to develop and certify a promising prognostic signature for hepatocellular carcinoma (HCC).
Materials and methods: We retrospectively analyzed mRNA expression profiles and clinicopathological data fetched from The Cancer Genome Atlas (TCGA) and Gene Expression Omnibus (GEO) datasets. We formulated a prognostic seven-gene signature composed of differentially expressed mRNAs (DEmRNAs) between HCC and nonneoplastic tissues through univariate Cox regression analysis. The receiver operating characteristic (ROC) curve, survival analysis and multivariate Cox regression analysis as well as nomograms were utilized to assess the prognostic performance of the seven-gene signature.
Results: The risk score based on a seven-gene signature categorized HCC subjects into a high- and low-risk group. There was significantly discrepant overall survival (OS) between patients in both groups and the corresponding ROC curve revealed a satisfactory predictive performance in HCC survival in both TCGA and GSE76427 cohort. Multivariate Cox regression analysis demonstrated that a seven-gene signature was an independently prognostic factor for HCC. Nomograms combining this prognostic signature with significant clinical characteristics conferred a crucial reference to predict the 1-,3- and 5 years OS.
Conclusions: Our study defined a promising seven-gene signature and nomogram model to forecast the OS of HCC patients, which is instrumental in clinical decision and personalized therapy.
Keywords: hepatocellular carcinoma, prognosis, risk score, prognostic signature
Introduction
Liver cancer is the second most frequent reason for tumor-associated deaths, with an approximated 841, 080 new cases and 780 thousand deaths occurring globally in 2018. In particular, almost one-half of new diagnoses and deaths are Chinese [1-3]. HCC, accounting for almost 90% of all primary liver cancers, can be induced by multifarious risk factors, including hepatitis virus infection, metabolic disorders, aflatoxin and autoimmune hepatitis [1, 4]. Despite recent encouraging progress in therapeutic interventions (such as surgery, radiofrequency ablation, targeted therapy, and radiotherapy), HCC patients display an unsatisfactory prognosis with a lower than 40% 5-year survival rate because of frequent recurrence or distant metastasis [5-7]. Several clinicopathological parameters, including pathologic differentiation, tumor-node-metastasis (TNM) staging and vascular invasion, constitute conventional prognostic models to predict the OS of HCC patients [8]. Nevertheless, their predictive performance is not very encouraging owing to the great heterogeneity of HCC. Additionally, regarding several valuable biomarkers, such as des-γ-carboxyprothrombin [9] and alpha-fetoprotein (AFP) [10], their prognostic efficiency is variable among studies, which is partly ascribed to difference in sample size, assay methods or statistical methods [6].
Recent advance in genome-sequencing technologies has investigated the prognostic prediction of gene signatures in HCC. A majority of studies have concentrated on single gene molecule at mRNA level [11-17]. However, multiple-gene-based signatures are more robust to evaluate HCC prognosis compared with the predictive power of single-biomarker. For example, the prognostic predictive value of apolipoprotein A1 (APOA1) combined with C-reactive protein (CRP) is more favorable than that of serum AFP alone [12]. Sulfite oxidase (SUOX) integrated with AFP are sufficient to predict the performance and recurrence risk of HCC [18]. Similarly, Dong et al demonstrated that synergic analysis of STAT genes (STAT5A, STAT5B and STAT6) exhibited a more desirable predictive efficiency for HCC prognosis than did single gene [19]. The accumulating accessibility of genome-wide gene expression information in HCC potentially permits the development of a credible gene signature [20, 21]. Thus, deep excavation of publicly accessible genomic data is a considerable strategy to appraise novel multi-gene signatures with reliable predictive power in the OS of HCC patients, thus conferring promise to improve patients' risk stratification and individual therapeutic interventions. In our study, we acquired the HCC mRNA expression profile from the TCGA and GEO to formulate a prognostic seven-gene signature and a nomogram with satisfactory credibility for HCC patients, which is conducive to covering the imperfection of the current staging system.
Materials and Methods
Data extraction and manipulation
The original mRNA expression information was acquired from TCGA and GEO database, respectively. HCC patients without crucial clinical information (including follow-up or survival status) or mRNA expression data were excluded. The DEmRNAs were identified between tumor tissues and normal samples. We normalized the RNA expression data through multi-array average (RMA) expression measure method. We further investigated DEmRNAs through DESeq vesion 1.38.0 R package in TCGA dataset and by the Limma version 3.36.2 R package in GEO dataset [22]. We further utilized univariate Cox regression analysis to extract DEmRNAs that were significantly related to the prognosis of HCC patients. The hazard ratio (HR)-cutoff value is conventionally set at 1 to define protective genes (HR < 1) and risky genes (HR > 1). We conducted a crosstalk between above two datasets and eventually selected seven reliable DEmRNAs associated with the OS of HCC.
Construction of prognostic signature
A prognostic risk score model was further formulated in accordance with the mRNA expression levels and its corresponding regression coefficient (β). The calculative method was as follows: risk score = the expression level of transketolase (TKT) * βTKT + the expression of TTC39B * βTTC39B + the expression level of poly-N-acetyllactosamine (PLN) * βPLN + the expression level of CBFA2T2 * βCBFA2T2 + the expression level of heat shock protein beta 3 (HSPB3) * βHSPB3 + the expression level of Progestin and adipoQ receptor 4 (PAQR4) * βPAQR4 + the expression level of C21orf58 * βC21orf58. All incorporated HCC patients were categorized as high- and low-risk groups on the basis of a median risk score.
Establishment of nomogram
Nomogram has a robust capacity to predict tumor prognosis [23, 24]. A nomogram was established through incorporating all significant prognostic clinicopathological parameters determined through multivariate Cox regression analysis, thus estimating the probability of 1 -, 3-, and 5 years-OS of HCC. We calculated the concordance index (C-index) to identify the discrimination of a nomogram. The calibration curve of a nomogram was utilized to vividly assess the consistency between its prediction probabilities and the actual observation.
Statistical analysis
To evaluate the survival differences between low- and high-risk HCC patients, we performed survival analysis through Kaplan-Meier curve combined with the log-rank test. We also conducted univariate and multivariate Cox regression analyses to identify the association between OS and risk score as well as clinicopathological features. The ROC curve with the corresponding area under the curve (AUC) was rendered to estimate the predictive performance of the prognostic gene signature for HCC survival by the R package “survival ROC” [25]. P < 0.05 was defined as statistically significant.
Results
Recognition of differentially expressed genes associated with prognosis
Based on TCGA dataset, 3256 DEmRNAs were identified in HCC samples (n = 374) when compared with noncancerous samples (n = 50). Similarly, a total of 12674 DEmRNAs were extracted from GSE47595 (both P < 0.05). The heatmap of the DEmRNAs was revealed in Supplementary Figure 1A and 1B. We further utilized univariate Cox regression model to identify 1569 DEmRNAs from TCGA and 174 DEmRNAs from GSE47595, which were all significantly related to OS of HCC patients (P < 0.05). To narrow down the range of genes, seven differentially expressed genes associated with HCC prognosis were confirmed by overlapping the above two datasets (Supplementary Figure 1C) and were further incorporated into a prognostic gene-signature. Collectively, the seven genes were as follows: TKT, TTC39B, PLN, CBFA2T2, HSPB3, PAQR4, C21 or f58. The general characteristics of the seven genes were summarized in Table 1. Under the condition of the cutoff value of HR = 1, there were four common candidate risky genes (TKT, CBFA2T2, PAQR4, C21orf58) and three candidate protective genes (TTC39B, PLN, HSPB3) (Table 2).
Basic characteristics of the seven genes in the prognostic signature
| Gene stable ID | Gene name | Gene type | Chromosome | Gene Start (bp) | Gene end (bp) |
|---|---|---|---|---|---|
| ENSG00000163931 | TKT | protein coding | 3 | 53224707 | 53256114 |
| ENSG00000155158 | TTC39B | protein coding | 9 | 15163622 | 15307360 |
| ENSG00000198523 | PLN | protein coding | 6 | 118548296 | 118561716 |
| ENSG00000078699 | CBFA2T2 | protein coding | 20 | 33490070 | 33650031 |
| ENSG00000169271 | HSPB3 | protein coding | 5 | 54455699 | 54456377 |
| ENSG00000162073 | PAQR4 | protein coding | 16 | 2969348 | 2973484 |
| ENSG00000160298 | C21orf58 | protein coding | 21 | 46300426 | 46324046 |
Univariate regression analysis of the seven genes significantly related to HCC OS
| Genes | TCGA | GSE76427 | ||
|---|---|---|---|---|
| HR (95% CI) | p | HR (95% CI) | p | |
| TKT | 1.2 (1.1-1.4) | 0.0013 | 1.2 (1.1-1.4) | 0.002 |
| TTC39B | 0.82 (0.72-0.94) | 0.0039 | 0.76 (0.59-0.98) | 0.032 |
| PLN | 0.94 (0.89-0.98) | 0.0097 | 0.47 (0.27-0.84) | 0.01 |
| CBFA2T2 | 1.3 (1.1-1.7) | 0.018 | 1.6 (1.1-2.4) | 0.0074 |
| HSPB3 | 0.96 (0.92-0.99) | 0.025 | 0.65 (0.45-0.95) | 0.026 |
| PAQR4 | 1.2 (1-1.3) | 0.026 | 1.3 (1-1.6) | 0.027 |
| C21orf58 | 1.2 (1-1.4) | 0.037 | 1.3 (1.1-1.7) | 0.018 |
Constitution and validation of a seven-gene prognostic signature
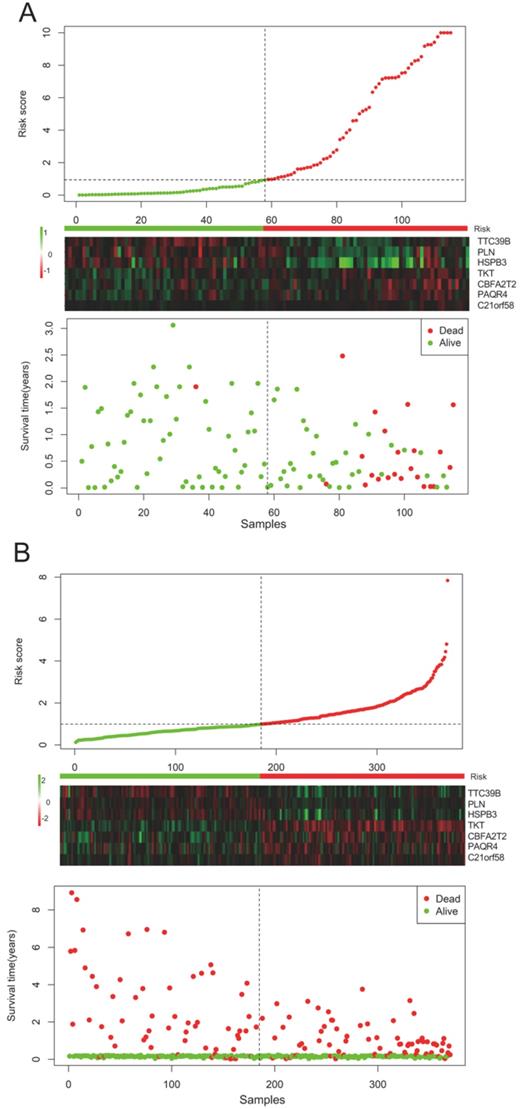
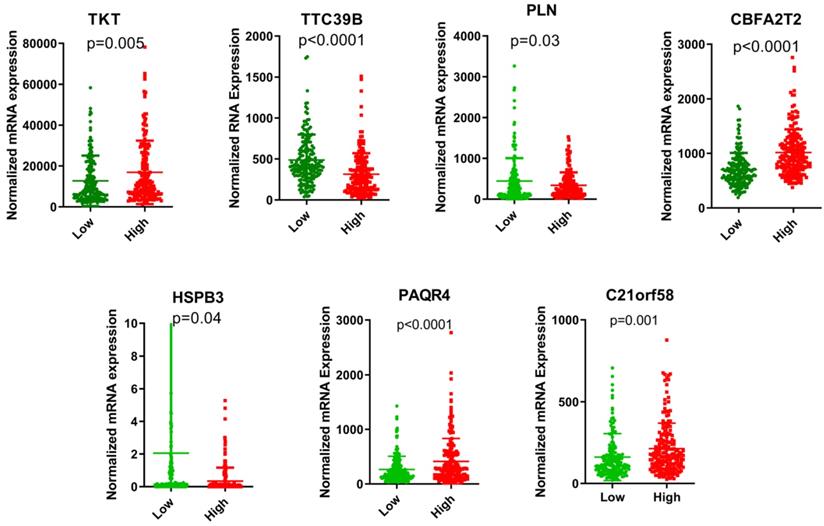
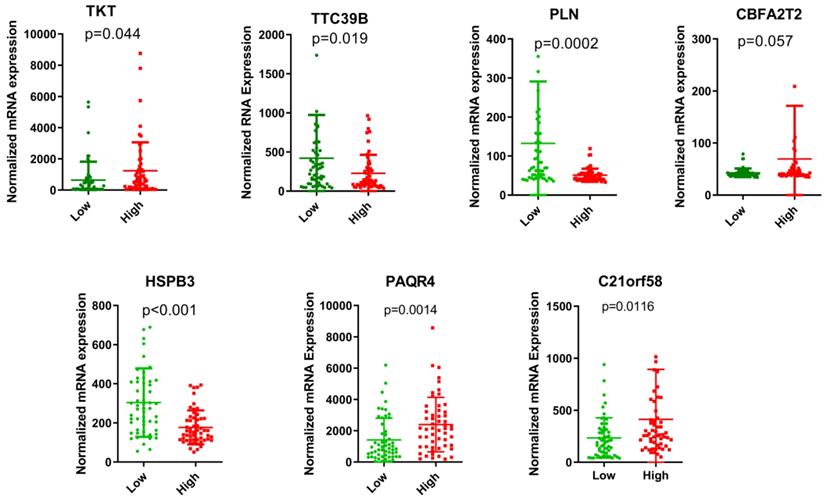
The risk score of each HCC patient was calculated based on the equation: risk score = (0.345) * TKT value + (0.213) * CBFA2T2 value + (0.132) * PAQR4 value + (0.115) * C21orf58 value + (-0.015) * TTC39B value + (-0.043) * PLN value + (-0.077) * HSPB3 value. All HCC subjects were stratified into high- and low-risk groups in accordance with risk score. The risk score distribution, gene expression and survival status of each HCC patient were revealed in Figure 1. For the seven genes, four genes corresponded to high risk (TKT, CBFA2T2, PAQR4, C21orf58; HR > 1) and three genes seemed to be protective (TTC39B, PLN, HSPB3; HR < 1). We made a comparison in the expression discrepancies of seven genes between high- and low-risk groups. Indeed, risky genes were prone to express in patients with high-risk scores, while patients in the low-risk group were characterized with protective genes expression (Figure 2 and Figure 3). To identify the relationship between risk score model and clinicopathological characteristics in HCC patients, we further analyzed the risk score level in HCC patients at different clinical stages. As revealed in Table 3, risk score based on this seven-gene prognostic model was significantly associated with N classification, M classification, histologic grade, AJCC staging, fibrosis score (both P < 0.05). Thus, these findings highlight that the level of risk score is related to diverse crucial pathological characteristics of HCC patients.
Risk-score analysis of HCC patients in the (A) TCGA and (B) GSE76427 datasets. There was a graphical representation concerning the risk score distribution, gene expression profiles, and survival condition of HCC patients.
The expression levels of the seven genes based on TCGA cohort in the risk groups.
The expression levels of the seven genes based on GSE76427 cohort in the risk groups.
Association between the clinicopathologic parameters and the risk score levels in HCC
| Variable | Groups | N | Low | % | High | % | HR (95% CI) | p |
|---|---|---|---|---|---|---|---|---|
| Age (years) | ≤60 | 177 | 97 | 54.8% | 80 | 45.2% | 0.42 (0.25-0.74) | 0.07 |
| >60 | 195 | 88 | 45.1% | 107 | 54.9% | 0.67 (0.43-1.1) | ||
| Gender | Male | 252 | 122 | 48.4% | 130 | 51.6% | 0.53 (0.34-0.83) | 0.12 |
| Female | 120 | 63 | 52.5% | 57 | 47.5% | 1.5 (0.86-2.71) | ||
| Tumor Status | With | 112 | 88 | 48.2% | 96 | 51.8% | 0.64 (0.38-1.1) | 0.07 |
| Free | 233 | 113 | 48.5% | 120 | 51.5% | 0.55 (0.33-0.92) | ||
| NA | 27 | |||||||
| Race | White | 184 | 88 | 47.8% | 88 | 52.2% | 0.71 (0.45-1.12) | 0.12 |
| Asian | 159 | 86 | 54.1% | 73 | 45.9% | 0.48 (0.27-0.88) | ||
| Black | 17 | 7 | 41.2% | 10 | 58.8% | 2.76 (0.62-12.4) | ||
| NA | 12 | |||||||
| BMI | ≤26 | 204 | 109 | 53.4% | 95 | 46.6% | 0.48 (0.29-0.77) | 0.09 |
| >26 | 151 | 66 | 43.7% | 85 | 56.3% | 0.66 (0.39-1.16) | ||
| NA | 17 | |||||||
| Family history | No | 209 | 110 | 52.6% | 99 | 47.4% | 0.37 (0.22-0.61) | 0.99 |
| Yes | 111 | 49 | 44.1% | 62 | 55.9% | 1.01 (0.57-1.75) | ||
| NA | 52 | |||||||
| TNM | Stage I | 172 | 77 | 44.8% | 95 | 55.2% | 0.63 (0.34-1.12) | 0.12 |
| Stage II | 86 | 44 | 51.2% | 42 | 48.8% | 0.63 (0.28-1.42) | ||
| Stage III | 85 | 50 | 58.8% | 35 | 41.2% | 0.53 (0.30-0.96) | ||
| Stage IV | 5 | 2 | 40.0% | 3 | 60.0% | |||
| NA | 24 | |||||||
| T classification | T1 | 182 | 82 | 45.1% | 100 | 54.9% | 0.69 (0.38-1.25) | 0.22 |
| T2 | 94 | 51 | 54.3% | 43 | 45.7% | 0.70 (0.34-1.42) | ||
| T3 | 80 | 47 | 58.8% | 33 | 41.3% | 0.49 (0.27-0.86) | ||
| T4 | 13 | 5 | 38.5% | 8 | 61.5% | 0.25 (0.04-1.47) | ||
| TX | 1 | 0 | 0.0% | 1 | 100.0% | |||
| NA | 2 | |||||||
| N classification | N0 | 253 | 129 | 51.0% | 124 | 49.0% | 0.62 (0.41-0.95) | 0.02 |
| N1 | 4 | 4 | 100.0% | 0 | 0.0% | |||
| NX | 114 | 52 | 45.6% | 62 | 54.4% | 0.53 (0.29-0.98) | ||
| NA | 1 | |||||||
| M classification | M0 | 267 | 136 | 50.9% | 131 | 49.1% | 0.61 (0.40-0.93) | 0.01 |
| M1 | 4 | 1 | 25.0% | 3 | 75.0% | |||
| MX | 101 | 48 | 47.5% | 53 | 52.5% | 0.43 (0.23-0.80) | ||
| Histologic grade | G1 | 55 | 14 | 25.5% | 41 | 74.5% | 0.44 (0.14-1.34) | 0.04 |
| G2 | 178 | 84 | 47.2% | 94 | 52.8% | 0.61 (0.36-1.02) | ||
| G3 | 122 | 76 | 62.3% | 46 | 37.7% | 0.56 (0.31-1.02) | ||
| G4 | 12 | 8 | 66.7% | 4 | 33.3% | 0.79 (0.12-5.02) | ||
| NA | 5 | |||||||
| Residual tumor | R0 | 325 | 156 | 48.0% | 169 | 52.0% | 0.48 (0.33-0.70) | 0.13 |
| R1 | 17 | 14 | 82.4% | 3 | 17.6% | 2.52 (0.43-14.67) | ||
| R2 | 1 | 0 | 0.0% | 1 | 100.0% | |||
| RX | 22 | 12 | 54.5% | 10 | 45.5% | 4.0 (0.51-31.3) | ||
| NA | 7 | |||||||
| AJCC staging | 4th | 4 | 0 | 0.0% | 4 | 100.0% | ||
| 5th | 21 | 8 | 38.1% | 13 | 61.9% | 0.37 (0.11-1.20) | 0.02 | |
| 6th | 119 | 64 | 53.8% | 55 | 46.2% | 0.68 (0.41-1.12) | ||
| 7th | 228 | 113 | 49.6% | 115 | 50.4% | 0.68 (0.38-1.25) | ||
| Child-Pugh | A | 217 | 100 | 46.1% | 117 | 53.9% | 0.72 (0.22-2.26) | 0.11 |
| B | 21 | 10 | 47.6% | 11 | 52.4% | 0.97 (0.23-4.02) | ||
| C | 1 | 0 | 0.0% | 1 | 100.0% | |||
| NA | 133 | |||||||
| Vascular invasion | None | 207 | 94 | 45.4% | 113 | 54.6% | 0.53 (0.32-0.89) | 0.48 |
| Micro | 93 | 44 | 47.3% | 49 | 52.7% | 0.77 (0.35-1.68) | ||
| Macro | 16 | 13 | 81.3% | 3 | 18.8% | 0.28 (0-38) | ||
| NA | 56 | |||||||
| Virus infection | HBV | 104 | 49 | 47.1% | 55 | 52.9% | 0.75 (0.32-1.86) | 0.51 |
| HCV | 53 | 26 | 49.1% | 27 | 50.9% | 0.52 (0.21-1.29) | ||
| No | 169 | 88 | 52.1% | 81 | 47.9% | |||
| NA | 46 | |||||||
| Alcoholic | Yes | 117 | 60 | 51.3% | 57 | 48.7% | 0.54 (0.29-1.02) | 0.05 |
| No | 225 | 110 | 48.9% | 115 | 51.1% | 0.6 (0.39-0.94) | ||
| NA | 30 | |||||||
| AFP level | Normal | 116 | 51 | 44.0% | 65 | 56.0% | 0.77 (0.35-1.71) | 0.51 |
| Elevated | 147 | 75 | 51.0% | 72 | 49.0% | 0.57 (0.33-1.0) | ||
| NA | 109 | |||||||
| Fibrosis Score | 0-4 | 133 | 60 | 45.1% | 73 | 54.9% | 0.55 (0.30-1.03) | 0.03 |
| 5-6 | 80 | 29 | 36.3% | 51 | 63.8% | 0.38 (0.11-1.35) | ||
| NA | 159 | |||||||
| Hepatic Inflammation | No | 117 | 52 | 44.4% | 65 | 55.6% | 0.57 (0.27-1.19) | 0.08 |
| Mild | 101 | 46 | 55 | 54.5% | 0.54 (0.25-1.19) | |||
| Severe | 17 | 7 | 10 | 58.8% | 3.4 (0.32-36.3) | |||
| NA | 137 | |||||||
| Relapse | No | 173 | 84 | 89 | 51.4% | 0.62 (0.31-1.21) | 0.43 | |
| Yes | 98 | 48 | 50 | 51.0% | 0.78 (0.42-1.47) | |||
| NA | 101 |
Correlation between a seven-gene prognostic signature and HCC survival
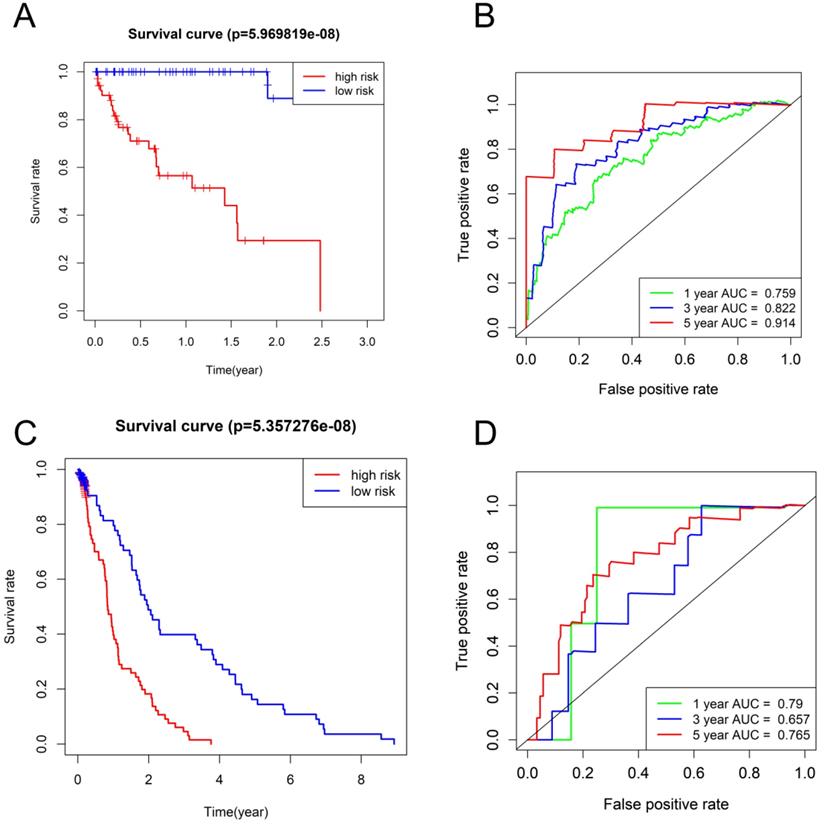
The HCC subjects in low-risk group were characterized with more satisfactory OS in comparison to those in high-risk group (P < 0.001) (Figure 4A, C). The time-dependent ROC curves based on TCGA dataset displayed that the AUCs for 1-year, 3-year, and 5-year OS were 0.759, 0.822 and 0.914, respectively and the corresponding values based on GSE76427 dataset were 0.79, 0.657, and 0.765, respectively (P < 0.05) (Figure 4B, D), highlighting a substantially effective predictive performance of the seven-gene signature for HCC prognosis.
Survival analysis and time-dependent ROC analysis in (A and B) TCGA database and (C and D) GSE76427.
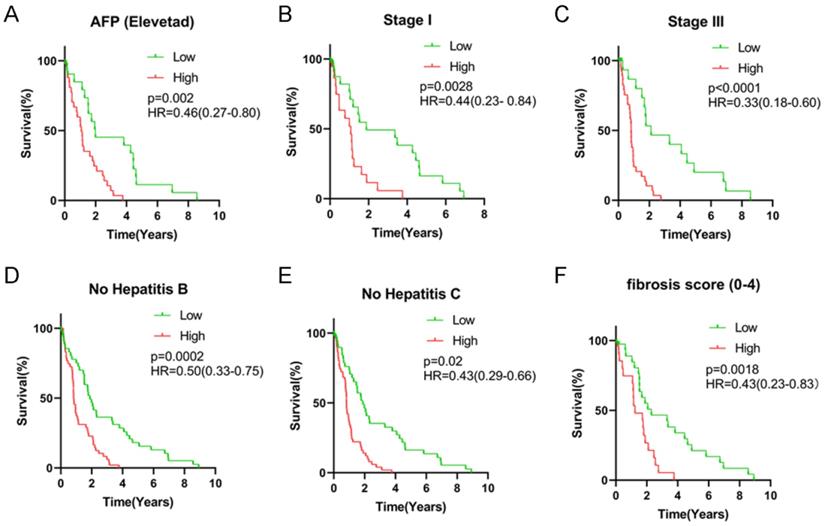
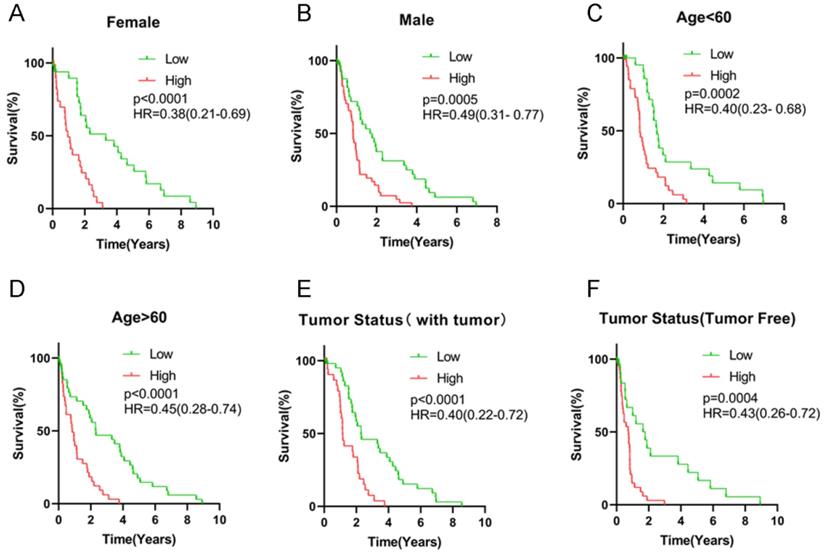
All HCC subjects were further stratified into different subgroups based on clinicopathologic characteristics to confirm the association between signature risk score and HCC prognosis. Survival analysis revealed that regardless of age, gender and tumor status, there was statistically significant discrepancy in HCC prognosis between the high- and low-risk groups (HR = 0.38, 95% CI = 0.21-0.69, P < 0.0001 for female patients; HR = 0.49, 95% CI = 0.31-0.77, P = 0.0005 for male patients; HR = 0.40, 95% CI = 0.23-0.68, P = 0.0002 for patients with age < 60 years old; HR = 0.45, 95% CI = 0.28-0.74, P < 0.0001 for patients with age ≥ 60 years old; HR = 0.43, 95% CI = 0.26-0.72, P = 0.0004 for patients with free tumor; Figure 5). Low signature risk scores were significantly related to more favorable OS in the subgroup of patients with elevated AFP levels (HR = 0.46, 95% CI = 0.27-0.80, P = 0.002), at TNM stage I (HR = 0.44, 95% CI = 0.23-0.84, P = 0.0028) or stage III (HR = 0.33, 95% CI = 0.18-0.60, P < 0.0001), with low level of fibrosis (HR = 0.43, 95% CI = 0.23-0.83, P = 0.0018), without HBV infection (0.50, 95% CI = 0.33-0.75, P = 0.0002) or HCV infection (HR = 0.43, 95% CI = 0.29-0.66, P = 0.02) (Figure 6). Nevertheless, for HCC patients with HBV or HCV infection, normal AFP levels and at TNM stage II and IV, the statistically significant prognostic difference was not revealed between the high- and low-risk groups. Above findings imply that the risk score signature potentially serves as a robust prognostic marker for HCC patients and fails to be affected by parameters that usually trigger variations in the performance of conventional biomarkers. Moreover, as shown in Supplementary Figure 2, the predictive accuracy of our model was relatively satisfactory than additional clinical indicators, such as TNM stage, BCLC stage and pathological differentiation.
Survival analysis of risk score levels in different subgroups of HCC patients. OS analysis of (A) elevated AFP level, (B) TNM stage I, (C) TNM stage III, (D) no HBV infection, (E) no HCV infection and (F) fibrosis score.
Survival analysis of risk score levels in different subgroups of HCC patients. OS analysis of (A-B) gender, (C-D) age, (E-F) tumor status.
Cox proportional hazards regression analysis
We further evaluated the effect of the seven-gene prognostic signature on the OS of HCC patients through univariate and multivariate Cox regression. For the whole TCGA cohort, univariate Cox regression revealed that gender, histologic grade, AJCC stage and fibrosis score as well as risk score were significantly correlated with HCC survival (both P < 0.05). The corresponding multivariate Cox regression analysis demonstrated that HCC patients with poor histologic grade, advanced AJCC stage as well as high risk scores potentially exhibited more unsatisfactory prognosis (both P < 0.05) (Table 4). Based on data extracted from GSE76427 database, BCLC stage, TNM stage and risk score were significantly associated with HCC prognosis through univariate and multivariate Cox regression analysis (both P < 0.05) (Table 5). Therefore, low risk score was indeed an independent protective indicator for HCC prognosis.
Univariate and multivariate Cox regression analyses of the seven-gene signature and HCC OS in TCGA dataset
| Variable | N | Univariate analysis | Multivariate analysis | ||
|---|---|---|---|---|---|
| HR (95% CI) | p value | HR (95% CI) | p value | ||
| Age (years) | |||||
| ≤60 | 180 | Reference | |||
| >60 | 197 | 0.89 (0.63-1.3) | 0.53 | ||
| Gender | |||||
| Female | 120 | Reference | |||
| Male | 252 | 1.5 (1.0-2.1) | 0.03 | 1.2 (0.82-1.8) | 0.33 |
| Race | |||||
| Asian | 159 | Reference | |||
| White | 184 | 0.39(0.26-0.58) | 0.55 | ||
| Black | 17 | 0.55(0.24-1.24) | 0.15 | ||
| NA | 12 | ||||
| BMI | |||||
| ≤26 | 204 | Reference | |||
| >26 | 151 | 0.83 (0.58-1.2) | 0.30 | ||
| NA | 17 | ||||
| Family history | |||||
| No | 209 | Reference | |||
| Yes | 111 | 0.83 (0.57-1.2) | 0.32 | ||
| NA | 52 | ||||
| TNM Stage | |||||
| I | 172 | Reference | |||
| II | 86 | 0.99 (0.61-1.6) | 0.98 | ||
| III | 85 | 1.1 (0.71-1.6) | 0.73 | ||
| IV | 5 | 1.1 (0.34-3.6) | 0.86 | ||
| T classification | |||||
| T1 | 182 | Reference | |||
| T2 | 94 | 1 (0.64-1.6) | 0.94 | ||
| T3 | 80 | 1.2 (0.76-1.7) | 0.50 | ||
| T4 | 13 | 1.5 (0.77-3.1) | 0.22 | ||
| TX | 1 | 0.95 (0.13-6.9) | 0.96 | ||
| NA | 2 | 0.53 | |||
| N classification | |||||
| N0 | 253 | Reference | |||
| N1 | 4 | 0.86 (0.21-3.5) | 0.08 | ||
| NX | 114 | 0.73 (0.51-1.1) | 0.10 | ||
| NA | 1 | ||||
| M classification | |||||
| M0 | 267 | Reference | |||
| M1 | 4 | 1.1 (0.35-3.5) | 0.85 | ||
| MX | 101 | 0.92 (0.64-1.3) | 0.68 | ||
| Histologic grade | |||||
| G1 | 55 | Reference | |||
| G2 | 178 | 1.1 (0.63-1.8) | 0.01 | 1.5 (0.55-4) | 0.04 |
| G3 | 122 | 1.8 (1-3.2) | 0.04 | 2.1 (0.73-5.8) | 0.02 |
| G4 | 12 | 2.6 (0.95-7.3) | 0.06 | 4.2 (0.89-19) | 0.07 |
| NA | 5 | ||||
| AJCC staging | |||||
| 4th | 4 | Reference | |||
| 5th | 21 | 4.5 (1-20) | 0.05 | 4.3 (0.95-20) | 0.06 |
| 6th | 119 | 6.5 (1.5-28) | 0.01 | 4.9 (1.1-21) | 0.04 |
| 7th | 228 | 9.2 (2.1-40) | 0.003 | 5.6 (1.2-25) | 0.03 |
| Child-Pugh | |||||
| A | 217 | Reference | |||
| B | 21 | 1.5 (0.71-3.2) | 0.28 | ||
| C | 1 | 0.45 (0.061-3.3) | 0.43 | ||
| NA | 132 | ||||
| Vascular invasion | |||||
| Macro | 16 | Reference | |||
| None | 207 | 0.65 (0.31-1.4) | 0.26 | ||
| Micro | 93 | 0.73 (0.33-1.6) | 0.43 | ||
| NA | 56 | ||||
| Virus infection | |||||
| HBV | 104 | Reference | |||
| HCV | 53 | 0.8 (0.42-1.5) | 0.50 | ||
| No | 169 | 0.86 (0.51-1.4) | 0.56 | ||
| NA | 46 | ||||
| AFP level | |||||
| Elevated | 147 | Reference | |||
| Normal | 116 | 0.88 (0.54-1.4) | 0.60 | ||
| NA | 109 | ||||
| Fibrosis score | |||||
| 0-4 | 133 | Reference | |||
| 5-6 | 80 | 1.6 (0.94-2.9) | 0.04 | 1.2 (0.65-2.4) | 0.51 |
| NA | 159 | ||||
| Risk score | |||||
| High | 185 | Reference | |||
| Low | 187 | 0.55 (0.38-0.78) | 0.0008 | 0.5 (0.27-0.94) | 0.03 |
Univariate and multivariate Cox regression analyses of the seven-gene signature and HCC OS in TCGA dataset
| Variable | Univariate analysis | Multivariate analysis | ||
|---|---|---|---|---|
| HR (95% CI) | p value | HR (95% CI) | p value | |
| Age (years) | ||||
| ≤60 | 0.77 (0.33-1.8) | 0.54 | ||
| >60 | Reference | |||
| Gender | ||||
| Male | 1.2 (0.28-5.3) | 0.79 | ||
| Female | Reference | |||
| BCLC Stage | ||||
| A | Reference | |||
| B | 2.1 (0.83-5.3) | 0.002 | 1.1 (0.45-2.5) | 0.01 |
| C | 6.1 (1.8-21) | 0.004 | 3 (0.78-12) | 0.03 |
| TNM | ||||
| I | Reference | |||
| II | 0.28 (0.036-2.2) | 0.02 | 0.62 (0.26-1.5) | 0.02 |
| III | 2.1 (0.27-17) | 0.04 | 0.41 (0.086-1.9) | 0.03 |
| IV | 0.19 (0.071-0.52) | 0.001 | 2.3 (0.5-10) | 0.001 |
| Risk score | ||||
| Low | 0.17 (0.063-0.43) | 0.0003 | 0.15 (0.056-0.42) | 0.0003 |
| High | Reference | |||
Establishment and validation of a predictive nomogram
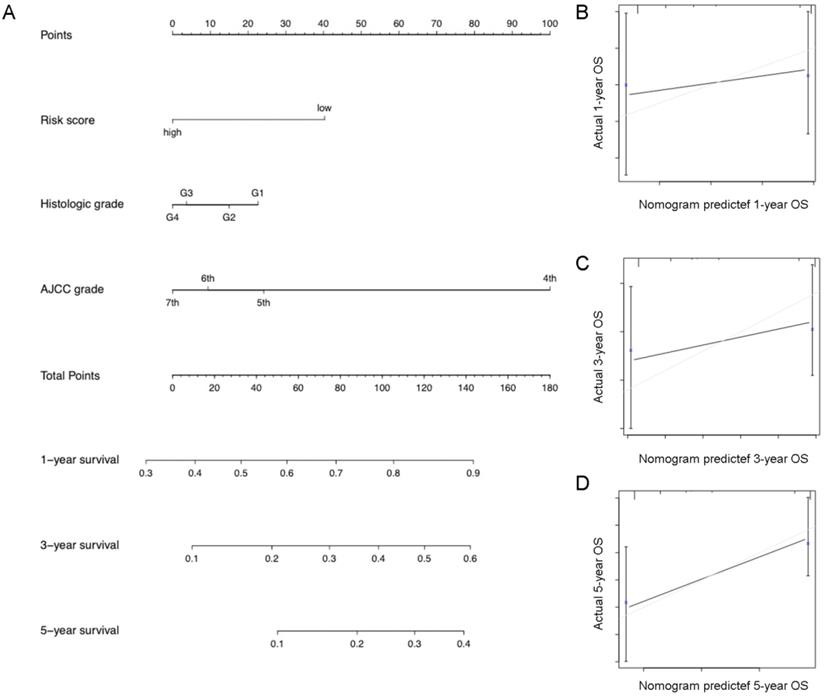
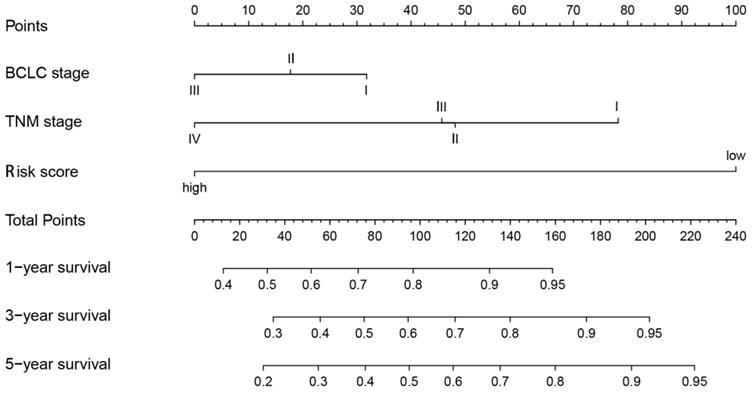
Eventually, we incorporated all significantly prognostic factors based on multivariate Cox regression analysis to formulate a nomogram, thus predicting OS of 342 HCC patients from TGGA. Specifically, AJCC stage and predictive risk score made the greatest contributions to HCC prognosis, followed by histologic grade in TCGA database (Figure 7). Risk score, TNM stage and BCLC stage exerted a crucial effect on the HCC prognosis in GSE76427 database (Figure 8). The C-index of nomogram associated with TCGA and GSE76427 database was 0.745 (95% CI: 0.676-0.816) and 0.7645 (95% CI: 0.699-0.835), highlighting a desirable predictive value of our nomogram models.
Nomogram combining risk score with significant clinicopathologic features to predict the OS of HCC patients in the TCGA dataset.
Nomogram combining risk score with significant clinicopathologic features to predict the OS of HCC patients in the GSE76427 dataset.
Discussion
Accumulating studies have highlighted that genetic changes and defects in the signaling pathways exert a crucial effect on tumorigenesis and development of HCC, indicating the potential prediction value of molecular biomarkers in HCC prognosis [26]. Furthermore, the prognostic gene signature combined with traditional clinical indicators exhibit a more satisfactory predictive performance than a single parameter [12, 27]. Currently, multi-gene signatures based on abnormal mRNA levels have attracted much consideration and displayed a promising predictive potential in HCC prognosis [19, 28-30].
In our report, we selected the seven common genes (TKT, TTC39B, PLN, CBFA2T2, HSPB3, PAQR4, C21 or f58) most significantly related to HCC prognosis through overlapping the TCGA and GEO databases. Each gene was defined as a risky gene (HR > 1) or protective gene (HR < 1) through univariate Cox regression analysis. A signature risk score based on the nine genes was developed and it conferred a standard to stratify HCC patients into high- and low-risk groups. We further conducted univariate and multivariate Cox regression analysis to validate the independent prognostic effect of this seven-gene signature on HCC. Kaplan-Meier curves showed that HCC patients in the high-risk group were characterized with unfavorable prognosis. Moreover, we exploited a nomogram with robust predictive performance to estimate survival through combining the signature risk score and additional clinicopathological characteristics with statistically significance. These findings highlight that the risk score is a stable, independent prognostic indicator with significant and effective predictive value for HCC patients based on our seven-gene model.
The mRNA TKT was one of the seven-gene prognostic signature in our study. TKT, a vital enzyme in the pentose phosphate pathway (PPP), is essential for tumor proliferation on account of its capability to influence NAPDH generation to counteract oxidative stress. Disturbing the redox homeostasis of cancer cells by genetic knockdown or pharmacologic inhibition of TKT sensitizes cancer cells to existing targeted therapy (Sorafenib) [31]. Reduced expression of TKT, which regulate flux into pyrimidine biosynthesis, correlates with better prognosis in pancreatic cancer patients on fluoropyrimidine analogs [32]. Specifically, TKT can promote the development of HCC in a non-metabolic manner via its nuclear localization and EGFR pathway [33]. Loss of TKT in the liver increased apoptosis, reduced cell proliferation, decreased TNF-α, IL-6, and STAT3 levels, and alleviated DEN/HFD-induced hepatic steatosis and fibrosis, highlighting a key role for TKT in promoting genome instability during liver injury and tumor initiation [34]. CBFA2T2 (also known as MTGR1), a member of the Myeloid Translocation Gene (MTG) family of transcriptional corepressors, can significantly predict the survival of renal cell carcinoma (RCC) patients. Knocking-down of CBFA2T2 can inhibit cell migration and invasion in RCC cells in vitro, and reduce ALDH high cancer stem cells (CSCs) populations. CBFA2T2 expression is necessary for sphere-forming ability and cancer stem cells marker expression in RCC cell lines [35, 36]. CBFA2T2 is required for tumorigenesis in the murine colitis-associated carcinoma [37-39]. PAQR4 has a tumorigenic effect on human breast cancers, and such effect is associated with a modulatory activity of PAQR4 on protein degradation of CDK4 [40, 41]. PAQR4 promotes cell proliferation and metastasis in both non-small-cell lung cancer [42] and gastric cancer [43]. C21orf58 exerts a momentous effect on breast cancer cell growth [14]. Nevertheless, the role of abnormal CBFA2T2, PAQR4 or C21orf58 in HCC remains undefined. Our study initially confirmed the negative effect of CBFA2T2, PAQR4 or C21orf58 on HCC prognosis for the first time. Conversely, tetratricopeptide repeat (TPR) domain protein 39B (TTC39B, C9orf52) (T39), a high density lipoprotein (HDL) gene discovered in human genome wide association studies (GWAS) [44, 45], is associated with atherosclerosis and steatohepatitis as well as inflammation [46]. HSPB3 is an unfavorable molecular biomarker in colorectal adenocarcinoma [47]. Nevertheless, the role of HSPB3 in HCC has not been illuminated.
Significantly, we formulated and identified a predictive prognostic model composed of seven genes to confer reference for HCC patient stratification in clinical practice. All enrolled HCC patients were sorted into high- and low-risk groups through mRNA expression levels rather than gene mutations or methylation alterations of merely seven prognostic genes. This method was more accessible and economical in practice considering that it diminished the utilization of whole-genome sequencing for all HCC subjects. Additionally, a nomogram was developed by combining this signature with conventional clinical indicators such as TNM stage, pathological differentiation, thus significantly enhancing the accuracy of predictive performance. It was also beneficial for clinicians to select high-risk HCC patients for adjuvant therapy except for surgical treatment. Notably, several limitations in our study need to be discussed. Initially, the clinical data from GEO database was insufficient and there was no additional valuable information concerning prognosis, including Child-Pugh scoring, cirrhosis scoring, AFP levels, tumor size and vascular invasion as well as therapeutic interventions. Furthermore, our study merely retrospectively analyzed relatively small sample size. A majority of patients from TCGA dataset were White or Asian. We should cautiously expand the results to additional ethnicities. Thirdly, further investigation should be warranted to determine the expression and the prognostic role of the seven genes at protein level as well as their underlying mechanisms. Thus, further independent prospective cohort studies with larger sample sizes and more elaborate clinical information are essential to validate the nine-gene signature and prognostic nomogram.
Conclusion
A novel seven-gene signature for prognostic prediction in HCC was established, with higher risk scores implying unfavorable prognosis. A nomogram model integrating the seven-gene signature with additional significant clinicopathological parameters also yielded promising predictive performance in HCC survival.
Abbreviations
HCC: hepatocellular carcinoma; TCGA: The Cancer Genome Atlas; GEO: Gene Expression Omnibus; DEmRNAs: Differentially expressed mRNAs; ROC: receiver operating characteristic; OS: overall survival; TNM: tumor-node-metastasis; AFP: alpha-fetoprotein; HR: hazard ratio; C-index: concordance index; AUC: under the curve; HBV: hepatitis B virus; HCV: hepatitis C virus.
Supplementary Material
Supplementary figures and tables.
Acknowledgements
The work was supported by the National Natural Science Foundation of China [81672787 (Y.T.)]; the Hunan Provincial Key Area R&D Programs [2019SK2253 (X.W. and Y.T.)], and the Overseas Expertise Introduction Project for Discipline Innovation (111 Project, No. 111-2-12).
Author Contributions
YG Tao and H Xie designed/planned the study. SP Liu performed computational modeling, acquired and analyzed clinical data. H Xie, SP Liu, P Chen and ZY Zhang performed imaging analysis. H Xie, SP Liu, P Chen, and ZY Zhang participated in discussion of related data. H Xie and SP Liu wrote the paper.
Competing Interests
The authors have declared that no competing interest exists.
References
1. Zhang Z, Tang H, Chen P, Xie H, Tao Y. Demystifying the manipulation of host immunity, metabolism, and extraintestinal tumors by the gut microbiome. Signal transduction and targeted therapy. 2019;4:41
2. Bray F, Ferlay J, Soerjomataram I, Siegel RL, Torre LA, Jemal A. Global cancer statistics 2018: GLOBOCAN estimates of incidence and mortality worldwide for 36 cancers in 185 countries. CA: a cancer journal for clinicians. 2018;68:394-424
3. Chen W, Zheng R, Baade PD, Zhang S, Zeng H, Bray F. et al. Cancer statistics in China, 2015. CA: a cancer journal for clinicians. 2016;66:115-32
4. Siegel RL, Miller KD, Jemal A. Cancer statistics, 2019. CA: a cancer journal for clinicians. 2019;69:7-34
5. Budhu A, Jia HL, Forgues M, Liu CG, Goldstein D, Lam A. et al. Identification of metastasis-related microRNAs in hepatocellular carcinoma. Hepatology (Baltimore, Md). 2008;47:897-907
6. Nault JC, Galle PR, Marquardt JU. The role of molecular enrichment on future therapies in hepatocellular carcinoma. Journal of hepatology. 2018;69:237-47
7. Zhang Z, Chen P, Xie H, Cao P. Using circulating tumor DNA as a novel biomarker to screen and diagnose hepatocellular carcinoma: A systematic review and meta-analysis. Cancer medicine. 2020;9:1349-64
8. Bruix J, Reig M, Sherman M. Evidence-Based Diagnosis, Staging, and Treatment of Patients With Hepatocellular Carcinoma. Gastroenterology. 2016;150:835-53
9. Marrero JA, Feng Z, Wang Y, Nguyen MH, Befeler AS, Roberts LR. et al. Alpha-fetoprotein, des-gamma carboxyprothrombin, and lectin-bound alpha-fetoprotein in early hepatocellular carcinoma. Gastroenterology. 2009;137:110-8
10. Chan MY, She WH, Dai WC, Tsang SHY, Chok KSH, Chan ACY. et al. Prognostic value of preoperative alpha-fetoprotein (AFP) level in patients receiving curative hepatectomy- an analysis of 1,182 patients in Hong Kong. Translational gastroenterology and hepatology. 2019;4:52
11. Le Y, Kan A, Li QJ, He MK, Chen HL, Shi M. NAP1L1 is a prognostic biomarker and contribute to doxorubicin chemotherapy resistance in human hepatocellular carcinoma. Cancer cell international. 2019;19:228
12. Mao M, Wang X, Sheng H, Liu Y, Zhang L, Dai S. et al. A novel score based on serum apolipoprotein A-1 and C-reactive protein is a prognostic biomarker in hepatocellular carcinoma patients. BMC cancer. 2018;18:1178
13. Yu B, Ding Y, Liao X, Wang C, Wang B, Chen X. Overexpression of PARPBP Correlates with Tumor Progression and Poor Prognosis in Hepatocellular Carcinoma. Digestive diseases and sciences. 2019;64:2878-92
14. Zhang B, Chen MY, Shen YJ, Zhuo XB, Gao P, Zhou FS. et al. A Large-Scale, Exome-Wide Association Study of Han Chinese Women Identifies Three Novel Loci Predisposing to Breast Cancer. Cancer research. 2018;78:3087-97
15. Luo C, Pu J, Liu F, Long X, Wang C, Wei H. et al. MicroRNA-200c expression is decreased in hepatocellular carcinoma and associated with poor prognosis. Clinics and research in hepatology and gastroenterology. 2019;43:715-21
16. Wu Y, Zhang S, Gong X, Tam S, Xiao D, Liu S. et al. The epigenetic regulators and metabolic changes in ferroptosis-associated cancer progression. Molecular cancer. 2020;19:39
17. Zhang X, Xie K, Zhou H, Wu Y, Li C, Liu Y. et al. Role of non-coding RNAs and RNA modifiers in cancer therapy resistance. Molecular cancer. 2020;19:47
18. Jin GZ, Yu WL, Dong H, Zhou WP, Gu YJ, Yu H. et al. SUOX is a promising diagnostic and prognostic biomarker for hepatocellular carcinoma. Journal of hepatology. 2013;59:510-7
19. Dong Z, Chen Y, Yang C, Zhang M, Chen A, Yang J. et al. STAT gene family mRNA expression and prognostic value in hepatocellular carcinoma. OncoTargets and therapy. 2019;12:7175-91
20. He Y, Gao M, Tang H, Cao Y, Liu S, Tao Y. Metabolic Intermediates in Tumorigenesis and Progression. International journal of biological sciences. 2019;15:1187-99
21. Zhang L, Liang Y, Li S, Zeng F, Meng Y, Chen Z. et al. The interplay of circulating tumor DNA and chromatin modification, therapeutic resistance, and metastasis. Molecular cancer. 2019;18:36
22. Diboun I, Wernisch L, Orengo CA, Koltzenburg M. Microarray analysis after RNA amplification can detect pronounced differences in gene expression using limma. BMC genomics. 2006;7:252
23. Iasonos A, Schrag D, Raj GV, Panageas KS. How to build and interpret a nomogram for cancer prognosis. Journal of clinical oncology: official journal of the American Society of Clinical Oncology. 2008;26:1364-70
24. Zhang Z, Xie H, Chen P, Cao P. Development and Identification of a Nomogram Prognostic Model for Patients with Primary Clear Cell Carcinoma of the Liver. Medical science monitor: international medical journal of experimental and clinical research. 2020;26:e919789
25. Heagerty PJ, Lumley T, Pepe MS. Time-dependent ROC curves for censored survival data and a diagnostic marker. Biometrics. 2000;56:337-44
26. Xu S, Shu P, Zou S, Shen X, Qu Y, Zhang Y. et al. NFATc1 is a tumor suppressor in hepatocellular carcinoma and induces tumor cell apoptosis by activating the FasL-mediated extrinsic signaling pathway. Cancer medicine. 2018;7:4701-17
27. Elshimi E, Sakr MAM, Morad WS, Mohammad L. Optimizing the Diagnostic Role of Alpha-Fetoprotein and Abdominal Ultrasound by Adding Overexpressed Blood mRNA Matrix Metalloproteinase-12 for Diagnosis of HCV-Related Hepatocellular Carcinoma. Gastrointestinal tumors. 2019;5:100-8
28. Li N, Zhao L, Guo C, Liu C, Liu Y. Identification of a novel DNA repair-related prognostic signature predicting survival of patients with hepatocellular carcinoma. Cancer management and research. 2019;11:7473-84
29. Wang Q, Wang G, Liu C, He X. Prognostic value of CpG island methylator phenotype among hepatocellular carcinoma patients: A systematic review and meta-analysis. International journal of surgery (London, England). 2018;54:92-9
30. Xiang XH, Yang L, Zhang X, Ma XH, Miao RC, Gu JX. et al. Seven-senescence-associated gene signature predicts overall survival for Asian patients with hepatocellular carcinoma. World journal of gastroenterology. 2019;25:1715-28
31. Xu IM, Lai RK, Lin SH, Tse AP, Chiu DK, Koh HY. et al. Transketolase counteracts oxidative stress to drive cancer development. Proceedings of the National Academy of Sciences of the United States of America. 2016;113:E725-34
32. Shukla SK, Purohit V, Mehla K, Gunda V, Chaika NV, Vernucci E. et al. MUC1 and HIF-1alpha Signaling Crosstalk Induces Anabolic Glucose Metabolism to Impart Gemcitabine Resistance to Pancreatic Cancer. Cancer cell. 2017;32:71-87.e7
33. Qin Z, Xiang C, Zhong F, Liu Y, Dong Q, Li K. et al. Transketolase (TKT) activity and nuclear localization promote hepatocellular carcinoma in a metabolic and a non-metabolic manner. Journal of experimental & clinical cancer research: CR. 2019;38:154
34. Li M, Lu Y, Li Y, Tong L, Gu XC, Meng J. et al. Transketolase Deficiency Protects the Liver from DNA Damage by Increasing Levels of Ribose 5-Phosphate and Nucleotides. Cancer research. 2019;79:3689-701
35. Chen DC, Liang YD, Peng L, Wang YZ, Ai CZ, Zhu XX. et al. CBFA2T2 is associated with a cancer stem cell state in renal cell carcinoma. Cancer cell international. 2017;17:103
36. Tu S, Narendra V, Yamaji M, Vidal SE, Rojas LA, Wang X. et al. Co-repressor CBFA2T2 regulates pluripotency and germline development. Nature. 2016;534:387-90
37. Barrett CW, Fingleton B, Williams A, Ning W, Fischer MA, Washington MK. et al. MTGR1 is required for tumorigenesis in the murine AOM/DSS colitis-associated carcinoma model. Cancer research. 2011;71:1302-12
38. Kumar R, Manning J, Spendlove HE, Kremmidiotis G, McKirdy R, Lee J. et al. ZNF652, a novel zinc finger protein, interacts with the putative breast tumor suppressor CBFA2T3 to repress transcription. Molecular cancer research: MCR. 2006;4:655-65
39. Parang B, Rosenblatt D, Williams AD, Washington MK, Revetta F, Short SP. et al. The transcriptional corepressor MTGR1 regulates intestinal secretory lineage allocation. FASEB journal: official publication of the Federation of American Societies for Experimental Biology. 2015;29:786-95
40. Wang L, Zhang R, You X, Zhang H, Wei S, Cheng T. et al. The steady-state level of CDK4 protein is regulated by antagonistic actions between PAQR4 and SKP2 and involved in tumorigenesis. Journal of molecular cell biology. 2017;9:409-21
41. Zhang H, Han R, Ling ZQ, Zhang F, Hou Y, You X. et al. PAQR4 has a tumorigenic effect in human breast cancers in association with reduced CDK4 degradation. Carcinogenesis. 2018;39:439-46
42. Wu B, Liu R. PAQR4 promotes cell proliferation and metastasis through the CDK4-pRB-E2F1 pathway in non-small-cell lung cancer. OncoTargets and therapy. 2019;12:3625-33
43. Feng Y, Sun T, Yu Y, Gao Y, Wang X, Chen Z. MicroRNA-370 inhibits the proliferation, invasion and EMT of gastric cancer cells by directly targeting PAQR4. Journal of pharmacological sciences. 2018;138:96-106
44. Hsieh J, Koseki M, Molusky MM, Yakushiji E, Ichi I, Westerterp M. et al. TTC39B deficiency stabilizes LXR reducing both atherosclerosis and steatohepatitis. Nature. 2016;535:303-7
45. Teslovich TM, Musunuru K, Smith AV, Edmondson AC, Stylianou IM, Koseki M. et al. Biological, clinical and population relevance of 95 loci for blood lipids. Nature. 2010;466:707-13
46. Ko JM, Ning L, Zhao XK, Chai AWY, Lei LC, Choi SSA. et al. BRCA2 loss-of-function germline mutations are associated with esophageal squamous cell carcinoma risk in Chinese. International journal of cancer. 2020;146:1042-51
47. Kalioraki MA, Artemaki PI, Sklirou AD, Kontos CK, Adamopoulos PG, Papadopoulos IN. et al. Heat shock protein beta 3 (HSPB3) is an unfavorable molecular biomarker in colorectal adenocarcinoma. Molecular carcinogenesis. 2020;59:116-25
Author contact
![]() Corresponding author: Yongguang Tao, E-mail: taoyongedu.cn, Hunan Cancer Hospital and The Affiliated Cancer Hospital of Xiangya School of Medicine, Central South University; Cancer Research Institute and School of Basic Medicine, Central South University.
Corresponding author: Yongguang Tao, E-mail: taoyongedu.cn, Hunan Cancer Hospital and The Affiliated Cancer Hospital of Xiangya School of Medicine, Central South University; Cancer Research Institute and School of Basic Medicine, Central South University.