Impact Factor ISSN: 1837-9664

 Global reach, higher impact
J Cancer 2020; 11(19):5812-5821. doi:10.7150/jca.46927 This issue Cite
Research Paper
Differences in tumour characteristics of Hepatocellular Carcinoma between patients with and without Cirrhosis: A population-based study
Bing Yan1,2*, Dou-Sheng Bai1*, Jian-Jun Qian1, Chi Zhang1, Sheng-Jie Jin1, Xuehao Wang3 ![]() , Guo-Qing Jiang1
, Guo-Qing Jiang1 ![]()
1. Department of Hepatobiliary Surgery, Clinical Medical College, Yangzhou University, Yangzhou 225001, China.
2. Department of Hepatobiliary Surgery, The Second Clinical College, Dalian Medical University, Dalian 116044, China.
3. Key Laboratory of Living Donor Liver Transplantation, Ministry of Public Health; Department of Liver Transplantation Center, The First Affiliated Hospital of Nanjing Medical University, Nanjing 210029, China.
*These authors contributed equally to this work.
Received 2020-4-12; Accepted 2020-7-25; Published 2020-8-3
Abstract
Background: Liver cirrhosis is a major risk factor for hepatocellular carcinoma (HCC). However, 10%-20% of patients with HCC do not have cirrhosis. The aim of this study was to explore the potential differences in tumour characteristics of HCC between patients with and without cirrhosis.
Methods: In this study, we identified total 10,849 patients with HCC diagnosed between 2010 and 2016, from the SEER database. The degree of fibrosis was categorized as “no cirrhosis” (Ishak score 0-4) or “cirrhosis” (Ishak score 5-6). Among all patients with HCC, patients with no cirrhosis and with cirrhosis accounted for 1800 (16.6%) and 9049 (83.4%), respectively.
Results: Significant negative correlations were observed between no cirrhosis/cirrhosis and pathological grade (r =-0.074, P <0.001), tumour size (r =-0.186, P <0.001), N stage (r =-0.024, P =0.025), M stage (r =-0.036, P <0.001), liver metastasis (r =-0.024, P =0.014), and lung metastasis (r =-0.027, P =0.006). Logistic multivariate regression analysis showed that, compared with cirrhosis, no cirrhosis is an independent risk predictor of pathological grade [odds ratio (OR), 0.685; 95% confidence interval (CI), 0.571-0.822; P < 0.001], tumour size (OR, 0.392; 95% CI, 0.351-0.437; P < 0.001), N stage (OR, 0.704; 95% CI, 0.561-0.883; P < 0.001), and M stage (OR, 0.671; 95% CI, 0.561-0.804; P < 0.001).
Conclusions: Compared with cirrhosis, no cirrhosis is significantly associated with worse pathological grade, larger tumour size, and more lymph node and distant metastases. Patients without cirrhosis that are otherwise neglected in HCC clinical practice require intensive focus in future studies.
Keywords: Cirrhosis, hepatocellular carcinoma, metastasis, pathological grade, tumour size
Introduction
Hepatocellular carcinoma (HCC) is the seventh most prevalent cancer worldwide and the fourth leading cause of cancer-related death [1]. Liver cirrhosis induced by any aetiology is a major risk factor for HCC and has been associated with infection by hepatitis B virus or hepatitis C virus, alcoholic liver disease, and non-alcoholic fatty liver disease. HCC occurs in approximately 80%-90% of patients with liver cirrhosis [2,3]. In other words, about 10%-20% of patients with HCC do not have cirrhosis. However, differences in the tumour characteristics of HCC between patients with and without cirrhosis are still unclear.
In this study, we examined the potential differences in tumour characteristics of HCC between patients with and without cirrhosis using a population-based data from the cancer registry of the Surveillance, Epidemiology, and End Results (SEER) program [4]. To the best of our knowledge, the present study is the first report that explores the differences in tumour characteristics of HCC between patients with and without cirrhosis.
Materials and Methods
Data Source
The study cohort was assembled using data associated with HCC from the SEER program (from 2010 through 2016). The SEER database is maintained by the US National Cancer Institute and provides information on cancer incidence and survival [4]. Initially, 54,238 patients with liver cancer were identified using Site Code C220 in the SEER database. We collected demographic data included sex, age, race, and marital status. Clinical characteristics included year of diagnosis; pathological grade; tumour, node, metastasis (TNM)-7 stage; bone, brain, liver, lung, distant lymph node, and other metastasis; tumour size; alpha fetoprotein (AFP) level; fibrosis score; radiation; chemotherapy; and surgery. Surgery included none, local tumour destruction (photodynamic therapy, electrocautery, fulguration, cryosurgery, laser, percutaneous ethanol injection, Heat-Radio-Frequency ablation, ultrasound, and acetic acid), surgical resection, and liver transplantation. The SEER database classifies fibrosis according to scores defined by the American Joint Committee on Cancer (AJCC) that range from 0 to 4 (undetectable to moderate fibrosis), designated “F0”, and 5 to 6 (incomplete to complete cirrhosis), designated “F1” [5]. In this study, we designated “F0” and “F1” as “no cirrhosis” and “cirrhosis”, respectively.
Patient Selection
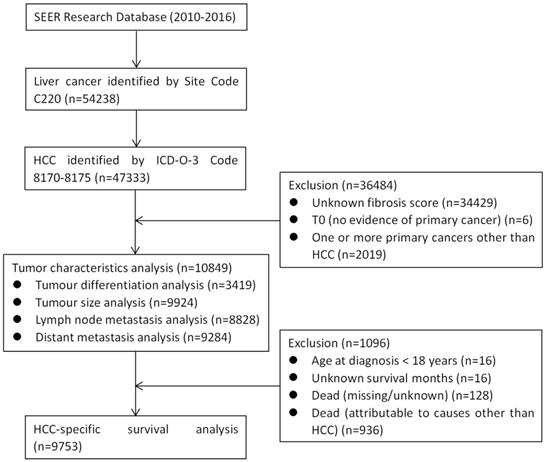
The patient group was reduced to 47,333 patients by inclusion criteria of selecting patients with histologic type HCC, according to the International Classification of Diseases for Oncology, 3rd Edition (ICD-O-3) (codes 8170, 8171, 8172, 8173, 8174 or 8175). We excluded patients with unknown fibrosis score, T0 (no evidence of primary cancer), or one or more primary cancers other than HCC. Thus, as shown in Figure 1, a total of 10,849 patients were included in the analysis of tumour characteristics. Tumour pathological grade, tumour size, N stage, and M stage data were available for 3419, 9924, 8828, and 9284 of these patients, respectively (Figure 1). The patient group was further reduced to 9753 patients after meeting the inclusion criteria that including patients those with age ≥ 18 years at diagnosis, definite survival months, or death attributable to HCC. We then performed HCC-specific survival (HCSS) analysis among the remaining patient group.
CONSORT diagram. SEER: the Surveillance, Epidemiology, and End Results; HCC: hepatocellular carcinoma.
Statistical Analyses
Statistical evaluation was conducted using IBM SPSS 22.0 (IBM Corp., Armonk, NY, USA). P values < 0.05 were considered statistically significant. Variables with P < 0.05 in univariate analysis were included in the final multivariate model.HCSS was derived from the dates of diagnosis of HCC and HCC cause-specific death. TNM-7 stages were assigned according to the criteria described in the AJCC Cancer Staging Manual (7th Edition) [6].
The χ2 test was used to compare characteristics between the patient groups with and without cirrhosis. Logistic multivariate regression was used to ascertain the different influences of cirrhosis and no cirrhosis on pathological grade, tumour size, N stage (lymph node metastasis), and M stage (distant metastasis). Univariate and multivariable Cox regression analyses were conducted to evaluate the effect of no cirrhosis/cirrhosis on HCSS.
Results
Patient Baseline Characteristics
Among the total 10,849 patients, 9049 (83.4%) had cirrhosis and 1800 (16.6%) patients did not have cirrhosis. As shown in Table 1, a comparative analysis of baseline demographics and tumour characteristics of groups with and without cirrhosis revealed that the no-cirrhosis group had higher proportions of older (age ≥ 60 years) and married patients, N1 stage, M1 stage, liver metastasis, lung metastasis, and negative AFP (all P < 0.05).
Baseline demographic and tumour characteristics of patients with and without cirrhosis
| Variables | n=10849 | Total | Fibrosis, No. (%) | P | No unknown† | Fibrosis, No. (%) | P | ||
|---|---|---|---|---|---|---|---|---|---|
| No cirrhosis | Cirrhosis | No cirrhosis | Cirrhosis | ||||||
| Sex | Male | 8458 (78.0) | 1383 (76.8) | 7075 (78.2) | 0.206 | 8458 (78.0) | 1383 (76.8) | 7075 (78.2) | 0.206 |
| Female | 2391 (22.0) | 417 (23.2) | 1974 (21.8) | 2391 (22.0) | 417 (23.2) | 1974 (21.8) | |||
| Age | <60 | 4351 (40.1) | 628 (34.9) | 3723 (41.1) | < 0.001 | 4351 (40.1) | 628 (34.9) | 3723 (41.1) | < 0.001 |
| ≥60 | 6498 (59.9) | 1172 (65.1) | 5326 (58.9) | 6498 (59.9) | 1172 (65.1) | 5326 (58.9) | |||
| Race | White | 7469 (68.8) | 1034 (57.4) | 6435 (71.1) | < 0.001 | 7469 (69.3) | 1034 (57.9) | 6435 (71.6) | < 0.001 |
| Black‡ | 1369 (12.6) | 267 (14.8) | 1102 (12.2) | 1369 (12.7) | 267 (14.9) | 1102 (12.3) | |||
| Other* | 1942 (17.9) | 486 (27.0) | 1456 (16.1) | 1942 (18.0) | 486 (27.2) | 1456 (16.2) | |||
| Unknown | 69 (0.6) | 13 (0.7) | 56 (0.6) | - | |||||
| Marital Status | Married | 5326 (49.1) | 973 (54.1) | 4353 (48.1) | < 0.001 | 5326 (51.0) | 973 (56.2) | 4353 (49.9) | < 0.001 |
| Non-married# | 5122 (47.2) | 758 (42.1) | 4364 (48.2) | 5122 (49.0) | 758 (43.8) | 4364 (50.1) | |||
| Unknown | 401 (3.7) | 69 (3.8) | 332 (3.7) | - | |||||
| Year of diagnosis | 2010-2011 | 2803 (25.8) | 434 (24.1) | 2369 (26.2) | 0.003 | 2803 (25.8) | 434 (24.1) | 2369 (26.2) | 0.003 |
| 2012-2013 | 3153 (29.1) | 488 (27.1) | 2665 (29.5) | 3153 (29.1) | 488 (27.1) | 2665 (29.5) | |||
| 2014-2016 | 4893 (45.1) | 878 (48.8) | 4015 (44.4) | 4893 (45.1) | 878 (48.8) | 4015 (44.4) | |||
| Pathological grade | Well differentiated | 1039 (9.6) | 274 (15.2) | 765 (8.5) | < 0.001 | 1039 (30.4) | 274 (26.5) | 765 (32.1) | < 0.001 |
| Moderately differentiated | 1688 (15.6) | 507 (28.2) | 1181 (13.1) | 1688 (49.4) | 507 (49.1) | 1181 (49.5) | |||
| Poorly differentiated | 651 (6.0) | 238 (13.2) | 413 (4.6) | 651 (19.0) | 238 (23.0) | 413 (17.3) | |||
| Undifferentiated | 41 (0.4) | 14 (0.8) | 27 (0.3) | 41 (1.2) | 14 (1.4) | 27 (1.1) | |||
| Unknown | 7430 (68.5) | 767 (42.6) | 6663 (73.6) | - | |||||
| T | T1 | 4009 (37.0) | 719 (39.9) | 3290 (36.4) | < 0.001 | 4009 (45.4) | 719 (50.0) | 3290 (44.5) | < 0.001 |
| T2 | 2533 (23.3) | 287 (15.9) | 2246 (24.8) | 2533 (28.7) | 287 (19.9) | 2246 (30.4) | |||
| T3 | 2028 (18.7) | 364 (20.2) | 1664 (18.4) | 2028 (23.0) | 364 (25.3) | 1664 (22.5) | |||
| T4 | 265 (2.4) | 69 (3.8) | 196 (2.2) | 265 (3.0) | 69 (4.8) | 196 (2.7) | |||
| Unknown | 2014 (18.6) | 361 (20.1) | 1653 (18.3) | - | |||||
| N | N0 | 8309 (76.6) | 1338 (74.3) | 6971 (77.0) | 0.025 | 8309 (94.1) | 1338 (92.9) | 6971 (94.4) | 0.025 |
| N1 | 519 (4.8) | 103 (5.7) | 416 (4.6) | 519 (5.9) | 103 (7.1) | 416 (5.6) | |||
| Unknown | 2021 (18.6) | 359 (19.9) | 1662 (18.4) | - | |||||
| M | M0 | 8413 (77.5) | 1313 (72.9) | 7100 (78.5) | < 0.001 | 8413 (90.6) | 1313 (88.2) | 7100 (91.1) | < 0.001 |
| M1 | 871 (8.0) | 175 (9.7) | 696 (7.7) | 871 (9.4) | 175 (11.8) | 696 (8.9) | |||
| Unknown | 1565 (14.4) | 312 (17.3) | 1253 (13.8) | - | |||||
| Bone metastasis | Yes | 279 (2.6) | 49 (2.7) | 230 (2.5) | 0.003 | 279 (2.6) | 49 (2.8) | 230 (2.6) | 0.725 |
| No | 10308 (95.0) | 1728 (96.0) | 8580 (94.8) | 10308 (97.4) | 1728 (97.2) | 8580 (97.4) | |||
| Unknown | 262 (2.4) | 23 (1.3) | 239 (2.6) | - | |||||
| Brain metastasis | Yes | 20 (0.2) | 1 (0.1) | 19 (0.2) | 0.003 | 20 (0.2) | 1 (0.1) | 19 (0.2) | 0.232 |
| No | 10557 (97.3) | 1773 (98.5) | 8784 (97.1) | 10557 (99.8) | 1773 (99.9) | 8784 (99.8) | |||
| Unknown | 272 (2.5) | 26 (1.4) | 246 (2.7) | - | |||||
| Liver metastasis | Yes | 55 (0.5) | 16 (0.9) | 39 (0.4) | < 0.001 | 55 (0.5) | 16 (0.9) | 39 (0.4) | 0.014 |
| No | 10531 (97.1) | 1760 (97.8) | 8771 (96.9) | 10531 (99.5) | 1760 (99.1) | 8771 (99.6) | |||
| Unknown | 263 (2.4) | 24 (1.3) | 239 (2.6) | - | |||||
| Lung metastasis | Yes | 371 (3.4) | 82 (4.6) | 289 (3.2) | < 0.001 | 371 (3.5) | 82 (4.6) | 289 (3.3) | 0.006 |
| No | 10200 (94.0) | 1695 (94.2) | 8505 (94.0) | 10200 (96.5) | 1695 (95.4) | 8505 (96.7) | |||
| Unknown | 278 (2.6) | 23 (1.3) | 255 (2.8) | - | |||||
| Distant lymph node metastasis | Yes | 27 (0.2) | 6 (0.3) | 21 (0.2) | < 0.001 | 27 (1.8) | 6 (2.0) | 21 (1.7) | 0.780 |
| No | 1496 (13.8) | 300 (16.7) | 1196 (13.2) | 1496 (98.2) | 300 (98.0) | 1196 (98.3) | |||
| Unknown | 9326 (86.0) | 1494 (83.0) | 7832 (86.6) | - | |||||
| Other metastasis | Yes | 36 (0.3) | 10 (0.6) | 26 (0.3) | < 0.001 | 36 (2.4) | 10 (3.3) | 26 (2.1) | 0.246 |
| No | 1485 (13.7) | 296 (16.4) | 1189 (13.1) | 1485 (97.6) | 296 (96.7) | 1189 (97.9) | |||
| Unknown | 9328 (86.0) | 1494 (83.0) | 7834 (86.6) | - | |||||
| Tumor Size | ≤3 cm | 3991 (36.8) | 463 (25.7) | 3528 (39.0) | < 0.001 | 3991 (40.2) | 463 (27.5) | 3528 (42.8) | < 0.001 |
| 3-5 cm | 2469 (22.8) | 344 (19.1) | 2125 (23.5) | 2469 (24.9) | 344 (20.4) | 2125 (25.8) | |||
| ≥5 cm | 3464 (31.9) | 879 (48.8) | 2585 (28.6) | 3464 (34.9) | 879 (52.1) | 2585 (31.4) | |||
| Unknown | 925 (8.5) | 114 (6.3) | 811 (9.0) | - | |||||
| AFP | Negative | 2785 (25.7) | 543 (30.2) | 2242 (24.8) | < 0.001 | 2785 (29.1) | 543 (34.7) | 2242 (28.0) | < 0.001 |
| Positive | 6801 (62.7) | 1023 (56.8) | 5778 (63.9) | 6801 (70.9) | 1023 (65.3) | 5778 (72.0) | |||
| Borderline | 17 (0.2) | 5 (0.3) | 12 (0.1) | - | |||||
| Unknown | 1246 (11.5) | 229 (12.7) | 1017 (11.2) | - | |||||
| Radiation | Yes | 924 (8.5) | 169 (9.4) | 755 (8.3) | 0.147 | - | |||
| None/unknown | 9925 (91.5) | 1631 (90.6) | 8294 (91.7) | - | |||||
| Chemotherapy | Yes | 5135 (47.3) | 688 (38.2) | 4447 (49.1) | < 0.001 | - | |||
| None/unknown | 5714 (52.7) | 1112 (61.8) | 4602 (50.9) | - | |||||
| Surgery | None | 7549 (69.6) | 926 (51.4) | 6623 (73.2) | < 0.001 | 7549 (69.7) | 926 (51.6) | 6623 (73.3) | < 0.001 |
| Tumor Destruction | 1363 (12.6) | 175 (9.7) | 1188 (13.1) | 1363 (12.6) | 175 (9.7) | 1188 (13.2) | |||
| Surgical Resection | 1150 (10.6) | 615 (34.2) | 535 (5.9) | 1150 (10.6) | 615 (34.2) | 535 (5.9) | |||
| Liver Transplantation | 767 (7.1) | 80 (4.4) | 687 (7.6) | 767 (7.1) | 80 (4.5) | 687 (7.6) | |||
| Unknown | 20 (0.2) | 4 (0.2) | 16 (0.2) | - | |||||
†, Not including unknown variables; ‡, Black or African American; *, Includes American Indian/Alaska native, Asian, and Asian/Pacific Islander; #, Includes widowed, never married, divorced, separated, unmarried, and domestic partner; T: tumour; N: node; M: metastasis; AFP: alpha fetoprotein.
Association between no cirrhosis/cirrhosis and pathological grade
There were a total 3419 patients with precise pathological grade information. A significant negative correlation was observed between no cirrhosis/cirrhosis and pathological grade (r = -0.074, P < 0.001). The no-cirrhosis group had more poorly differentiated/anaplastic tumours than the cirrhosis group (24.4% vs. 18.4%, P < 0.001). As shown in Table 2, univariate analysis of seven variables was conducted between well/moderately differentiated and poorly differentiated/anaplastic tumours. Significant variables between the two groups included race, AFP level, and no cirrhosis/cirrhosis. These statistically significant variables were regarded as independent variables, and pathological grade was regarded as the dependent variable. Logistic regression analysis revealed that, compared with no cirrhosis, cirrhosis was an independent and protective predictor of pathological grade [odds ratio (OR), 0.685; 95% confidence interval (CI), 0.571-0.822; P < 0.001].
Evaluation of the influence of no cirrhosis/cirrhosis on tumour pathological grade
| Variables | n = 3419 | Univariate analysis | Logistic multivariate regression | |||
|---|---|---|---|---|---|---|
| Well/Moderate No. (%) | Poor/Anaplastic No. (%) | P | OR (95%CI) | P | ||
| Sex | Male | 2128 (78.0) | 520 (75.1) | 0.104 | - | |
| Female | 599 (22.0) | 172 (24.9) | - | |||
| Age | <60 | 1073 (39.3) | 263 (38.0) | 0.518 | - | |
| ≥60 | 1654 (60.7) | 429 (62.0) | - | |||
| Race | White | 1842 (67.5) | 407 (58.8) | < 0.001 | Reference | |
| Black‡ | 362 (13.3) | 92 (13.3) | 1.052 (0.814-1.360) | 0.697 | ||
| Other* | 503 (18.4) | 191 (27.6) | 1.590 (1.297-1.950) | < 0.001 | ||
| Unknown | 20 (0.7) | 2 (0.3) | 0.451 (0.103-1.966) | 0.289 | ||
| Marital Status | Married | 1517 (55.6) | 377 (54.5) | 0.849 | - | |
| Non-married# | 1118 (41.0) | 292 (42.2) | - | |||
| Unknown | 92 (3.4) | 23 (3.3) | - | |||
| Year of diagnosis | 2010-2011 | 779 (28.6) | 189 (27.3) | 0.174 | - | |
| 2012-2013 | 780 (28.6) | 180 (26.0) | - | |||
| 2014-2016 | 1168 (42.8) | 323 (46.7) | - | |||
| AFP | Negative | 879 (32.2) | 107 (15.5) | < 0.001 | Reference | |
| Positive | 1488 (54.6) | 496 (71.7) | 2.834 (2.257-3.559) | < 0.001 | ||
| Borderline | 3 (0.1) | 0 (0.0) | 0.000 (0.000-0.000) | 0.999 | ||
| Unknown | 357 (13.1) | 89 (12.9) | 2.120 (1.556-2.888) | < 0.001 | ||
| Fibrosis | Non-cirrhosis | 781 (28.6) | 252 (36.4) | < 0.001 | Reference | |
| Cirrhosis | 1946 (71.4) | 440 (63.6) | 0.685 (0.571-0.822) | < 0.001 | ||
‡, Black or African American; *, Includes American Indian/Alaska native, Asian, and Asian/Pacific Islander; #, Includes widowed, never married, divorced, separated, unmarried, and domestic partner; AFP: alpha fetoprotein; OR: odds ratio; CI: confidence interval.
Association between no cirrhosis/cirrhosis and tumour size
Analysis of 9902 patients with information of precise tumour size showed a significant negative correlation between no cirrhosis/cirrhosis and tumour size (r = -0.186, P < 0.001), and tumour size in the no-cirrhosis group was significantly larger than in the cirrhosis group (68.0 ± 54.3 mm vs. 46.3 ± 40.3 mm, P < 0.001).
There were a total 9924 patients with rough tumour size information. More tumours with size ≥ 5 cm were found in the group without cirrhosis than in the cirrhosis group (50.9% vs. 29.5%, P < 0.001). As shown in Table 3, univariate analysis of seven variables was conducted between tumour size < 5 cm and ≥ 5 cm; significant variables between the two groups included sex, age, race, AFP level, and no cirrhosis/cirrhosis. The statistically significant variables were regarded as independent variables, and tumour size was regarded as the dependent variable. Logistic regression analysis revealed that, compared with no cirrhosis, cirrhosis was an independent and protective predictor of tumour size (OR, 0.392; 95% CI, 0.351-0.437; P < 0.001).
Evaluation of the influence of no cirrhosis/cirrhosis on tumour size
| Variables | n = 9924 | Univariate analysis | Logistic multivariate regression | |||
|---|---|---|---|---|---|---|
| <5 cm, No. (%) | ≥5 cm, No. (%) | P | OR (95%CI) | P | ||
| Sex | Male | 5056 (76.2) | 2645 (80.4) | < 0.001 | Reference | |
| Female | 1579 (23.8) | 644 (19.6) | 0.734 (0.660-0.816) | < 0.001 | ||
| Age | <60 | 2700 (40.7) | 1266 (38.5) | 0.035 | Reference | |
| ≥60 | 3935 (59.3) | 2023 (61.5) | 1.104 (1.011-1.206) | 0.028 | ||
| Race | White | 4715 (71.1) | 2110 (64.2) | < 0.001 | Reference | |
| Black‡ | 767 (11.6) | 471 (14.3) | 1.230 (1.081-1.400) | 0.002 | ||
| Other* | 1109 (16.7) | 691 (21.0) | 1.266 (1.132-1.416) | < 0.001 | ||
| Unknown | 44 (0.7) | 17 (0.5) | 0.900 (0.505-1.604) | 0.721 | ||
| Marital Status | Married | 3336 (50.3) | 1617 (49.2) | 0.402 | - | |
| Non-married# | 3072 (46.3) | 1546 (47.0) | - | |||
| Unknown | 227 (3.4) | 126 (3.8) | - | |||
| Year of diagnosis | 2010-2011 | 1740 (26.2) | 818 (24.9) | 0.103 | - | |
| 2012-2013 | 1936 (29.2) | 931 (28.3) | - | |||
| 2014-2016 | 2959 (44.6) | 1540 (46.8) | - | |||
| AFP | Negative | 1987 (29.9) | 689 (20.9) | < 0.001 | Reference | |
| Positive | 3918 (59.1) | 2299 (69.9) | 1.230 (1.081-1.400) | < 0.001 | ||
| Borderline | 14 (0.2) | 2 (0.1) | 1.266 (1.132-1.416) | |||
| Unknown | 716 (10.8) | 299 (9.1) | 0.900 (0.505-1.604) | < 0.001 | ||
| Fibrosis | Non-cirrhosis | 827 (12.5) | 859 (26.1) | < 0.001 | Reference | |
| Cirrhosis | 5808 (87.5) | 2430 (73.9) | 0.392 (0.351-0.437) | < 0.001 | ||
‡, Black or African American; *, Includes American Indian/Alaska native, Asian, and Asian/Pacific Islander; #, Includes widowed, never married, divorced, separated, unmarried, and domestic partner; AFP: alpha fetoprotein; OR: odds ratio; CI: confidence interval.
Association between no cirrhosis/cirrhosis and N stage
There were a total 8828 patients with original N stage information. A significant negative correlation was observed between no cirrhosis/cirrhosis and N stage (r = -0.025, P < 0.05). More N1 stage tumours occurred in the group without cirrhosis than in the cirrhosis group (7.2% vs. 5.6%, P < 0.001). As shown in Table 4, univariate analysis of seven variables between N0 stage and N1 stage tumours revealed that significant variables between the two groups included sex, race, marital status, AFP level, and no cirrhosis/cirrhosis. Statistically significant variables were regarded as independent variables, and N stage was regarded as the dependent variable. Logistic regression analysis revealed that, compared with no cirrhosis, cirrhosis was an independent and protective predictor of N stage (OR, 0.704; 95% CI, 0.561-0.883; P < 0.001).
Evaluation of the influence of no cirrhosis/cirrhosis on lymph node metastasis
| Variables | n = 8828 | Univariate analysis | Logistic multivariate regression | |||
|---|---|---|---|---|---|---|
| N0, No. (%) | N1, No. (%) | P | OR (95%CI) | P | ||
| Sex | Male | 6464 (77.8) | 440 (84.8) | < 0.001 | Reference | |
| Female | 1845 (22.2) | 79 (15.2) | 0.615 (0.481-0.787) | < 0.001 | ||
| Age | <60 | 3417 (41.1) | 219 (42.2) | 0.630 | - | |
| ≥60 | 4892 (58.9) | 300 (57.8) | - | |||
| Race | White | 5708 (68.7) | 371 (71.5) | 0.029 | Reference | |
| Black‡ | 1040 (12.5) | 76 (14.6) | 0.999 (0.771-1.294) | 0.992 | ||
| Other* | 1517 (18.3) | 69 (13.3) | 0.713 (0.545-0.933) | 0.014 | ||
| Unknown | 44 (0.5) | 3 (0.6) | 1.178 (0.361-3.845) | 0.786 | ||
| Marital Status | Married | 4161 (50.1) | 226 (43.5) | 0.008 | Reference | |
| Non-married# | 3862 (46.5) | 268 (51.6) | 1.252 (1.039-1.508) | 0.018 | ||
| Unknown | 286 (3.4) | 25 (4.8) | 1.605 (1.040-2.476) | 0.033 | ||
| Year of diagnosis | 2010-2011 | 2470 (29.7) | 144 (27.7) | 0.433 | - | |
| 2012-2013 | 2794 (33.6) | 188 (36.2) | - | |||
| 2014-2016 | 3045 (36.6) | 187 (36.0) | - | |||
| AFP | Negative | 2180 (26.2) | 75 (14.5) | < 0.001 | Reference | |
| Positive | 5211 (62.7) | 398 (76.7) | 2.250 (1.747-2.898) | < 0.001 | ||
| Borderline | 14 (0.2) | 0 (0.0) | 0.000 (0.000-0.000) | 0.999 | ||
| Unknown | 904 (10.9) | 46 (8.9) | 1.456 (0.999-2.122) | 0.050 | ||
| Fibrosis | Non-cirrhosis | 1338 (16.1) | 103 (19.8) | 0.025 | Reference | |
| Cirrhosis | 6971 (83.9) | 416 (80.2) | 0.704 (0.561-0.883) | 0.002 | ||
‡, Black or African American; *, Includes American Indian/Alaska native, Asian, and Asian/Pacific Islander; #, Includes widowed, never married, divorced, separated, unmarried, and domestic partner; AFP: alpha fetoprotein; OR: odds ratio; CI: confidence interval.
Association between no cirrhosis/cirrhosis and M stage
There were a total 8828 patients with original M stage information. A significant negative correlation was observed between no cirrhosis/cirrhosis and M stage (r = -0.036, P < 0.001). More M1 stage tumours were observed in patients without cirrhosis than in those with cirrhosis (11.8% vs. 8.9%, P < 0.001). As shown in Table 5, univariate analysis of seven variables between M0 stage and M1 stage tumours identified that significant variables between the two groups included sex, age, ethnicity, marital status, AFP level, and no cirrhosis/cirrhosis. Statistically significant variables were regarded as independent variables, and M stage was regarded as the dependent variable. Logistic regression analysis revealed that, compared with no cirrhosis, cirrhosis was an independent and protective predictor of M stage (OR, 0.671; 95% CI, 0.561-0.804; P < 0.001).
Evaluation of the influence of no cirrhosis/cirrhosis on distant metastasis
| Variables | n = 9284 | Univariate analysis | Logistic multivariate regression | |||
|---|---|---|---|---|---|---|
| M0, No. (%) | M1, No. (%) | P | OR (95%CI) | P | ||
| Sex | Male | 6550 (77.9) | 732 (84.0) | < 0.001 | Reference | |
| Female | 1863 (22.1) | 139 (16.0) | 0.651 (0.538-0.789) | < 0.001 | ||
| Age | <60 | 3436 (40.8) | 412 (47.3) | < 0.001 | Reference | |
| ≥60 | 4977 (59.2) | 459 (52.7) | 0.807 (0.700-0.930) | 0.003 | ||
| Race | White | 5810 (69.1) | 589 (67.6) | 0.009 | Reference | |
| Black‡ | 1029 (12.2) | 138 (15.8) | 1.169 (0.957-1.428) | 0.127 | ||
| Other* | 1526 (18.1) | 142 (16.3) | 0.940 (0.772-1.145) | 0.539 | ||
| Unknown | 48 (0.6) | 2 (0.2) | 0.459 (0.110-1.907) | 0.284 | ||
| Marital Status | Married | 4198 (49.9) | 376 (43.2) | < 0.001 | Reference | |
| Non-married# | 3898 (46.3) | 466 (53.5) | 1.311 (1.132-1.519) | < 0.001 | ||
| Unknown | 317 (3.8) | 29 (3.3) | 0.987 (0.663-1.470) | 0.949 | ||
| Year of diagnosis | 2010-2011 | 2547 (30.3) | 256 (29.4) | 0.811 | - | |
| 2012-2013 | 2858 (34.0) | 295 (33.9) | - | |||
| 2014-2016 | 3008 (35.8) | 320 (36.7) | - | |||
| AFP | Negative | 2201 (26.2) | 111 (12.7) | Reference | ||
| Positive | 5216 (62.0) | 668 (76.7) | 2.530 (2.054-3.116) | < 0.001 | ||
| Borderline | 13 (0.2) | 1 (0.1) | 1.466 (0.189-11.377) | 0.714 | ||
| Unknown | 983 (11.7) | 91 (10.4) | 1.825 (1.368-2.436) | < 0.001 | ||
| Fibrosis | Non-cirrhosis | 1313 (15.6) | 175 (20.1) | < 0.001 | Reference | |
| Cirrhosis | 7100 (84.4) | 696 (79.9) | 0.671 (0.561-0.804) | < 0.001 | ||
‡, Black or African American; *, Includes American Indian/Alaska native, Asian, and Asian/Pacific Islander; #, Includes widowed, never married, divorced, separated, unmarried, and domestic partner; AFP: alpha fetoprotein; OR: odds ratio; CI: confidence interval.
We identified 10,586 patients with liver metastasis information and found that patients without cirrhosis had a higher proportion of liver metastasis than those with cirrhosis: 16/1760 (0.9%) versus 39/8771 (0.4%), P = 0.014. Furthermore, the analysis of 10,571 patients with information on lung metastasis showed that the group without cirrhosis had a higher proportion of lung metastasis than the cirrhosis group: 82/1695 (4.6%) versus 289/8505 (3.3%), P = 0.006. There were significant negative correlations between no cirrhosis/cirrhosis and liver metastasis (r = -0.024, P = 0.014), and lung metastasis (r = -0.027, P = 0.006).
Association between no cirrhosis/cirrhosis and HCSS
As shown in Table 6, univariate Cox proportional hazards analysis involving 9753 patients was conducted to evaluate the association between different clinical variables and HCSS. Sex; race; marital status; year of diagnosis; pathological grade; T, N, and M stages; tumour size; AFP level; radiation; chemotherapy; surgery; and no cirrhosis/cirrhosis were identified as significant predictors for survival. Multivariable Cox regression analysis revealed that, compared with no cirrhosis, cirrhosis was an independent and risk prognostic factor for HCSS (hazard ratio [HR], 1.166; 95% CI, 1.074-1.265; P < 0.001).
Univariate and multivariate Cox proportional hazards analysis of disease-specific survival
| Variables | n = 9753 | Univariate analysis | Multivariate analysis | ||
|---|---|---|---|---|---|
| HR (95 % CI) | P Value | HR (95 % CI) | P Value | ||
| Sex | Male | Reference | < 0.001 | Reference | |
| Female | 0.812 (0.759-0.869) | 0.924 (0.862-0.991) | 0.027 | ||
| Age | <60 | Reference | 0.016 | Reference | |
| ≥60 | 1.070 (1.013-1.131) | 1.102 (1.041-1.166) | < 0.001 | ||
| Race | White | Reference | Reference | ||
| Black‡ | 1.103 (1.018-1.196) | 0.016 | 0.935 (0.862-1.014) | 0.104 | |
| Other* | 0.786 (0.729-0.848) | < 0.001 | 0.815 (0.754-0.881) | < 0.001 | |
| Unknown | 0.573 (0.373-0.880) | 0.011 | 0.695 (0.452-1.068) | 0.097 | |
| Marital Status | Married | Reference | Reference | ||
| Non-married# | 1.317 (1.246-1.392) | < 0.001 | 1.034 (0.976-1.094) | 0.255 | |
| Unknown | 1.204 (1.041-1.392) | 0.013 | 0.949 (0.819-1.099) | 0.482 | |
| Year of diagnosis | 2010-2011 | Reference | Reference | ||
| 2012-2013 | 0.983 (0.920-1.051) | 0.614 | 0.992 (0.928-1.061) | 0.815 | |
| 2014-2016 | 0.797 (0.743-0.854) | < 0.001 | 0.873 (0.811-0.940) | < 0.001 | |
| Pathological grade | Well differentiated | Reference | Reference | ||
| Moderately differentiated | 1.071 (0.944-1.215) | 0.288 | 1.153 (1.014-1.311) | 0.030 | |
| Poorly differentiated | 1.931 (1.672-2.230) | < 0.001 | 1.660 (1.432-1.924) | < 0.001 | |
| Undifferentiated | 2.270 (1.515-3.402) | < 0.001 | 2.121 (1.409-3.193) | < 0.001 | |
| Unknown | 1.893 (1.704-2.102) | < 0.001 | 1.208 (1.085-1.345) | < 0.001 | |
| T | T1 | Reference | Reference | ||
| T2 | 1.387 (1.288-1.495) | < 0.001 | 1.485 (1.375-1.605) | < 0.001 | |
| T3 | 4.076 (3.793-4.381) | < 0.001 | 1.878 (1.722-2.048) | < 0.001 | |
| T4 | 6.173 (5.366-7.102) | < 0.001 | 2.510 (2.156-2.923) | < 0.001 | |
| Unknown | 2.465 (2.239-2.714) | < 0.001 | 1.471 (1.265-1.711) | < 0.001 | |
| N | N0 | Reference | Reference | ||
| N1 | 3.255 (2.941-3.602) | < 0.001 | 1.210 (1.084-1.350) | < 0.001 | |
| Unknown | 1.428 (1.311-1.556) | < 0.001 | 1.176 (1.043-1.326) | 0.008 | |
| M | M0 | Reference | Reference | ||
| M1 | 4.035 (3.723-4.373) | < 0.001 | 1.781 (1.631-1.945) | < 0.001 | |
| Unknown | 0.946 (0.838-1.066) | 0.361 | 0.823 (0.678-0.998) | 0.047 | |
| Tumor Size | ≤3 cm | Reference | Reference | ||
| 3-5 cm | 1.835 (1.694-1.989) | < 0.001 | 1.792 (1.651-1.946) | < 0.001 | |
| ≥5 cm | 3.546 (3.304-3.806) | < 0.001 | 2.517 (2.300-2.754) | < 0.001 | |
| Unknown | 6.332 (5.748-6.975) | < 0.001 | 3.263 (2.886-3.688) | < 0.001 | |
| AFP | Negative | Reference | Reference | ||
| Positive | 1.960 (1.826-2.105) | < 0.001 | 1.449 (1.347-1.559) | < 0.001 | |
| Borderline | 1.258 (0.627-2.522) | 0.519 | 1.330 (0.662-2.674) | 0.423 | |
| Unknown | 1.640 (1.479-1.819) | < 0.001 | 1.282 (1.151-1.428) | < 0.001 | |
| Radiation | None/unknown | Reference | Reference | ||
| Yes | 1.249 (1.139-1.369) | < 0.001 | 0.653 (0.594-0.718) | < 0.001 | |
| Chemotherapy | None/unknown | Reference | Reference | ||
| Yes | 0.744 (0.705-0.786) | < 0.001 | 0.466 (0.439-0.494) | < 0.001 | |
| Surgery | None | Reference | Reference | ||
| Tumor Destruction | 0.317 (0.286-0.351) | < 0.001 | 0.388 (0.348-0.433) | < 0.001 | |
| Surgical Resection | 0.276 (0.246-0.310) | < 0.001 | 0.209 (0.183-0.240) | < 0.001 | |
| Liver Transplantation | 0.063 (0.049-0.082) | < 0.001 | 0.083 (0.064-0.108) | < 0.001 | |
| Unknown | 0.519 (0.247-1.090) | 0.083 | 0.804 (0.382-1.691) | 0.566 | |
| Fibrosis | Non-cirrhosis | Reference | Reference | ||
| Cirrhosis | 1.259 (1.166-1.358) | < 0.001 | 1.166 (1.074-1.265) | < 0.001 | |
‡, Black or African American; *, Includes American Indian/Alaska native, Asian, and Asian/Pacific Islander; #, Includes widowed, never married, divorced, separated, unmarried, and domestic partner; T: tumour; N: node; M: metastasis; AFP: alpha fetoprotein; HR: hazard ratio; CI: confidence interval.
Discussion
It is well known that cirrhosis is a major risk factor for hepatocarcinogenesis. As shown in the present study, among all patients with HCC, the number of patients with cirrhosis was over five times (9049/1800) that of patients without cirrhosis. However, the relationship between no cirrhosis/cirrhosis and tumour characteristics of HCC has not been reported. It has been unclear whether, compared with no cirrhosis; cirrhosis would be associated with larger tumour size or a greater number of less-differentiated tumours, or lymph node or distant metastasis.
The aim of the present study was to better understand the effect of no cirrhosis/cirrhosis on tumour characteristics, particularly on tumour differentiation, tumour size, lymph node metastasis, and distant metastasis. Improved knowledge of the effect of no cirrhosis/cirrhosis on tumour characteristics would help to properly classify patients with advanced stages of disease and may serve as a reference for personalized, precise treatment. It would seem logical that compared with no cirrhosis, cirrhosis would be associated with less differentiated tumours, more advanced TNM stage, and greater tumour size; however, the present study led to the opposite conclusions.
We have tried to use some publicly available databases including cBioPortal, GEO, TCGA, and so on, to validate our main findings and conclusions. However, we found that these publicly available databases concerning gene research are unsuited to the validation.
In order to obtain patients' genetic information, common defects of these publicly available databases is that most of the selected patients had received liver resection for HCC, for example, the data from cBioPortal databases showed 205 (95.3%) patients have underwent liver resection among 215 patients with fibrosis information [7]. In fact, it is well known that the majority of HCC patients at diagnosis lost the chance to receive liver resection owing to too big tumor or metastases, these HCC usually have more malignant biological behaviour than those who received liver resection. So, these publicly available databases used a biased inclusion criteria. The rate of patients who were not performed surgical treatment was about 69.6% (7549/10849) in the current study and 65.6% (7726/11783) in a previous study [8]. Therefore, these publicly available databases cannot reflect the real world of HCC, and the investigation outcomes from these databases may bring about biased conclusions.
However, we can use the data of the previous studies by the means of reanalysis and logical reasoning, to a certain extent, to validate our main findings and conclusions, as shown in the following discussion [8,9].
The present study revealed that no cirrhosis/cirrhosis had a significant negative correlation with pathological grade. With progression of pathological grade, the proportions of different pathological grades in the no-cirrhosis group ascended dynamically, in comparison with the cirrhosis group, as follows. First, the incidence of well differentiated tumours in the no-cirrhosis group was lower than that in the cirrhosis group (26.5% vs. 32.1%); the incidence of moderately differentiated tumours was similar in both groups (49.1% vs. 49.5%); finally, the incidences of poorly differentiated and undifferentiated tumours in the no-cirrhosis group were all higher than those in the cirrhosis group (23.0% vs. 17.3%, 1.4% vs. 1.1%, respectively). In addition, the present study demonstrated that no cirrhosis is an independent risk predictor for less-differentiated tumours, as compared with cirrhosis. Patients without cirrhosis were about 1.5 (1/0.685) times as likely to have poorly differentiated/anaplastic tumours as those with cirrhosis.
A previous study based on SEER database showed there were no significant differences in pathological grade between patients with and without cirrhosis [9]. This findings does not coincides with our present findings, which may due to their specific inclusion criteria that only patients who had received liver resection for HCC was included in the study. In fact, it is well known that the majority of HCC patients at diagnosis lost the chance to receive liver resection owing to too big tumor or metastases, these HCC usually have more malignant biological behaviour than those who received liver resection. The rate of patients who were not performed surgical treatment was about 69.6% (7549/10849) in the current study and 65.6% (7726/11783) in another retrospective SEER study [8]. Therefore, that previous study cannot reflect the real world of HCC, and its investigation outcomes may bring about biased conclusions.
Liu et al. reported that cirrhosis was positively correlated with advanced pathological grade (r = 0.19, P < 0.001) [8]. It seems that this conclusion was in contrast to ours, which is owing to their false statistical analysis. During the analysis of the relationship of between no cirrhosis/cirrhosis and pathological grade, the majority (62.2%, 7328/11783) of patients with unavailable pathological grade information contributed to distorted outcome. When we deleted the data of that previous study for patients with unknown information of pathological grade and reanalyzed the data, we found, in fact, that cirrhosis was negatively correlated with advanced pathological grade (r = -0.287, P < 0.001), which was consistent with our present findings.
Compared with cirrhosis, a significant positive correlation was observed between no cirrhosis and N1 stage in the present study; in addition, logistic multivariate regression showed no cirrhosis was an independent risk predictor for lymph node metastasis. Our findings showed that patients without cirrhosis were more than 1.4 (1/0.704) times as likely to have lymph node metastasis as those with cirrhosis. Furthermore, compared with cirrhosis, a significant positive correlation was found between no cirrhosis and M1 stage in the present study; in addition, logistic multivariate regression showed no cirrhosis was an independent risk predictor for distant metastasis. Patients without cirrhosis were approximately 1.5 (1/0.671) times as likely to have distant metastasis as those with cirrhosis. The incidences of distant organ metastasis in the brain (0.2%), liver (0.5%), bone (2.6%), and lung (3.5%) were gradually elevated. The lung was the most common site of metastasis and the brain was the least common site. There were significant negative correlations between no cirrhosis/cirrhosis and liver metastasis, and lung metastasis. Among all distant metastases, no cirrhosis was a significant risk factor for liver and lung metastasis, as compared with cirrhosis. The data of a previous study showed more TNM-stage IV tumours occurred in the group without cirrhosis than in the cirrhosis group (12.1% vs. 9.2%, P < 0.001) [8]. As we all know, TNM-stage IV means tumour is at N1 or M1 stageS. Therefore, this data basically supported our findings.
A significant negative correlation was observed between no cirrhosis/cirrhosis and tumour size in the present study. Tumour size in the no-cirrhosis group was about 1.5 (68.0 mm/46.3 mm) times that of the cirrhosis group; in addition, logistic multivariate regression showed no cirrhosis was an independent risk predictor for larger tumours. This finding was supported by that of a previous study they demonstrated that, compared with cirrhosis, no cirrhosis was negatively related to smaller tumour (r = -0.16, P < 0.001) [8]. Another study also revealed that no cirrhosis is significantly associated with larger tumour, which is consistent with our conclusion [9].
Despite our finding that no cirrhosis is associated with worse tumour characteristics, the current study showed that cirrhosis was independently associated with poorer HCSS. The latter finding has been supported in many studies [9,10], which have reported that cirrhosis is an independently significant predictor of poor survival following surgical resection. Background cirrhosis may be the most important factor explaining why HCC patients with cirrhosis have relatively better tumour characteristics but shorter survival than those without cirrhosis. Especially in the case of medical treatment, HCC patients with cirrhosis have a higher risk of developing hepatic dysfunction and even death than those without cirrhosis.
Our data showed that the opportunity for surgical resection in the no-cirrhosis group was 5.8 (34.2%/5.9%) times that in the cirrhosis group, and adjuvant therapy including radiation and chemotherapy was available, to improve HCSS. Therefore, among patients with HCC with no opportunity for surgery, well-selected patients may obtain survival benefit from sufficient administration of radiation or chemotherapy.
The present study has several limitations. First, the SEER HCC database lacks data regarding the aetiologies of patient fibrosis, comorbidities, and recurrence; these variables may affect tumour characteristics and survival. Second, some data for radiation or chemotherapy were denoted “No/Unknown”; this is somewhat unclear and means that in our analysis, we did not have a patient group that definitely did not receive either therapy. Finally, only two categories of fibrosis (“F0” and “F1”) are recorded in the database; if information for an original fibrosis score could be obtained, we could conduct further analyses.
In conclusion, this population-based study demonstrated that no cirrhosis is an independent risk predictor for larger tumour size, worse pathological grade, and lymph node and distant metastases, in comparison with cirrhosis. Patients without cirrhosis, who are otherwise neglected in HCC clinical practice, require additional investigation regarding the specific molecular mechanisms by which they are more prone to worse tumour characteristics. Physician should pay greater attention to patients with HCC who do not have cirrhosis as they may benefit from sufficient and precise therapy.
Abbreviations
HCC: hepatocellular carcinoma; SEER: Surveillance, Epidemiology, and End Results; TNM: tumour, node, metastasis; AFP: alpha fetoprotein; AJCC: American Joint Committee on Cancer; HCSS: hepatocellular carcinoma-specific survival; OR: odds ratio; CI: confidence interval.
Acknowledgements
The authors acknowledge the efforts of the SEER program in the creation of the SEER database.
Funding
This work was supported by the Project of Invigorating Health Care through Science, Technology and Education: Jiangsu Provincial Medical Youth Talent (QNRC2016331).
Competing Interests
The authors have declared that no competing interest exists.
References
1. Bray F, Ferlay J, Soerjomataram I, Siegel RL. et al. Global cancer statistics 2018: GLOBOCAN estimates of incidence and mortality worldwide for 36 cancers in 185 countries. CA Cancer J Clin. 2018;68:394-424
2. Sakurai T, Kudo M. Molecular Link between Liver Fibrosis and Hepatocellular Carcinoma. Liver Cancer. 2013;2:365-6
3. El-Serag HB. Hepatocellular carcinoma. N Engl J Med. 2011;365:118-27
4. Surveillance, Epidemiology, and End Results (SEER) Program (www.seer.cancer.gov) SEER*Stat Database: Incidence - SEER 9 Regs Research Data, Nov 2018 Sub (1975-2016) <Katrina/Rita Population Adjustment> - Linked To County Attributes - Total U.S, 1969-2017 Counties, National Cancer Institute, DCCPS, Surveillance Research Program, released April 2019, based on the November 2018 submission
5. Ishak K, Baptista A, Bianchi L. et al. Histological grading and staging of chronic hepatitis. J Hepatol. 1995;22:696-9
6. Edge SB, Byrd DR, Compton CC. American Joint Committee on Cancer Staging Manual. 7th ed. New York: Springer. 2009
7. Cerami E, Gao J, Dogrusoz U. et al. The cBio cancer genomics portal: an open platform for exploring multidimensional cancer genomics data. Cancer Discov. 2012;2:401-4
8. Liu H, Cen D, Yu Y. et al. Does fibrosis have an impact on survival of patients with hepatocellular carcinoma: evidence from the SEER database? BMC Cancer. 2018;18:1125
9. Kamarajah SK. Fibrosis score impacts survival following resection for hepatocellular carcinoma (HCC): A Surveillance, End Results and Epidemiology (SEER) database analysis. Asian J Surg. 2018;41:551-61
10. Pawlik TM, Poon RT, Abdalla EK. et al. Critical appraisal of the clinical and pathologic predictors of survival after resection of large hepatocellular carcinoma. Arch Surg. 2005;140:450-8
Author contact
![]() Corresponding authors: Guo-Qing Jiang, Department of Hepatobiliary Surgery, Clinical Medical College, Yangzhou University, 98 West Nantong Rd, Yangzhou 225000, China. Tel.: +86-514-87373382; E-mail: jgqing2003com or Xuehao Wang, Department of Liver Transplantation Center, The First Affiliated Hospital of Nanjing Medical University, 300 Guangzhou Rd, Nanjing 210029, China. Tel: +86-025-68136053; Email: wangxhedu.cn.
Corresponding authors: Guo-Qing Jiang, Department of Hepatobiliary Surgery, Clinical Medical College, Yangzhou University, 98 West Nantong Rd, Yangzhou 225000, China. Tel.: +86-514-87373382; E-mail: jgqing2003com or Xuehao Wang, Department of Liver Transplantation Center, The First Affiliated Hospital of Nanjing Medical University, 300 Guangzhou Rd, Nanjing 210029, China. Tel: +86-025-68136053; Email: wangxhedu.cn.